


Published online Dec 19, 2023. doi: 10.5498/wjp.v13.i12.1061
Peer-review started: September 21, 2023
First decision: October 9, 2023
Revised: October 23, 2023
Accepted: November 8, 2023
Article in press: November 8, 2023
Published online: December 19, 2023
Processing time: 89 Days and 3.9 Hours
The literature has discussed the relationship between environmental factors and depressive disorders; however, the results are inconsistent in different studies and regions, as are the interaction effects between environmental factors. We hypo
To investigate the effects of meteorological factors and air pollution on depressive disorders, including their lagged effects and interactions.
The samples were obtained from a class 3 hospital in Harbin, China. Daily hos
Data for 2922 d were included in the study, with no missing values. The total number of depressive admissions was 83905. Medium to high correlations existed between environmental factors. Air temperature (AT) and wind speed (WS) significantly affected the number of admissions for depression. An extremely low temperature (-29.0
Meteorological factors and the air pollutant NO2 affect daily hospital admissions for depressive disorders, and interactions exist between meteorological factors and ambient air pollution.
Core Tip: This retrospective study assessed the influence of environmental factors on depressive disorders. Daily hospital admissions for depressive disorders at a hospital in Harbin, China from 2015 to 2022 were obtained. Four meteorological factors and six air pollutants were considered predictors in the time-series models. Air temperature, atmospheric pressure, wind speed, relative humidity, and nitrogen dioxide have effects on daily hospital admissions for depressive disorders, and interactions exist between meteorological factors and ambient air pollution.
- Citation: Hu T, Xu ZY, Wang J, Su Y, Guo BB. Meteorological factors, ambient air pollution, and daily hospital admissions for depressive disorder in Harbin: A time-series study. World J Psychiatry 2023; 13(12): 1061-1078
- URL: https://www.wjgnet.com/2220-3206/full/v13/i12/1061.htm
- DOI: https://dx.doi.org/10.5498/wjp.v13.i12.1061
Depressive disorder (also known as depression) is a common mental disorder that involves depressed mood and loss of pleasure or interest in activities for long periods of time[1]. Approximately 280 million people (3.8%) worldwide experience depression[2]. Depressive disorder is a complex phenomenon that represents the interplay between social, psychological, and biological mechanisms[1]. The crucial biochemical mechanism underlying depression lies in the disruption of synaptic chemical transmission, which leads to a functional deficiency in the brain's monoaminergic transmitters including norepinephrine, serotonin (5-hydroxytryptamine), and/or dopamine[3]. These mechanisms have become targets of antidepressant action; for example, selective serotonin reuptake inhibitors such as fluoxetine are typical antidepressant medications[1] used for regulating serotonergic transmission.
In the last couple of years, accumulated evidence suggests that depressive disorder is also affected by environmental factors[4], including meteorological factors[5-8], ambient air pollution[9-13], light exposure[14-16], and access to green space[17,18]. An increase in temperature has been found to exacerbate psychiatric disease hospitalizations[19] in Greece, deteriorate mental well-being, and increase depressive language and suicide rates[20] in North America. Exposure to fine particles (PM2.5), inhalable particles (PM10), nitrogen dioxide (NO2), sulfur dioxide (SO2), and carbon monoxide (CO) was positively associated with depression, and the risk of depression increased with exposure to high levels of these pollutants[21]. Sunlight intensity may also be associated with depressive symptoms[22]. People reporting inadequate natural light in their dwellings were more likely to report depression[15]. This strongly suggests that environmental factors play a role in altering serotonin levels, leading to depression. Corresponding therapies, such as bright-light therapy, have been developed and used, and have evolved into effective treatments that act on serotonin and other monoaminergic pathways[16].
While the literature has discussed the relationship between environmental factors and depressive disorders, the interactions between different environmental factors have rarely been considered. Moreover, the results of different studies have been inconsistent. This study aimed to investigate the effects of environmental factors on depressive disorders. We obtained environmental data containing four meteorological factors and six air pollutants and modeled the interactions between these environmental factors simultaneously to gather more precise evidence and obtain a regional supplement for this research field.
To measure the precise effects of and the interaction between meteorological factors and air pollution on depressive disorders, we obtained as our sample daily hospital admission data for depressive disorders at a class 3 hospital in Harbin, China from January 1, 2015 to December 31, 2022. Data on the meteorological factors and air pollution for each day of admission were also collected to construct a predictive model.
Data from 2922 d were obtained from the information management system developed and used by the hospital. Patient information included the visit time and diagnosis. Individual identifiers were excluded. Patients with permanent residence in Harbin were selected, and those with other mental disorders were excluded. Daily depressive disorder admission data equaled the sum of depressive outpatient and hospitalization data. The diagnosis of depressive disorder (coded as F32-F33 ICD-10 diagnoses) refers to GB/T 14396-2016", classification and Code of Diseases"[23].
Meteorological data for the same period from 2015 to 2022 for Harbin, China, were collected from the China meteorological data service centre[24], including daily mean air temperature (AT), daily mean atmospheric pressure (AP), wind speed (WS), and relative humidity (RH).
Ambient air pollution data included six international standard air pollutants that have been extensively investigated previously[12]: PM2.5, PM10, SO2, CO, NO2, and ozone (O3, usually measured at maximum 8-h average concentrations). The pollutant data were collected from the China Air Quality Online Monitoring and Analysis platform[25]. For all ambient air pollutants, we averaged all valid monitoring measurements each day to obtain their daily mean concentrations, in line with previous studies[12,26].
To conduct a time-series analysis, information on time-related variables was collected for modeling, such as the day of admission and public holidays. A sequence of calendar times was generated to indicate the time trends.
All data were inspected and preprocessed using Microsoft excel and IBM SPSS 25.0. No missing values or outliers were identified. Descriptive analysis, correlation calculations, time-series modeling, and plotting were conducted using R version 4.2.3. The mean value; SD; and minimum, maximum, median, and quartile (P25 and P75) were used to describe the data. The correlation coefficients between variables were calculated using Spearman’s correlation analysis with the R package psych. We conducted a time-series analysis using the R packages dlnm[27], mgcv[28], rsm[29], and splines, modeling the effects of and interactions between various environmental factors. The R package ggplot2[30] was used to visualize the results. All statistical tests were two-tailed probability tests, α = 0.05. Statistical results with P < 0.05, such as associations and differences, were considered statistically significant.
We used generalized additive models with quasi-Poisson regression to estimate the meteorological effects of each factor. The covariates in the models included a natural cubic spline of calendar time with 14 degrees of freedom, which modeled time trends in hospital admissions for depressive disorders, and two indicator variables for the day of the week and public holidays, accounting for potential variations in hospital admissions over weekdays, weekends, and holidays. Natural cubic splines of the daily AT, AP, WS, and RH with three degrees of freedom were included as predictors. To assess the potential lagged effects of meteorological factors, we included lags of up to seven days in the model for non-cumulative effects, similar to the methodology of a previously published study[31]. The choice of calendar time df was determined by calculating the minimum sum of the absolute values of the partial autocorrelation function based on the residuals of the underlying model, consistent with the residual independence principle[31]. Choices of meteorological factors dfs have been recommended by papers on time-series analyses[32] and have been adopted by most studies. The time-series analysis model for a single meteorological factor is as follows:
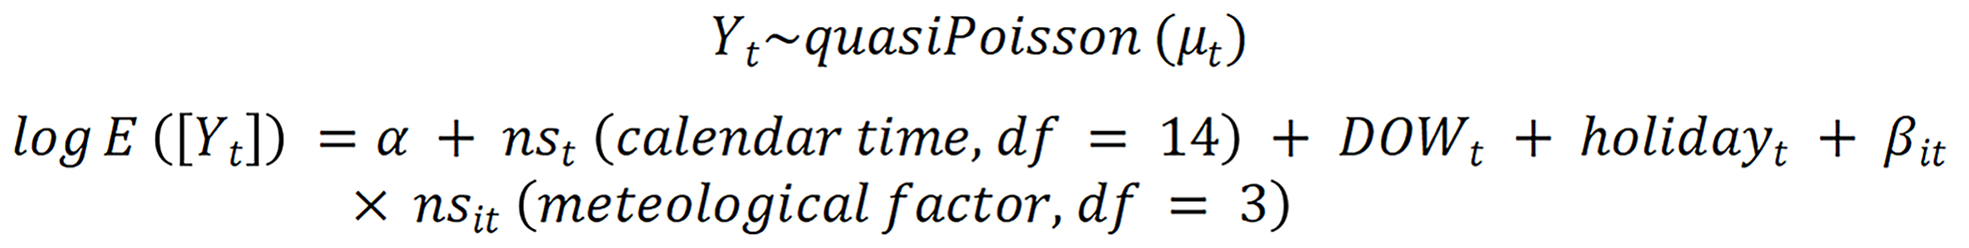
Where E (Yt) denotes the expected number of depressive disorder admissions on day t; α is the intercept; ns represents the natural cubic spline function; and βit is the exposure coefficients of meteorological factors and their lagged effects. We included the immediate and lagged effects of each air pollutant in the model and used meteorological factors as covariates. The time-series analysis model for a single air pollutant is as follows:

Where (air pollutant) represents lags of 0 to 7 for cumulative and non-cumulative exposures. Finally, we incorporated each meteorological factor and air pollutant into a bivariate response surface model to inspect the interaction effects of each pair of meteorological factors and air pollutants on hospital admissions for depressive disorders. The model for interaction effects is as follows:

Where te is the interaction effect of meteorological factors and air pollutants (on the day with the strongest lag effect) on daily hospital admissions for depressive disorders. Results are expressed as relative percentage change (%) and estimated 95% confidence intervals (CIs) at hospital admissions for depressive disorders of certain meteorological factor levels or per unit increment of air pollutants.
The general features of all the variables are summarized in Table 1. The total number of hospital admissions for depressive disorders from January 1, 2015 to December 31, 2022 included in the study was 83905, with a daily average admissions of 28.7. During the studied period, the daily average AT in Harbin was 5.4 ℃, and the daily average AP was 749.3 mmHg. The average WS was 2.9 m/s. The mean RH was 66.2%. The climate in Harbin is cold but mild, which means that it is not excessively windy or dry most times of the year, and the AP remains slightly lower than the standard. The daily average concentrations of PM2.5, PM10, SO2, CO, NO2, and O3_8h (the maximum 8-h average concentration of ozone) were 47.2 μg/m3, 71.3 μg/m3, 22.0 μg/m3, 0.9 mg/m3, 36.7 μg/m3, and 75.8 μg/m3, respectively. There is relatively high variability in air pollution, although the concentration levels are usually low according to the quartiles.
| Variable (unit) | mean ± SD | Percentile | ||||
| Min | P25 | Median | P75 | Max | ||
| Admissions for depressive disorder (n) | 28.7 ± 21.2 | 0 | 9 | 28 | 42 | 130 |
| AT (℃) | 5.4 ± 15.1 | -29.2 | -8.4 | 7.8 | 19.0 | 30.6 |
| AP (mmHg) | 749.3 ± 7.0 | 727.9 | 743.7 | 748.9 | 754.8 | 768.0 |
| WS (m/s) | 2.9 ± 1.2 | 0.4 | 2.0 | 2.6 | 3.5 | 9.8 |
| RH (%) | 66.2 ± 15.6 | 14.9 | 56.1 | 67.9 | 77.8 | 100.0 |
| PM2.5 (μg/m3) | 47.2 ± 54.6 | 0.0 | 16.0 | 29.0 | 58.0 | 906.0 |
| PM10 (μg/m3) | 71.3 ± 59.3 | 0.0 | 35.0 | 53.0 | 87.0 | 644.0 |
| SO2 (μg/m3) | 22.0 ± 23.6 | 3.0 | 9.0 | 13.0 | 26.0 | 222.0 |
| CO (mg/m3) | 0.9 ± 0.4 | 0.3 | 0.6 | 0.8 | 1.0 | 4.3 |
| NO2 (μg/m3) | 36.7 ± 17.8 | 8.0 | 24.0 | 33.0 | 44.0 | 145.0 |
| O3_8h (μg/m3) | 75.8 ± 34.1 | 0.0 | 50.0 | 71.0 | 96.0 | 253.0 |
The correlation coefficients between the meteorological factors and air pollutants are shown in Table 2. All Spearman’s correlation coefficients were statistically significant, except for the correlation between RH and CO. There was a moderate correlation among AT, AP, and air pollutants. Relatively high correlations among the air pollutants (except for O3) were found.
| AP | WS | RH | PM2.5 | PM10 | SO2 | CO | NO2 | O3_8h | |
| AT | -0.75c | 0.07c | 0.18c | -0.61c | -0.46c | -0.78c | -0.49c | -0.42c | 0.60c |
| AP | -0.27c | -0.17c | 0.50c | 0.40c | 0.62c | 0.41c | 0.44c | -0.48c | |
| WS | -0.35c | -0.16c | -0.13c | -0.11c | -0.26c | -0.41c | 0.17c | ||
| RH | -0.17c | -0.25c | -0.19c | -0.02 | -0.06c | -0.21c | |||
| PM2.5 | 0.92c | 0.77c | 0.78c | 0.76c | -0.19c | ||||
| PM10 | 0.69c | 0.71c | 0.75c | -0.09c | |||||
| SO2 | 0.67c | 0.64c | -0.35c | ||||||
| CO | 0.76c | -0.21c | |||||||
| NO2 | -0.24c |
In the single meteorological factor model for AT, AP, WS, and RH, we reported relative risks (RRs) with 95%CIs of the depressive disorder admissions for each level of the meteorological factor. The overall relationships between each meteorological factor and hospital admissions for depressive disorders are summarized in Figures 1-4. As shown in Figure 1A, there was a sharp effect of extremely low temperature, although, in Figure 1B, the overall low temperature had no positive effect on RR. Figure 2 shows the mild effect of AP on RR, which is close to zero. Figure 3 shows a larger effect of low WS and a smaller effect of high WS. As shown in Figure 4, both moderate and high RH appeared to have relatively small effects.


To provide more certainty and precision in the estimates, we further investigated the effect of each meteorological factor by calculating and plotting the RRs by these factors at lags 0-7, as shown in Figures 5-8. The results for AT showed significant increases at lags 0-2 and 5-6. Figure 5 shows that an extremely low temperature (-29.0 ℃) at lag 0 increased daily hospital admissions for depressive disorders by 1.53 times (95%CI: 1.23-1.89) relative to median temperature (7.8


Next, the concentrations on the same day (lag 0) and 1-7 d ago (lag 1-7) of the six air pollutants were included in the time-series model. The results are shown in Figure 9. Among these air pollution variables, only NO2 showed significant effects, and the effects of concentration increases in NO2 at lags 0-7 were all statistically significant, despite their weakness. The cumulative exposure to air pollution was also modeled and plotted, as shown in Figure 10. Consistent with the non-cumulative results, only NO2 exhibited a significant cumulative effect. As NO2 accumulated, the exposure effect on daily hospital admissions for depressive disorders increased slightly and smoothly, reaching its highest value at lag 7, where RR = 1.0047 (95%CI: 1.0024-1.0071).


A bivariate response surface model was generated to analyze the interactions between environmental factors. AT significantly interacted with all pollutants included in this study, except for NO2. As shown in Figure 11, extremely low ATs combined with high concentrations of PM2.5 and PM10 increased the number of admissions for depressive disorders. Combination of low temperature, low SO2, and of high temperature and high SO2 affected hospital admissions. Extremely low temperatures at any CO concentration increased the admission rate. When hot, a low CO concentration had an increasing effect, whereas a high CO concentration did not. Low temperatures and high O3 concentrations had decreasing effects. Figure 12 shows the interactions between the AP and air pollutants. The interactions between the AP and PM2.5, CO, NO2, and O3_8h were statistically significant. Low APs combined with low CO, low NO2, or high O3 had increasing effects, whereas high APs combined with high PM2.5, high CO, or low O3 increased hospital admissions for depressive disorders. The interaction patterns of AP and PM2.5/CO/NO2 were similar; however, the pattern between AP and O3 was the opposite. The interactions between WS and air pollutants are shown in Figure 13. SO2 had the only significant interaction effect with WS, indicating that most single effects of air pollutants were consistent at different levels of WS. Generally, when high WS and high concentrations of pollutants coexisted, hospital admissions for depressive disorders did not increase. Finally, the interactions between RH and air pollutants were analyzed, and the results are plotted in Figure 14. No significant interaction effects were found between any pair, indicating that the effects of air pollution were relatively stable across different levels of RH.


Based on daily hospital admission data for depressive disorders from 2015 to 2022 in a hospital in Harbin, China, we obtained environmental data for the same period, including meteorological and ambient air pollution data, and conducted a time-series analysis to investigate the short-term exposure effects of these environmental factors on depressive disorders. Our results showed that meteorological factors, including AT and WS, could sharply influence daily hospital admissions, while AP, RH, and air pollutant NO2 (immediate, lagged, or cumulatively lagged) had significant but moderate or small effects. We modeled the relationship between meteorological factors and air pollution and found significant interaction effects between AT and PM2.5/PM10/SO2/CO/O3_8 h, AP and PM2.5/CO/NO2/O3_8 h, and WS and SO2.
Specifically, we found that the risk of depressive disorder admission increases by 53% when an extremely low temperature (-29 ℃, for Harbin) occurs. This finding was consistent with the results of a previous study conducted in Europe[8], but contrary to most similar studies[5,14,33-35], where increased or high AT was associated with increased depressive symptoms or higher hospital admissions. This inconsistency may have resulted from regional differences in the areas of interest selected by each study. Harbin City (45°25′-45°30′N, 126°20–126°25′E) is located in Northeast China and has a typical continental monsoon climate. The highest temperature in the study period was 30.6 ℃, indicating that it is never excessively hot in Harbin, unlike in Hong Kong[5] or Shanghai[33]. From reference[6], we know that both low and high temperatures might be important drivers of morbidity in mental disorders and that lower temperatures may have a more general and widespread effect on cause-specific morbidity. The result in Europe[8] even showed a protective impact of a higher AT (> 14.2 ℃), which may serve as a reference for explaining the zero effects of a higher temperature in Harbin. A famous nickname for Harbin City is “Ice City,” indicating its freezing coldness in winter. Studies have shown that exercise interventions[15] and frequent visits to outdoor green spaces[17] effectively improve depression symptoms. Therefore, extremely low temperatures can negatively affect depressive symptoms by limiting outdoor exercises and visits to green spaces. Furthermore, low temperatures usually co-exist with insufficient sunlight in winter, and reduced sunlight exposure, both in intensity and duration, is related to an increased risk of depression, according to previous studies[22,36]. Despite this inconsistency with most similar studies, this study confirmed the importance of AT in depressive admissions.
In addition, we found a 58% increase in depressive disorder admissions when the WS approached zero. We propose two possible mechanisms underlying the effect of low WS. First, as coal-fired heating in the cold period always causes severe air pollution in Harbin[37,38], low WS would worsen the air pollution. Air pollution-induced inflammation of the respiratory airways is associated with depression in vulnerable individuals[39]. Severe air pollution may also decrease outdoor activities and sunlight exposure, thereby increasing the risk of depressive disorder[40]. Hence, low WS during cold winters may be associated with depressive symptoms caused by severe air pollution. Second, a previous study showed that during warmer periods, warm and dry winds have an increasing effect on the concentration of positive ions in the atmosphere, which increases blood and brain serotonin levels[8]. Low WS may not provide this improving effect on depressive symptoms.
We also found relatively small effects of AP, RH, and the air pollutant NO2. These results are consistent with previous studies, where high RH levels seem to be pertinent to suicide risk[41] and nitrogen oxides increase the risk of mental health problems, probably via mechanisms of inflammation and neuronal injury[35].
The distinctive results of this study were the interactions between AT and PM2.5/PM10/SO2/CO/O3_8 h, AP and PM2.5/CO/NO2/O3_8 h, and WS and SO2. After carefully inspecting the patterns of these interactions, we assumed that most interactions corresponded to the relationship between the increased risk of depressive disorder and severe air pollution caused by coal-fired heating. In most significant interactions, typical meteorological factor levels in winter (including low AT and high AP) combined with high levels of air pollutants were associated with depressive symptoms. The interaction between WS and SO2 was the same, as both high WS plus low SO2 and low WS plus high SO2 seemed unfavorable for outdoor activities and sunlight exposure. The increasing effect of low WS plus low SO2 may appear during warmer periods, as low WS does not improve serotonin levels. The cases of O3 were different from those of the others. We assumed that the reason for this inconsistency between O3 and other air pollutants was seasonal differences. The O3 concentration is typically high in the summer, whereas the concentrations of other pollutants are high in the winter.
The strength of our study lies in the precise effects we modeled and measured, especially the interaction between meteorological factors and ambient air pollution. Although our results indicate the effects of environmental factors on hospital admissions for depressive disorders, they are inconsistent with most similar studies and need to be replicated in other methodologically superior studies. The results cannot be generalized to the entire population of China because the sample came from only one northeastern city and urban population. Patient information was insufficient, which limited further analyses.
Our study suggests that meteorological factors and the air pollutant NO2 affect daily hospital admissions for depressive disorders and that interaction effects exist between meteorological factors and ambient air pollution. Clinicians and patients are encouraged to pay more attention to the environmental effects on depressive symptoms. More stringent air quality control measures may be helpful to protect public mental health. Further studies involving more cities in China and a larger sample should be conducted to enable generalization. Thorough studies into the underlying mechanisms for environment impacting mental health are also warranted.
Environmental factors have been shown to affect individual mental health; however, the relationships and effects of different environmental factors in relatively cold areas have not yet been clarified.
We studied the effects of environmental factors, including their interaction effects, on daily hospital admissions for depressive disorders, aiming to discover the patterns of interaction between various environmental factors and provide regional references for this research field.
To investigate the single and interaction effects of environmental factors, we modeled, measured, and plotted these potential effects and added evidence to explore the complex relationship between environmental factors and human mental health.
We performed a retrospective study using data from Harbin, China between 2015 and 2022, including daily hospital admissions for depressive disorders, meteorological data, and air pollution data. A time-series analysis was conducted using generalized additive models with quasi-Poisson regression to measure the effect of each single factor on depression. A bivariate response surface model was used to model the interaction effects of different factors. Our data came from a higher-latitude area, offering an opportunity to investigate regional differences in relationship patterns and the effects of environmental factors.
Our results showed that air temperature and wind speed influenced daily hospital admissions. Extremely low temperatures and wind speeds could increase daily hospital admissions for depressive disorders by approximately 50%. atmospheric pressure, relative humidity, and the air pollutant nitrogen dioxide had significant but moderate effects. Interaction effects between three meteorological factors and six air pollutants were discovered.
Meteorological factors and air pollutants have single and interaction effects on daily hospital admissions for depressive disorders, and the effect pattern may be related to coal-fired heating in winter.
Specific mechanisms behind the complex relationships of environmental factors are to be studied.
Provenance and peer review: Unsolicited article; Externally peer reviewed.
Peer-review model: Single blind
Specialty type: Psychiatry
Country/Territory of origin: China
Peer-review report’s scientific quality classification
Grade A (Excellent): 0
Grade B (Very good): B, B
Grade C (Good): C
Grade D (Fair): 0
Grade E (Poor): 0
P-Reviewer: Dragano N, Germany; Lauriano ER, Italy; Kar SK, India S-Editor: Qu XL L-Editor: A P-Editor: Xu ZH
| 1. | World Health Organization. Depressive disorder (depression). 2023. Available from: https://www.who.int/news-room/fact-sheets/detail/depression. |
| 2. | Institute of Health Metrics and Evaluation. Global Health Data Exchange (GHDx). 2023. Available from: https://vizhub.healthdata.org/gbd-results/. |
| 3. | Brigitta B. Pathophysiology of depression and mechanisms of treatment. Dialogues Clin Neurosci. 2002;4:7-20. [RCA] [PubMed] [DOI] [Full Text] [Full Text (PDF)] [Cited by in Crossref: 104] [Cited by in RCA: 160] [Article Influence: 12.3] [Reference Citation Analysis (0)] |
| 4. | Dean J, Keshavan M. The neurobiology of depression: An integrated view. Asian J Psychiatr. 2017;27:101-111. [RCA] [PubMed] [DOI] [Full Text] [Cited by in Crossref: 522] [Cited by in RCA: 462] [Article Influence: 57.8] [Reference Citation Analysis (0)] |
| 5. | Chan EYY, Lam HCY, So SHW, Goggins WB, Ho JY, Liu S, Chung PPW. Association between Ambient Temperatures and Mental Disorder Hospitalizations in a Subtropical City: A Time-Series Study of Hong Kong Special Administrative Region. Int J Environ Res Public Health. 2018;15. [RCA] [PubMed] [DOI] [Full Text] [Full Text (PDF)] [Cited by in Crossref: 42] [Cited by in RCA: 59] [Article Influence: 8.4] [Reference Citation Analysis (0)] |
| 6. | Zhang S, Yang Y, Xie X, Li H, Han R, Hou J, Sun J, Qian ZM, Wu S, Huang C, Howard SW, Tian F, Deng W, Lin H. The effect of temperature on cause-specific mental disorders in three subtropical cities: A case-crossover study in China. Environ Int. 2020;143:105938. [RCA] [PubMed] [DOI] [Full Text] [Cited by in Crossref: 40] [Cited by in RCA: 55] [Article Influence: 11.0] [Reference Citation Analysis (0)] |
| 7. | Tapak L, Maryanaji Z, Hamidi O, Abbasi H, Najafi-Vosough R. Investigating the effect of climatic parameters on mental disorder admissions. Int J Biometeorol. 2018;62:2109-2118. [RCA] [PubMed] [DOI] [Full Text] [Cited by in Crossref: 10] [Cited by in RCA: 19] [Article Influence: 2.7] [Reference Citation Analysis (0)] |
| 8. | Brazienė A, Venclovienė J, Vaičiulis V, Lukšienė D, Tamošiūnas A, Milvidaitė I, Radišauskas R, Bobak M. Relationship between Depressive Symptoms and Weather Conditions. Int J Environ Res Public Health. 2022;19. [RCA] [PubMed] [DOI] [Full Text] [Full Text (PDF)] [Cited by in Crossref: 3] [Cited by in RCA: 5] [Article Influence: 1.7] [Reference Citation Analysis (0)] |
| 9. | Braithwaite I, Zhang S, Kirkbride JB, Osborn DPJ, Hayes JF. Air Pollution (Particulate Matter) Exposure and Associations with Depression, Anxiety, Bipolar, Psychosis and Suicide Risk: A Systematic Review and Meta-Analysis. Environ Health Perspect. 2019;127:126002. [RCA] [PubMed] [DOI] [Full Text] [Full Text (PDF)] [Cited by in Crossref: 338] [Cited by in RCA: 367] [Article Influence: 61.2] [Reference Citation Analysis (0)] |
| 10. | Borroni E, Pesatori AC, Bollati V, Buoli M, Carugno M. Air pollution exposure and depression: A comprehensive updated systematic review and meta-analysis. Environ Pollut. 2022;292:118245. [RCA] [PubMed] [DOI] [Full Text] [Cited by in Crossref: 39] [Cited by in RCA: 129] [Article Influence: 43.0] [Reference Citation Analysis (0)] |
| 11. | Liu Q, Wang W, Gu X, Deng F, Wang X, Lin H, Guo X, Wu S. Association between particulate matter air pollution and risk of depression and suicide: a systematic review and meta-analysis. Environ Sci Pollut Res Int. 2021;28:9029-9049. [RCA] [PubMed] [DOI] [Full Text] [Cited by in Crossref: 51] [Cited by in RCA: 61] [Article Influence: 15.3] [Reference Citation Analysis (0)] |
| 12. | Gu X, Guo T, Si Y, Wang J, Zhang W, Deng F, Chen L, Wei C, Lin S, Guo X, Wu S. Association Between Ambient Air Pollution and Daily Hospital Admissions for Depression in 75 Chinese Cities. Am J Psychiatry. 2020;177:735-743. [RCA] [PubMed] [DOI] [Full Text] [Cited by in Crossref: 39] [Cited by in RCA: 77] [Article Influence: 15.4] [Reference Citation Analysis (0)] |
| 13. | Vert C, Sánchez-Benavides G, Martínez D, Gotsens X, Gramunt N, Cirach M, Molinuevo JL, Sunyer J, Nieuwenhuijsen MJ, Crous-Bou M, Gascon M. Effect of long-term exposure to air pollution on anxiety and depression in adults: A cross-sectional study. Int J Hyg Environ Health. 2017;220:1074-1080. [RCA] [PubMed] [DOI] [Full Text] [Cited by in Crossref: 127] [Cited by in RCA: 135] [Article Influence: 16.9] [Reference Citation Analysis (0)] |
| 14. | Deng X, Brotzge J, Tracy M, Chang HH, Romeiko X, Zhang W, Ryan I, Yu F, Qu Y, Luo G, Lin S. Identifying joint impacts of sun radiation, temperature, humidity, and rain duration on triggering mental disorders using a high-resolution weather monitoring system. Environ Int. 2022;167:107411. [RCA] [PubMed] [DOI] [Full Text] [Cited by in Crossref: 3] [Cited by in RCA: 12] [Article Influence: 4.0] [Reference Citation Analysis (0)] |
| 15. | Taniguchi K, Takano M, Tobari Y, Hayano M, Nakajima S, Mimura M, Tsubota K, Noda Y. Influence of External Natural Environment Including Sunshine Exposure on Public Mental Health: A Systematic Review. Psychiatry Int. 2022;3:91-113. [RCA] [DOI] [Full Text] [Cited by in Crossref: 1] [Cited by in RCA: 1] [Article Influence: 0.3] [Reference Citation Analysis (0)] |
| 16. | Maruani J, Geoffroy PA. Bright Light as a Personalized Precision Treatment of Mood Disorders. Front Psychiatry. 2019;10:85. [RCA] [PubMed] [DOI] [Full Text] [Full Text (PDF)] [Cited by in Crossref: 48] [Cited by in RCA: 62] [Article Influence: 10.3] [Reference Citation Analysis (0)] |
| 17. | Twohig-Bennett C, Jones A. The health benefits of the great outdoors: A systematic review and meta-analysis of greenspace exposure and health outcomes. Environ Res. 2018;166:628-637. [RCA] [PubMed] [DOI] [Full Text] [Full Text (PDF)] [Cited by in Crossref: 919] [Cited by in RCA: 694] [Article Influence: 99.1] [Reference Citation Analysis (0)] |
| 18. | Liu Y, Wang R, Xiao Y, Huang B, Chen H, Li Z. Exploring the linkage between greenness exposure and depression among Chinese people: Mediating roles of physical activity, stress and social cohesion and moderating role of urbanicity. Health Place. 2019;58:102168. [RCA] [PubMed] [DOI] [Full Text] [Cited by in Crossref: 72] [Cited by in RCA: 75] [Article Influence: 12.5] [Reference Citation Analysis (0)] |
| 19. | Asimakopoulos LO, Koureta A, Benetou V, Lagiou P, Samoli E. Investigating the association between temperature and hospital admissions for major psychiatric diseases: A study in Greece. J Psychiatr Res. 2021;144:278-284. [RCA] [PubMed] [DOI] [Full Text] [Cited by in Crossref: 1] [Cited by in RCA: 3] [Article Influence: 0.8] [Reference Citation Analysis (0)] |
| 20. | Burke M, González F, Baylis P, Heft-Neal S, Baysan C, Basu S, Hsiang S. Higher temperatures increase suicide rates in the United States and Mexico. Nature Clim Change. 2018;8:723-729. [DOI] [Full Text] |
| 21. | Zeng Y, Lin R, Liu L, Liu Y, Li Y. Ambient air pollution exposure and risk of depression: A systematic review and meta-analysis of observational studies. Psychiatry Res. 2019;276:69-78. [RCA] [PubMed] [DOI] [Full Text] [Cited by in Crossref: 40] [Cited by in RCA: 71] [Article Influence: 11.8] [Reference Citation Analysis (0)] |
| 22. | Sarran C, Albers C, Sachon P, Meesters Y. Meteorological analysis of symptom data for people with seasonal affective disorder. Psychiatry Res. 2017;257:501-505. [RCA] [PubMed] [DOI] [Full Text] [Cited by in Crossref: 13] [Cited by in RCA: 20] [Article Influence: 2.5] [Reference Citation Analysis (0)] |
| 23. | National Health Commission. Classification and codes of diseases. Oct 13, 2016. [Cited 9 July 2023]. In: National standard full text disclosure system [Internet]. Available from: http://c.gb688.cn/bzgk/gb/showGb?type=online&hcno=8127A7785CA677952F9DA062463CBC41. |
| 24. | National Meteorological Information Centre (CMA Meteorological Data Centre). Daily Timed Data from automated weather stations in China. Database: CMA Meteorological Data Centre [Internet]. Available from: http://data.cma.cn/. |
| 25. | Wang J. Daily historical data of Harbin Air Quality. Database: Air quality historical data for main cities in China [Internet]. Available from: http://www.aqistudy.cn/historydata/. |
| 26. | Gu J, Shi Y, Zhu Y, Chen N, Wang H, Zhang Z, Chen T. Ambient air pollution and cause-specific risk of hospital admission in China: A nationwide time-series study. PLoS Med. 2020;17:e1003188. [RCA] [PubMed] [DOI] [Full Text] [Full Text (PDF)] [Cited by in Crossref: 69] [Cited by in RCA: 118] [Article Influence: 23.6] [Reference Citation Analysis (0)] |
| 27. | Gasparrini A. Distributed Lag Linear and Non-Linear Models in R: The Package dlnm. J Stat Softw. 2011;43:1-20. [PubMed] |
| 28. | Wood S. Generalized Additive Models: An Introduction with R, 2 edition. London: Chapman and Hall/CRC. 2017. |
| 29. | Lenth RV. Response-Surface Methods in R, Using rsm. Journal of Statistical Software. 2009;32:1-17. [RCA] [DOI] [Full Text] [Cited by in Crossref: 251] [Cited by in RCA: 251] [Article Influence: 15.7] [Reference Citation Analysis (0)] |
| 30. | Wickham H. ggplot2: Elegant Graphics for Data Analysis. New York: Springer-Verlag. 2016. |
| 31. | Mu J, Zeng D, Fan J, Liu M, Yu S, Ding W, Zhang S. Associations Between Air Pollution Exposure and Daily Pediatric Outpatient Visits for Dry Eye Disease: A Time-Series Study in Shenzhen, China. Int J Public Health. 2021;66:1604235. [RCA] [PubMed] [DOI] [Full Text] [Full Text (PDF)] [Cited by in Crossref: 4] [Cited by in RCA: 23] [Article Influence: 5.8] [Reference Citation Analysis (0)] |
| 32. | Gasparrini A, Armstrong B, Kenward MG. Distributed lag non-linear models. Stat Med. 2010;29:2224-2234. [RCA] [PubMed] [DOI] [Full Text] [Full Text (PDF)] [Cited by in Crossref: 1743] [Cited by in RCA: 1487] [Article Influence: 99.1] [Reference Citation Analysis (0)] |
| 33. | Peng Z, Wang Q, Kan H, Chen R, Wang W. Effects of ambient temperature on daily hospital admissions for mental disorders in Shanghai, China: A time-series analysis. Sci Total Environ. 2017;590-591:281-286. [RCA] [PubMed] [DOI] [Full Text] [Cited by in Crossref: 81] [Cited by in RCA: 82] [Article Influence: 10.3] [Reference Citation Analysis (0)] |
| 34. | Liu J, Varghese BM, Hansen A, Xiang J, Zhang Y, Dear K, Gourley M, Driscoll T, Morgan G, Capon A, Bi P. Is there an association between hot weather and poor mental health outcomes? A systematic review and meta-analysis. Environ Int. 2021;153:106533. [RCA] [PubMed] [DOI] [Full Text] [Cited by in Crossref: 67] [Cited by in RCA: 173] [Article Influence: 43.3] [Reference Citation Analysis (0)] |
| 35. | Lawrance EL, Thompson R, Newberry Le Vay J, Page L, Jennings N. The Impact of Climate Change on Mental Health and Emotional Wellbeing: A Narrative Review of Current Evidence, and its Implications. Int Rev Psychiatry. 2022;34:443-498. [RCA] [PubMed] [DOI] [Full Text] [Cited by in Crossref: 11] [Cited by in RCA: 89] [Article Influence: 29.7] [Reference Citation Analysis (0)] |
| 36. | Kim SY, Bang M, Wee JH, Min C, Yoo DM, Han SM, Kim S, Choi HG. Short- and long-term exposure to air pollution and lack of sunlight are associated with an increased risk of depression: A nested case-control study using meteorological data and national sample cohort data. Sci Total Environ. 2021;757:143960. [RCA] [PubMed] [DOI] [Full Text] [Cited by in Crossref: 30] [Cited by in RCA: 58] [Article Influence: 14.5] [Reference Citation Analysis (0)] |
| 37. | Fan M, He G, Zhou M. The winter choke: Coal-Fired heating, air pollution, and mortality in China. J Health Econ. 2020;71:102316. [RCA] [PubMed] [DOI] [Full Text] [Cited by in Crossref: 106] [Cited by in RCA: 72] [Article Influence: 14.4] [Reference Citation Analysis (0)] |
| 38. | Fu D, Shi X, Xing Y, Wang P, Li H, Li B, Lu L, Thapa S, Yabo S, Qi H, Zhang W. Contributions of extremely unfavorable meteorology and coal-heating boiler control to air quality in December 2019 over Harbin, China. Atmospheric Pollution Research. 2021;12:101217. [DOI] [Full Text] |
| 39. | Karata KS, Ocak S. Climatic changes and psychiatric disorders. Van Medical Journal. 2018;25:268-273. [DOI] [Full Text] |
| 40. | Wang R, Liu Y, Xue D, Yao Y, Liu P, Helbich M. Cross-sectional associations between long-term exposure to particulate matter and depression in China: The mediating effects of sunlight, physical activity, and neighborly reciprocity. J Affect Disord. 2019;249:8-14. [RCA] [PubMed] [DOI] [Full Text] [Cited by in Crossref: 51] [Cited by in RCA: 62] [Article Influence: 10.3] [Reference Citation Analysis (0)] |
| 41. | Florido Ngu F, Kelman I, Chambers J, Ayeb-Karlsson S. Correlating heatwaves and relative humidity with suicide (fatal intentional self-harm). Sci Rep. 2021;11:22175. [RCA] [PubMed] [DOI] [Full Text] [Full Text (PDF)] [Cited by in Crossref: 29] [Cited by in RCA: 31] [Article Influence: 7.8] [Reference Citation Analysis (0)] |