Copyright
©The Author(s) 2019.
World J Psychiatr. Dec 19, 2019; 9(8): 107-120
Published online Dec 19, 2019. doi: 10.5498/wjp.v9.i8.107
Published online Dec 19, 2019. doi: 10.5498/wjp.v9.i8.107
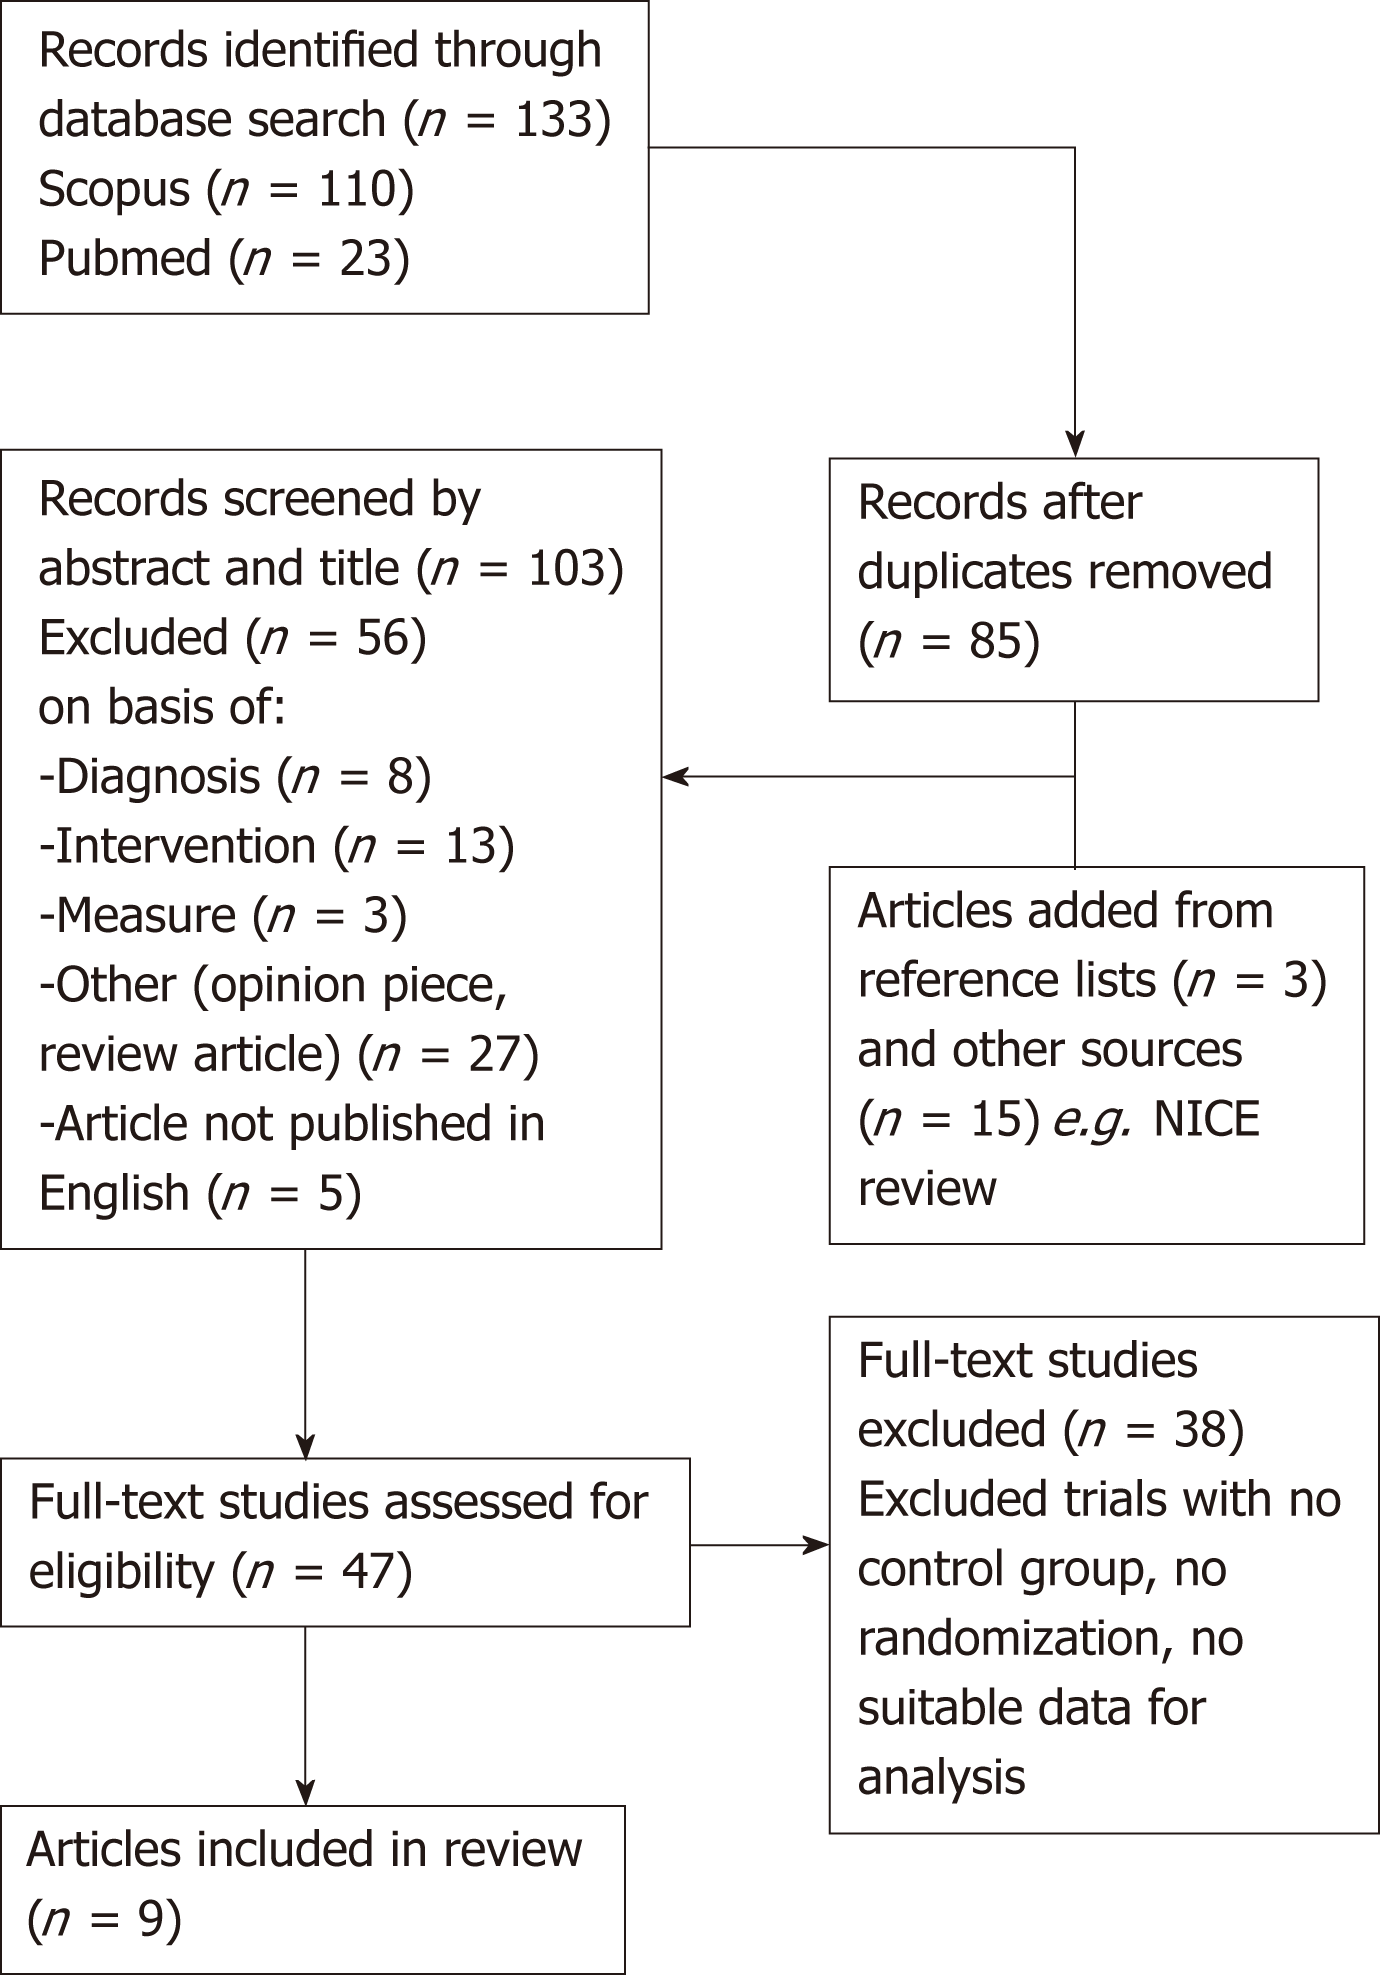
Figure 1 PRISMA flow diagram.
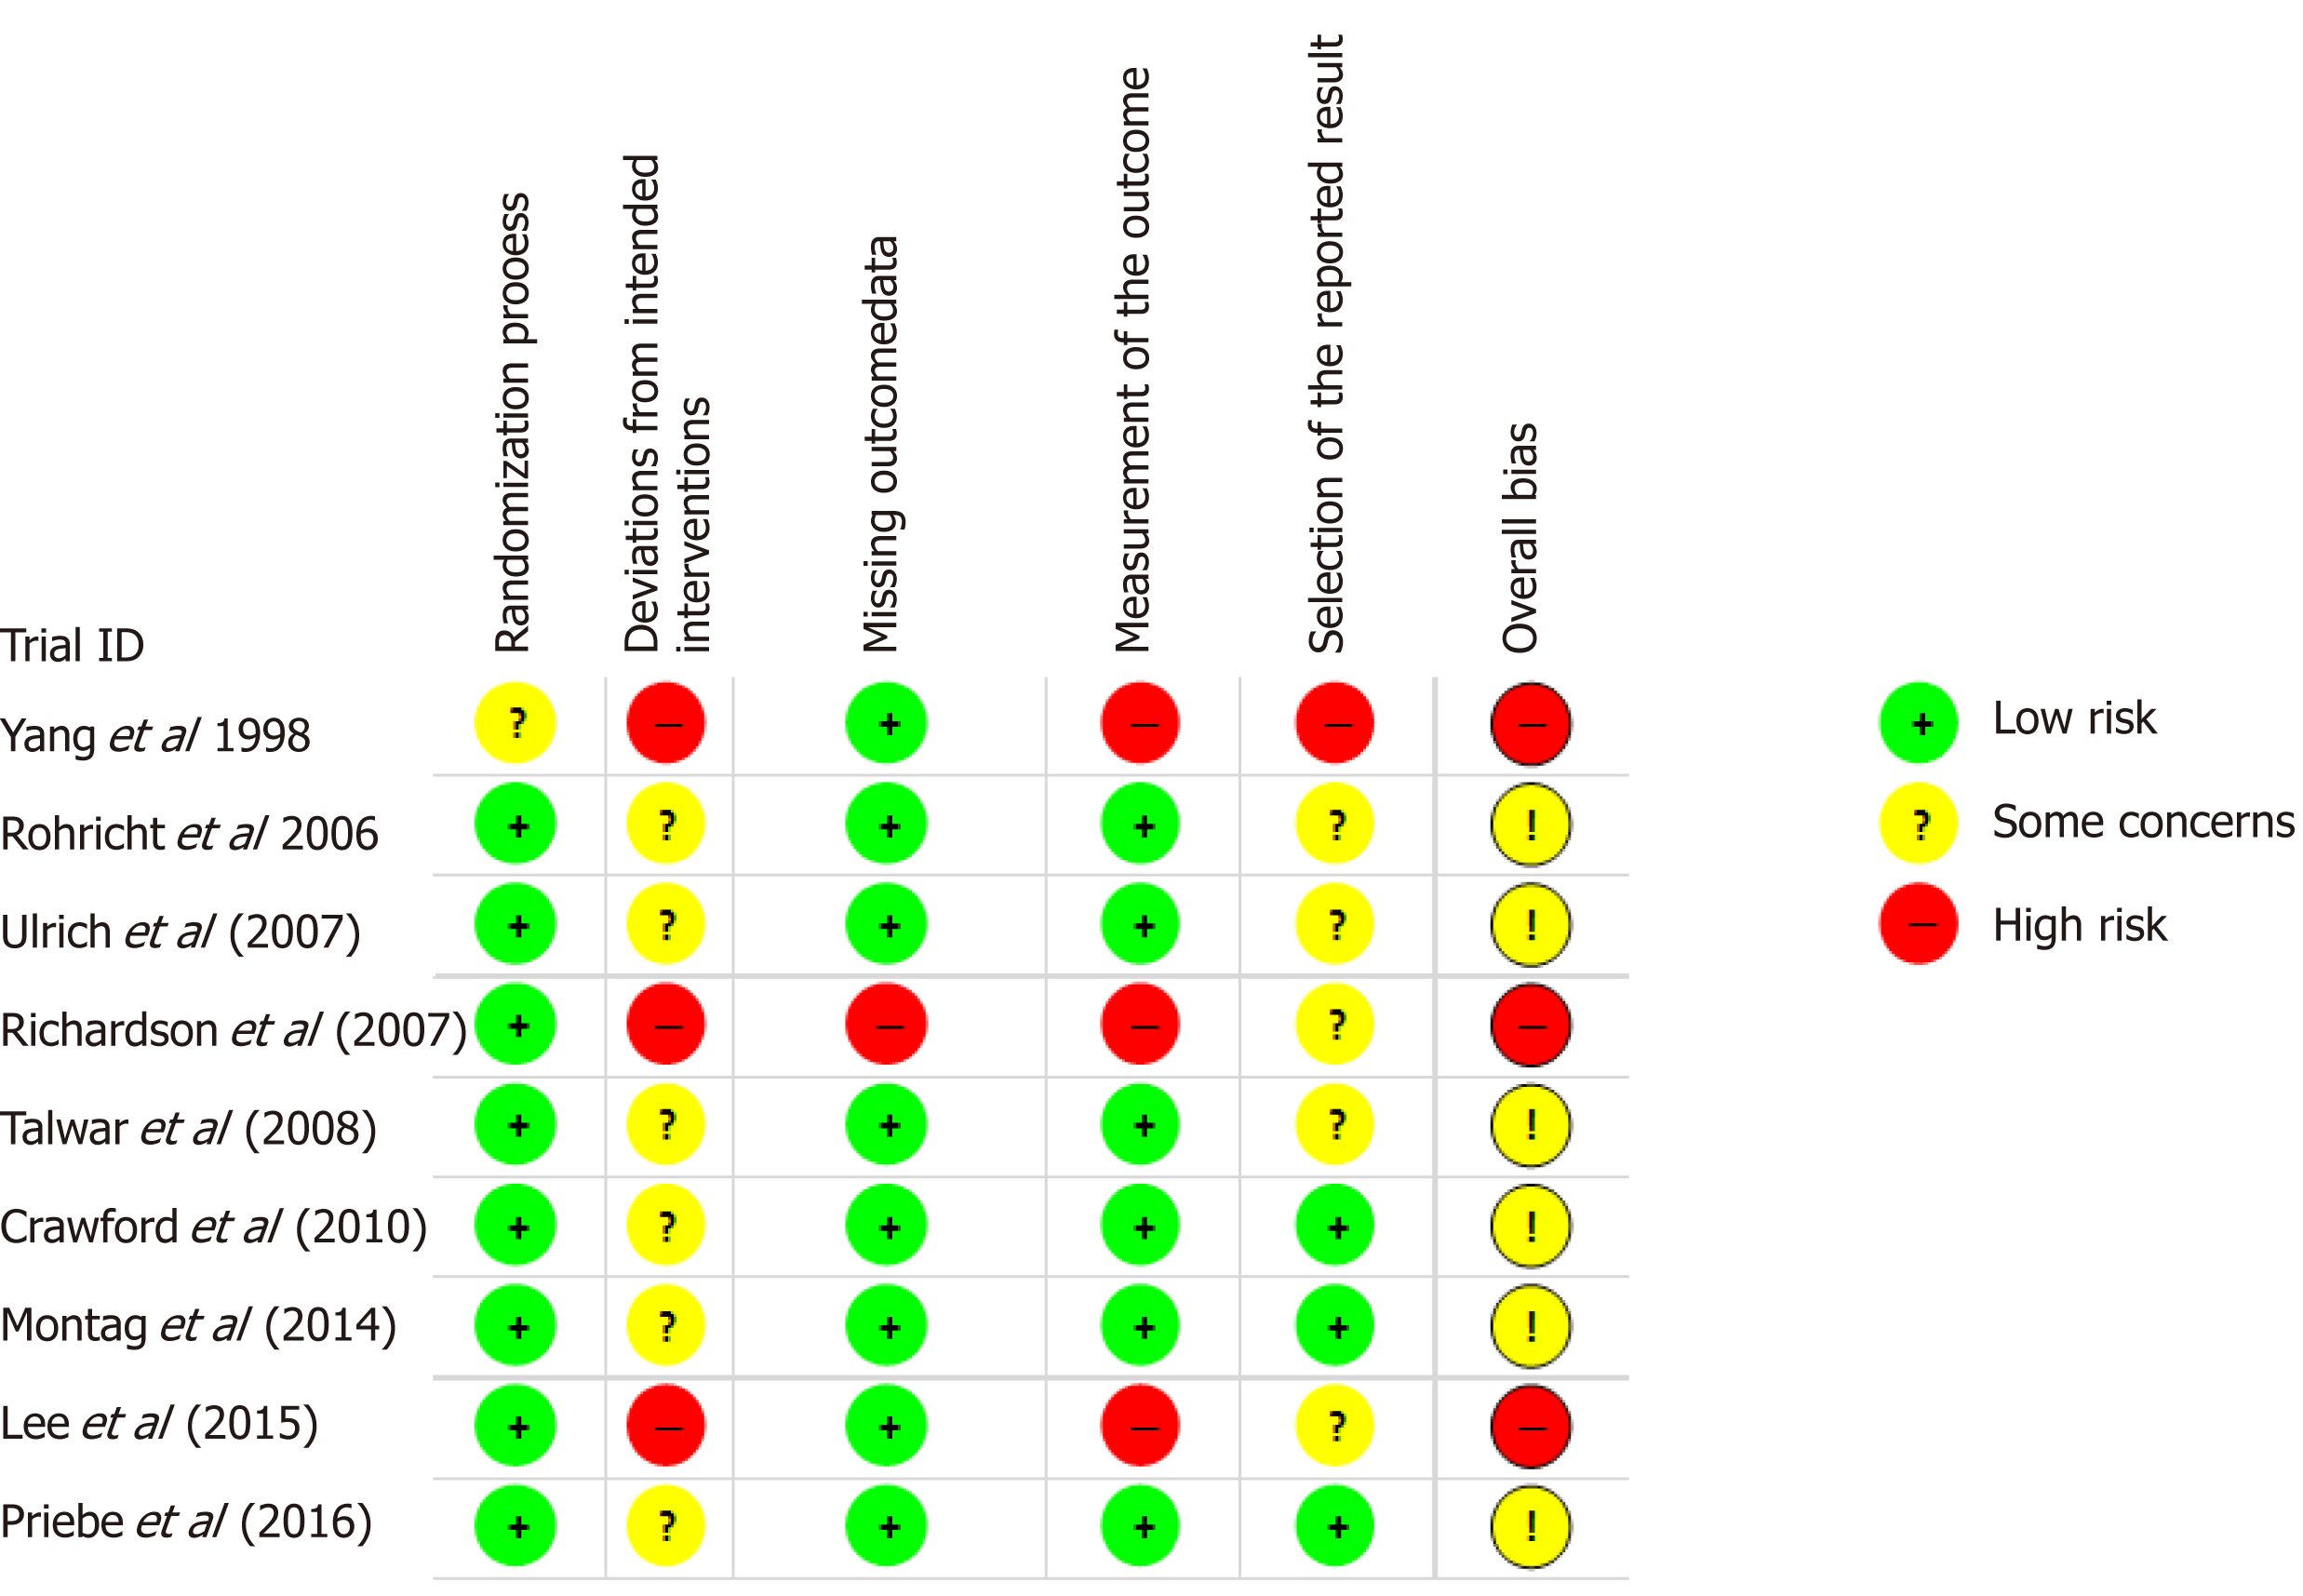
Figure 2 Risk of bias in each trial according to the Cochrane RoB2 tool.
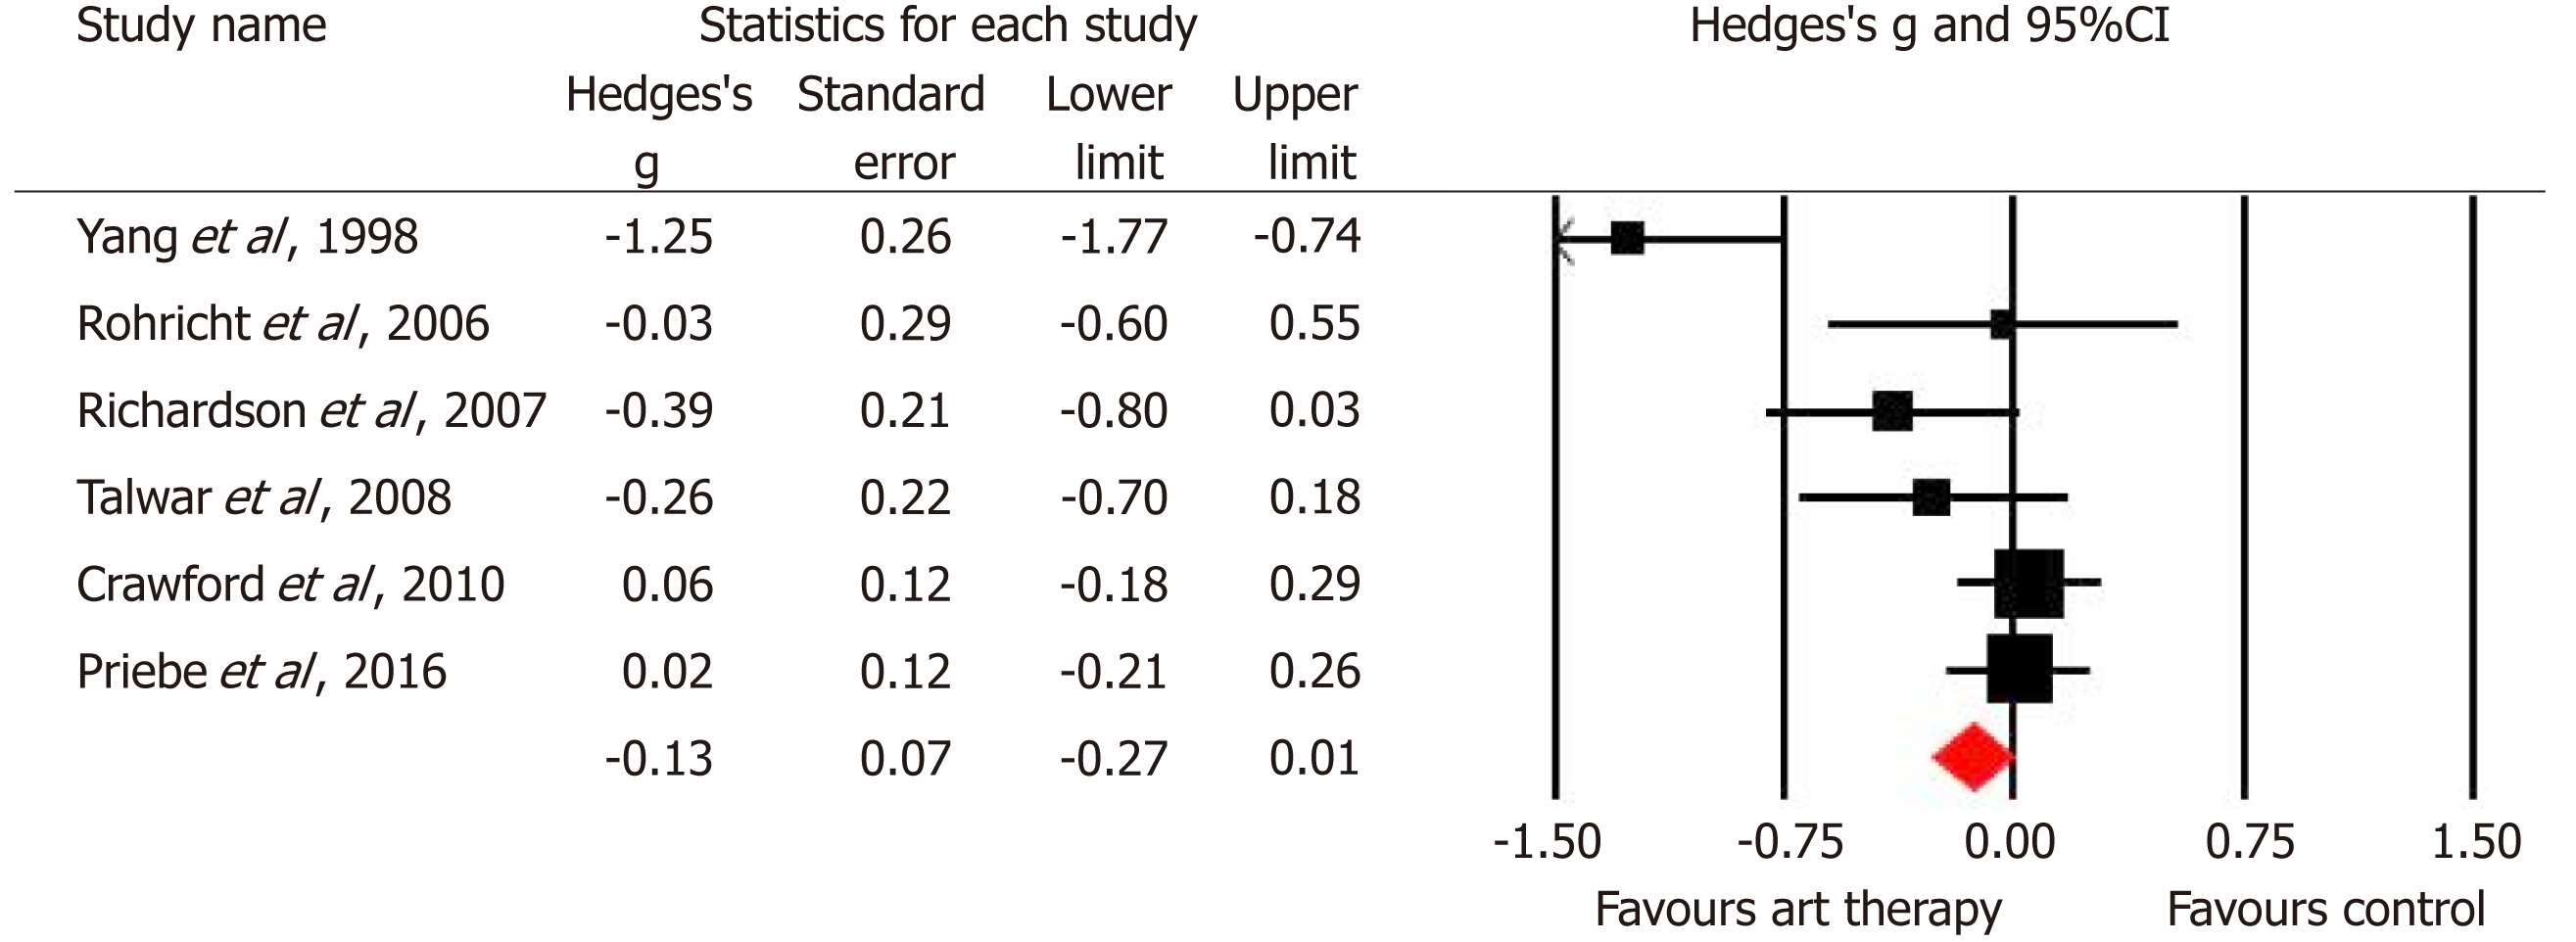
Figure 3 Forest plot of the studies in the meta-analysis for total symptoms.
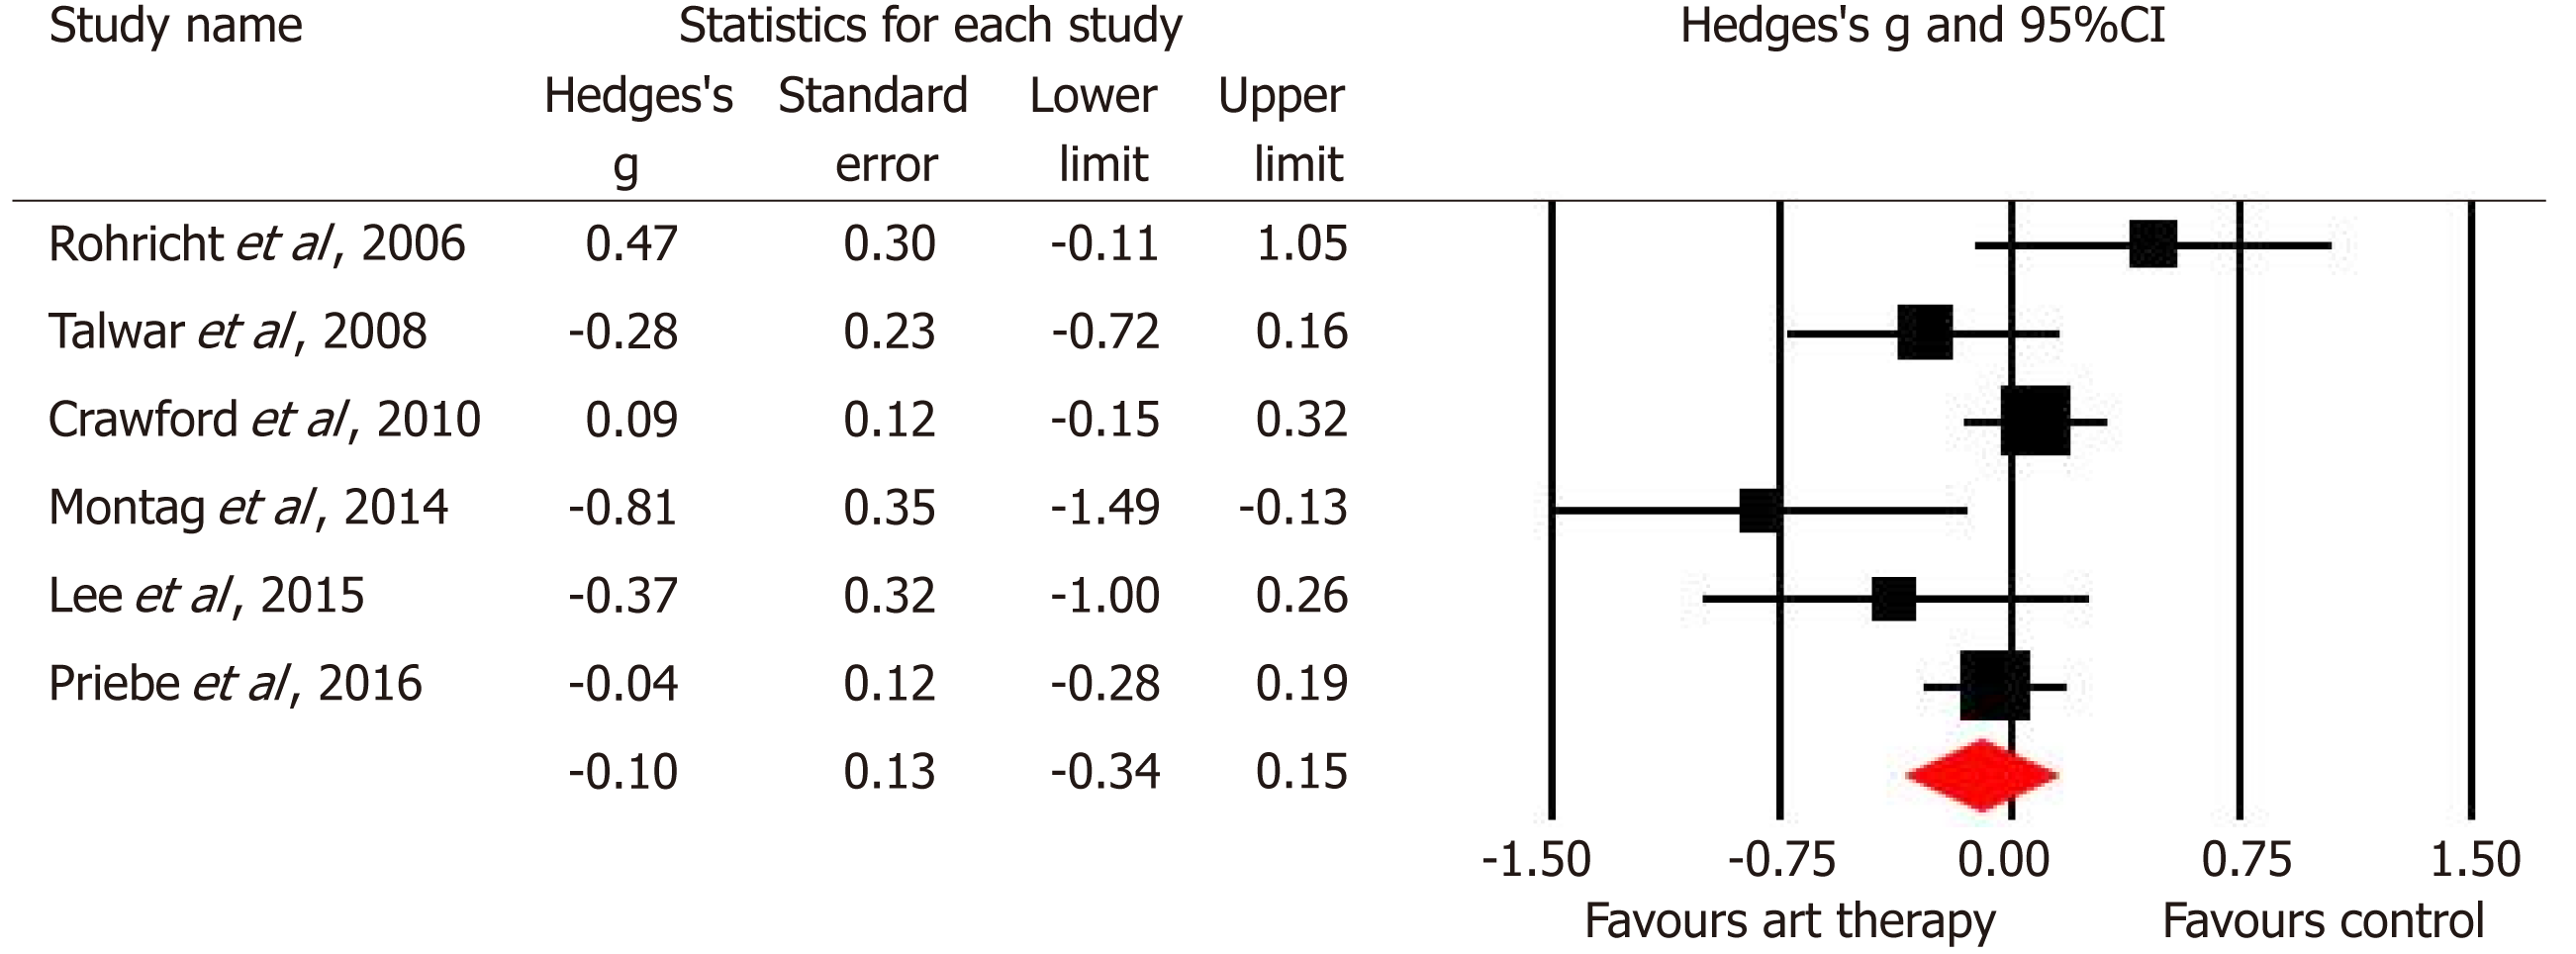
Figure 4 Forest plot of the studies in the meta-analysis for positive symptoms.
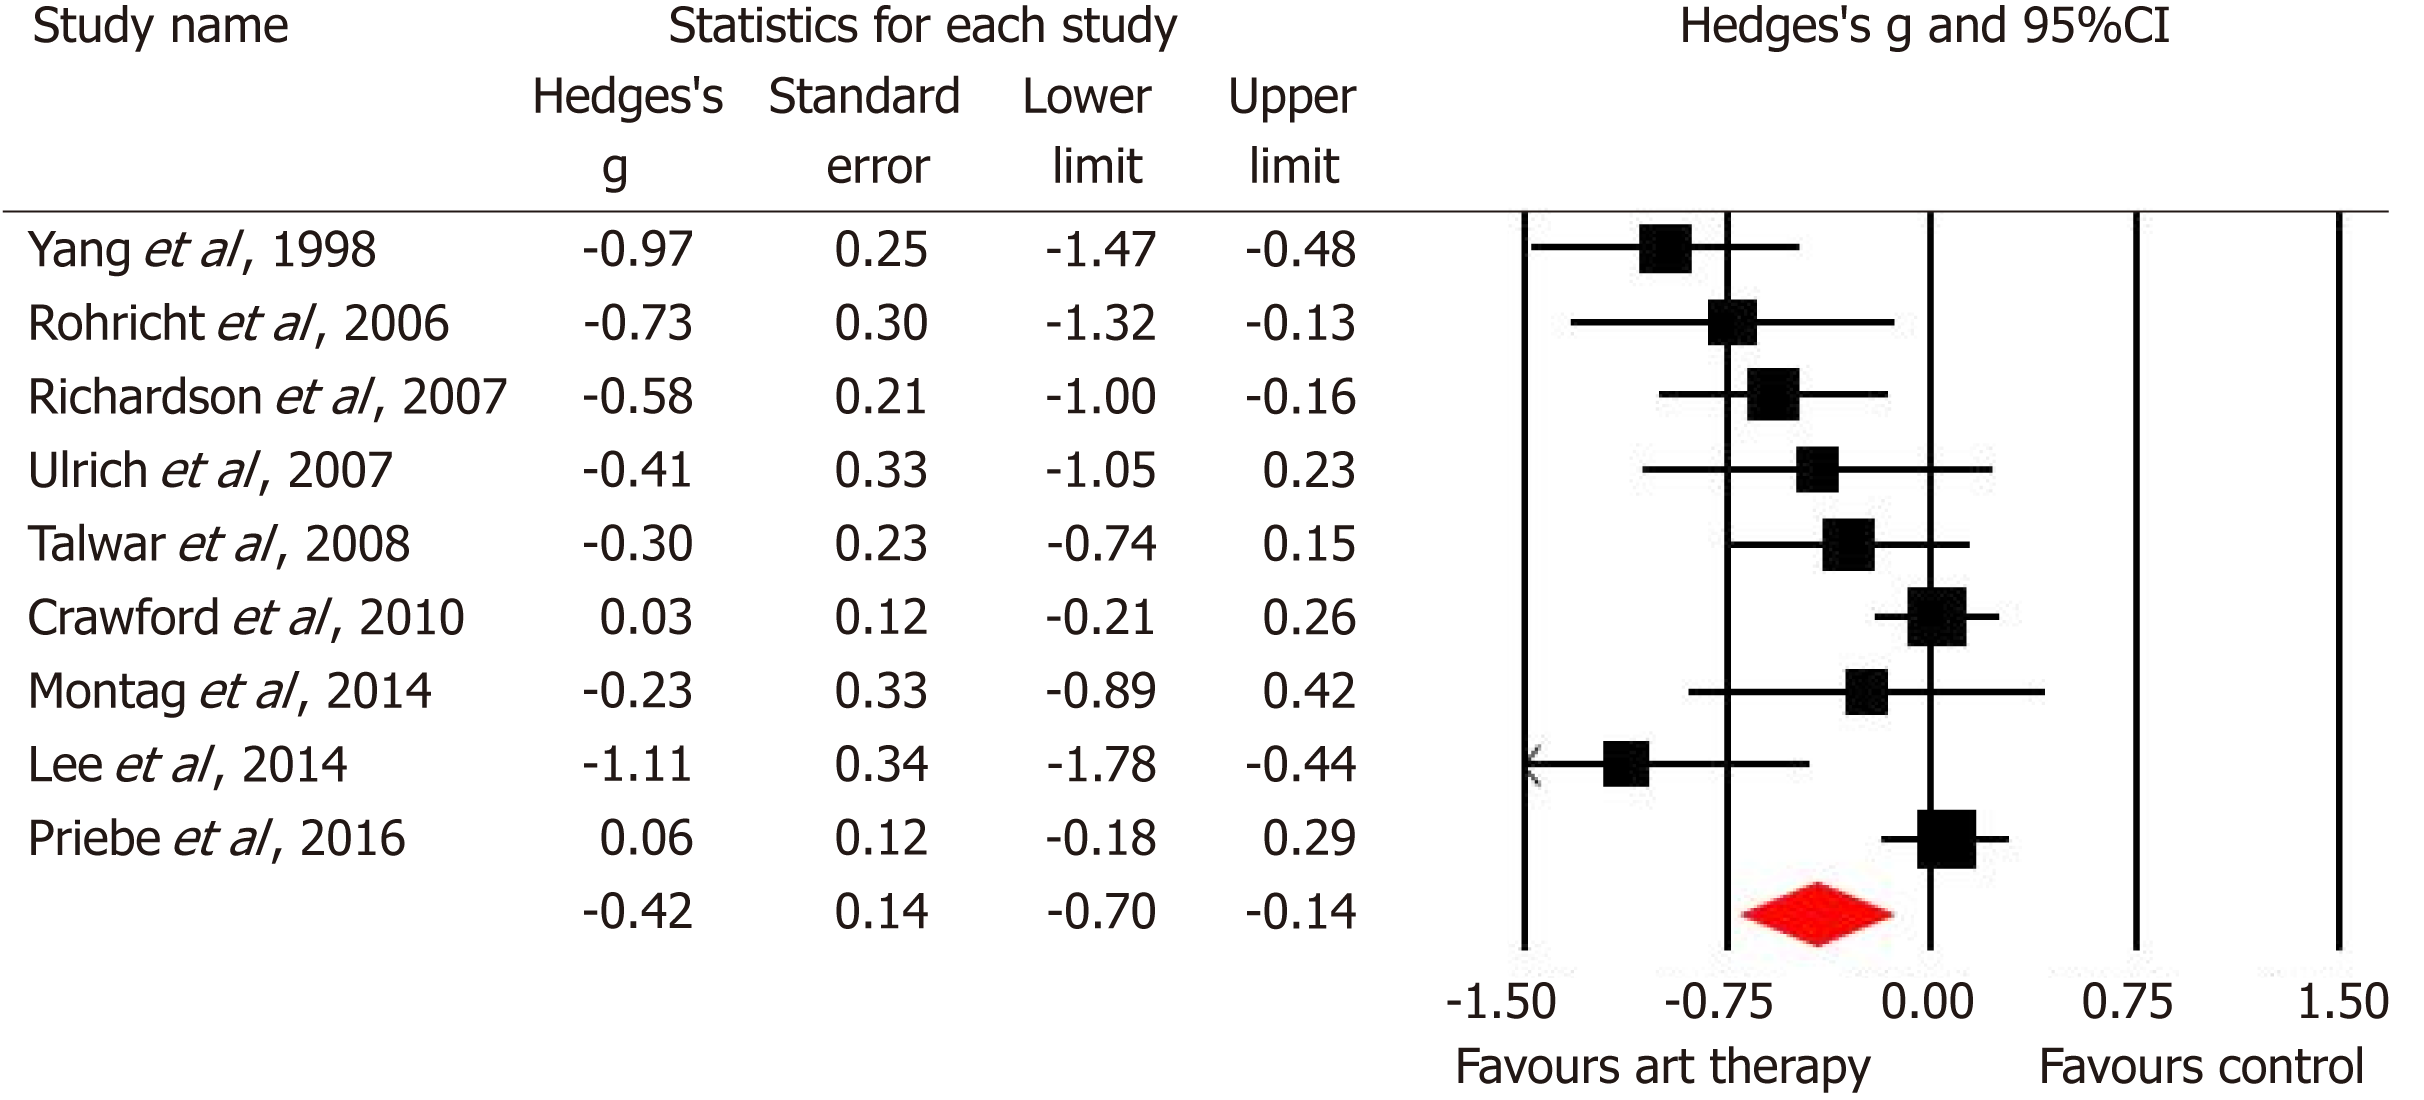
Figure 5 Forest plot of the studies in the meta-analysis for negative symptoms.
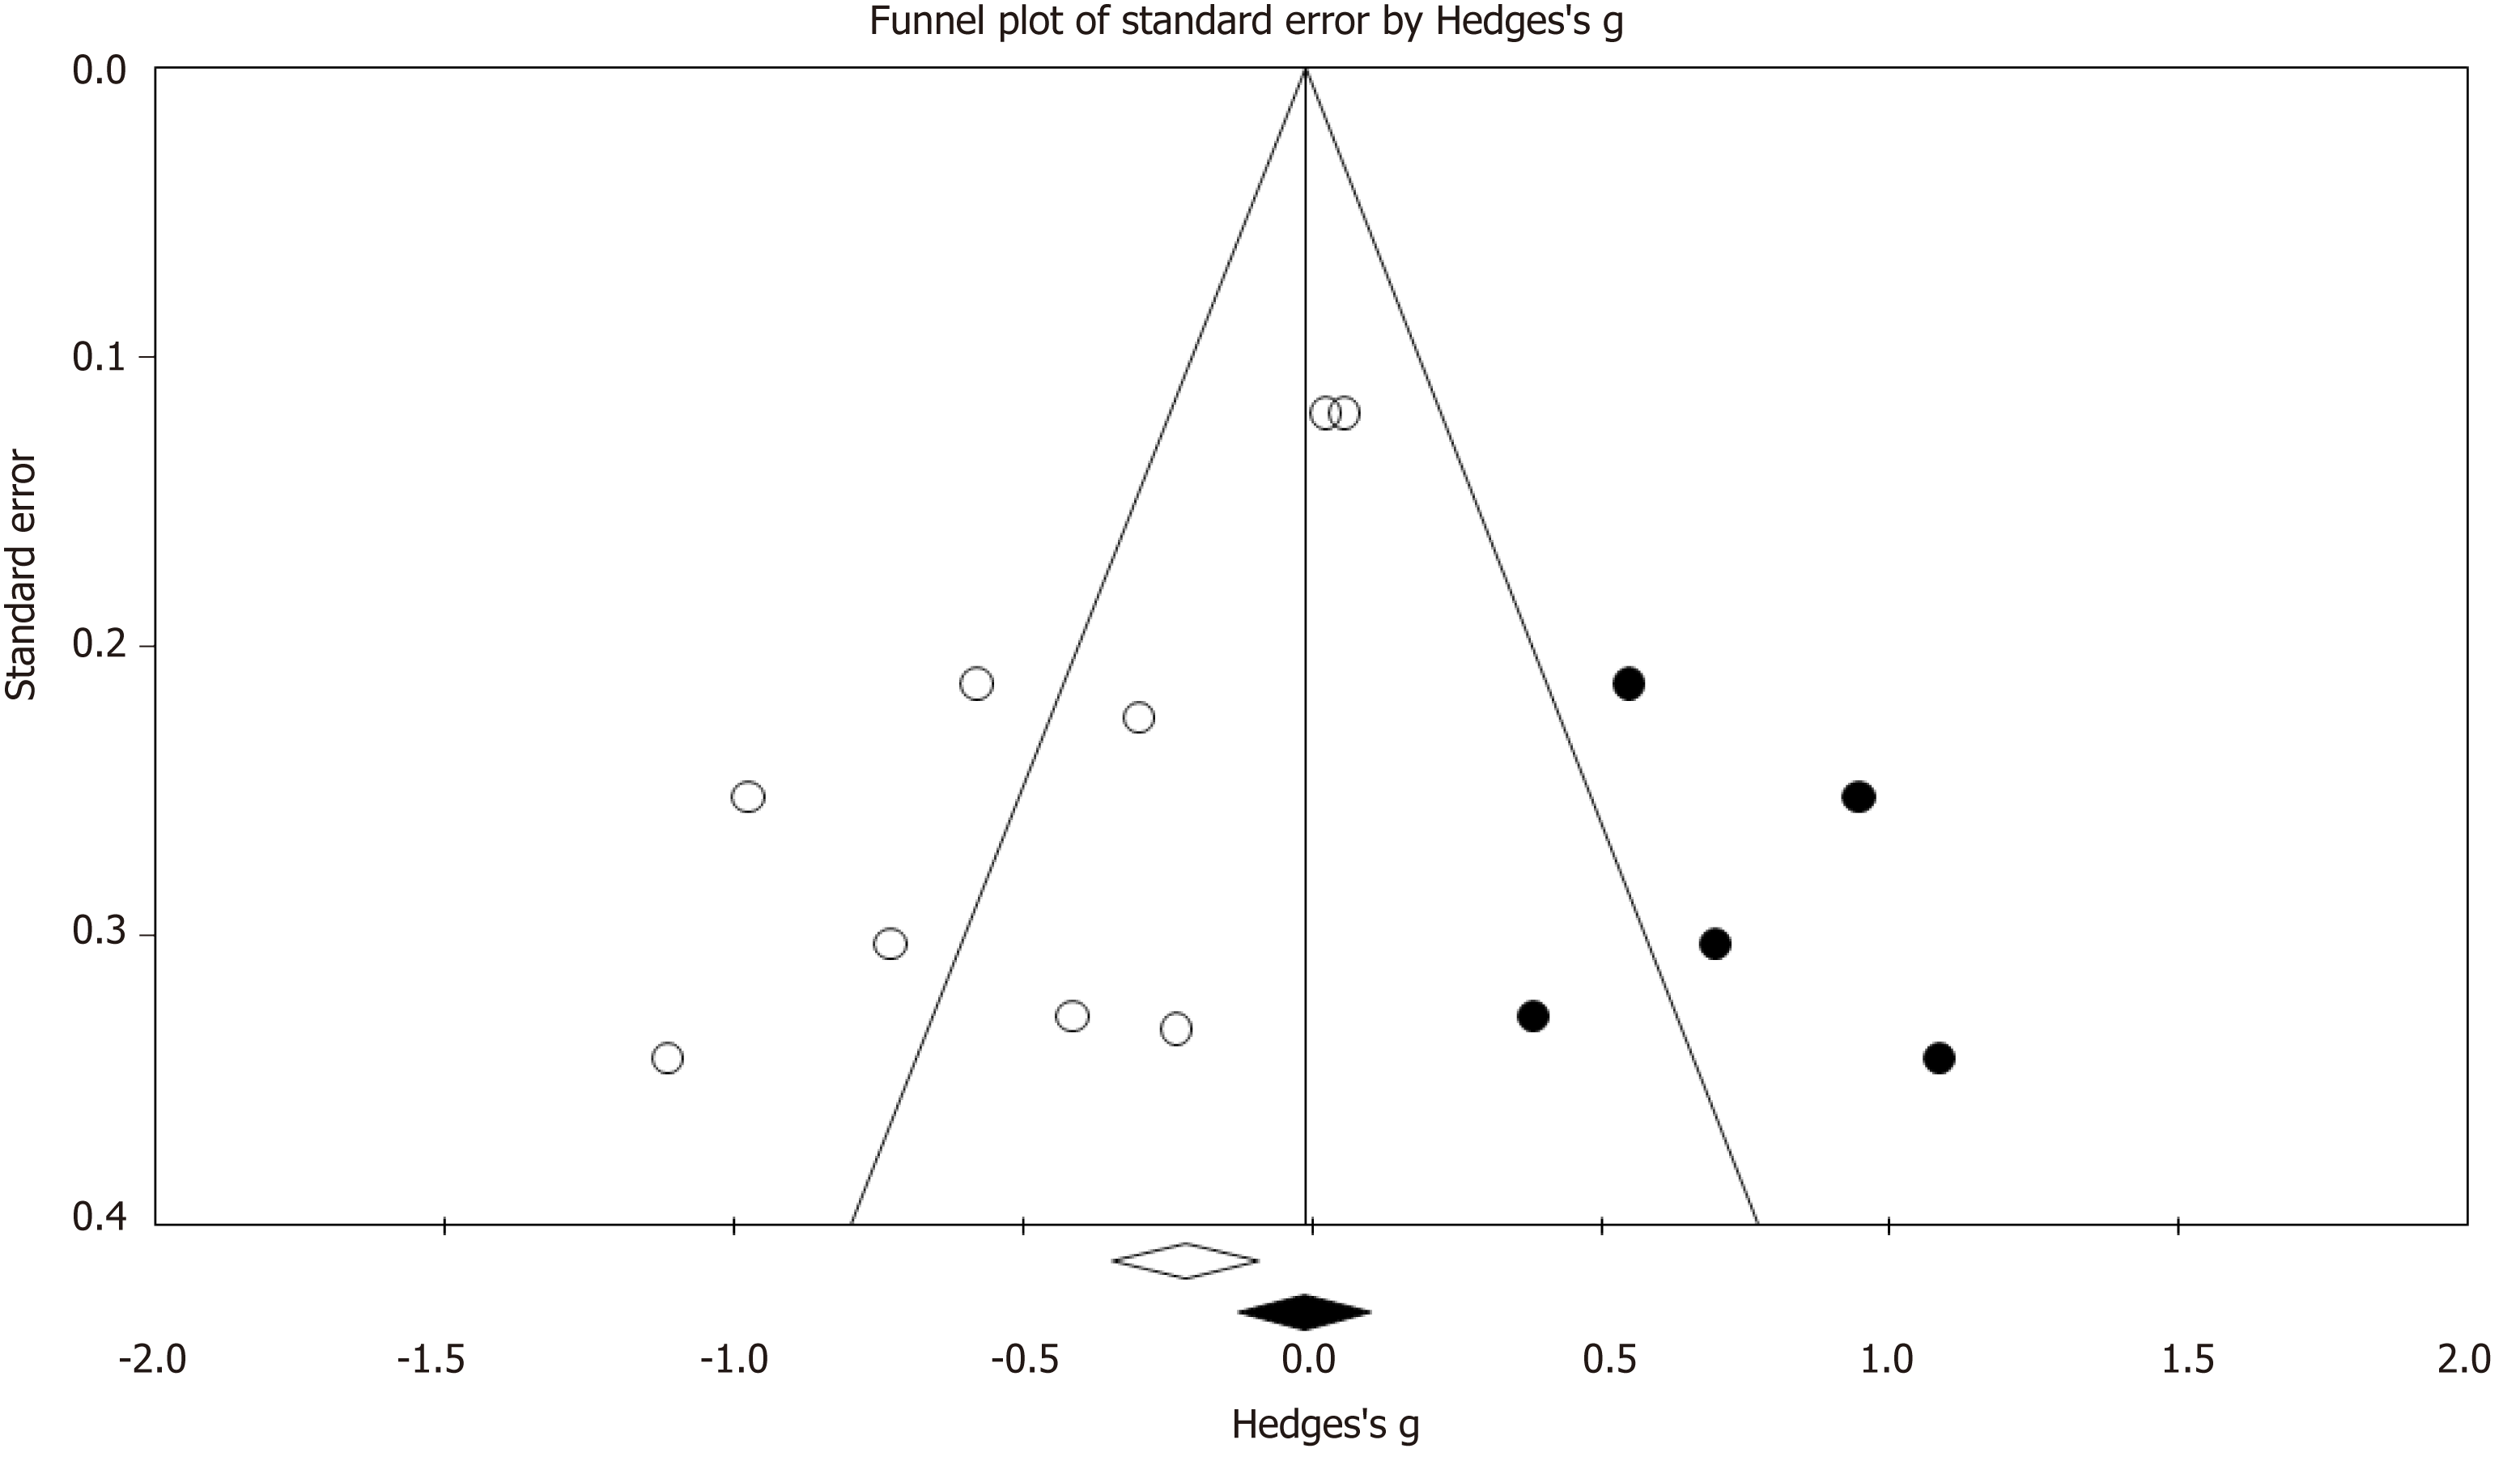
Figure 6 Funnell plot outlining trim and fill estimates for imputed missing trials (dark circles) for negative symptoms.
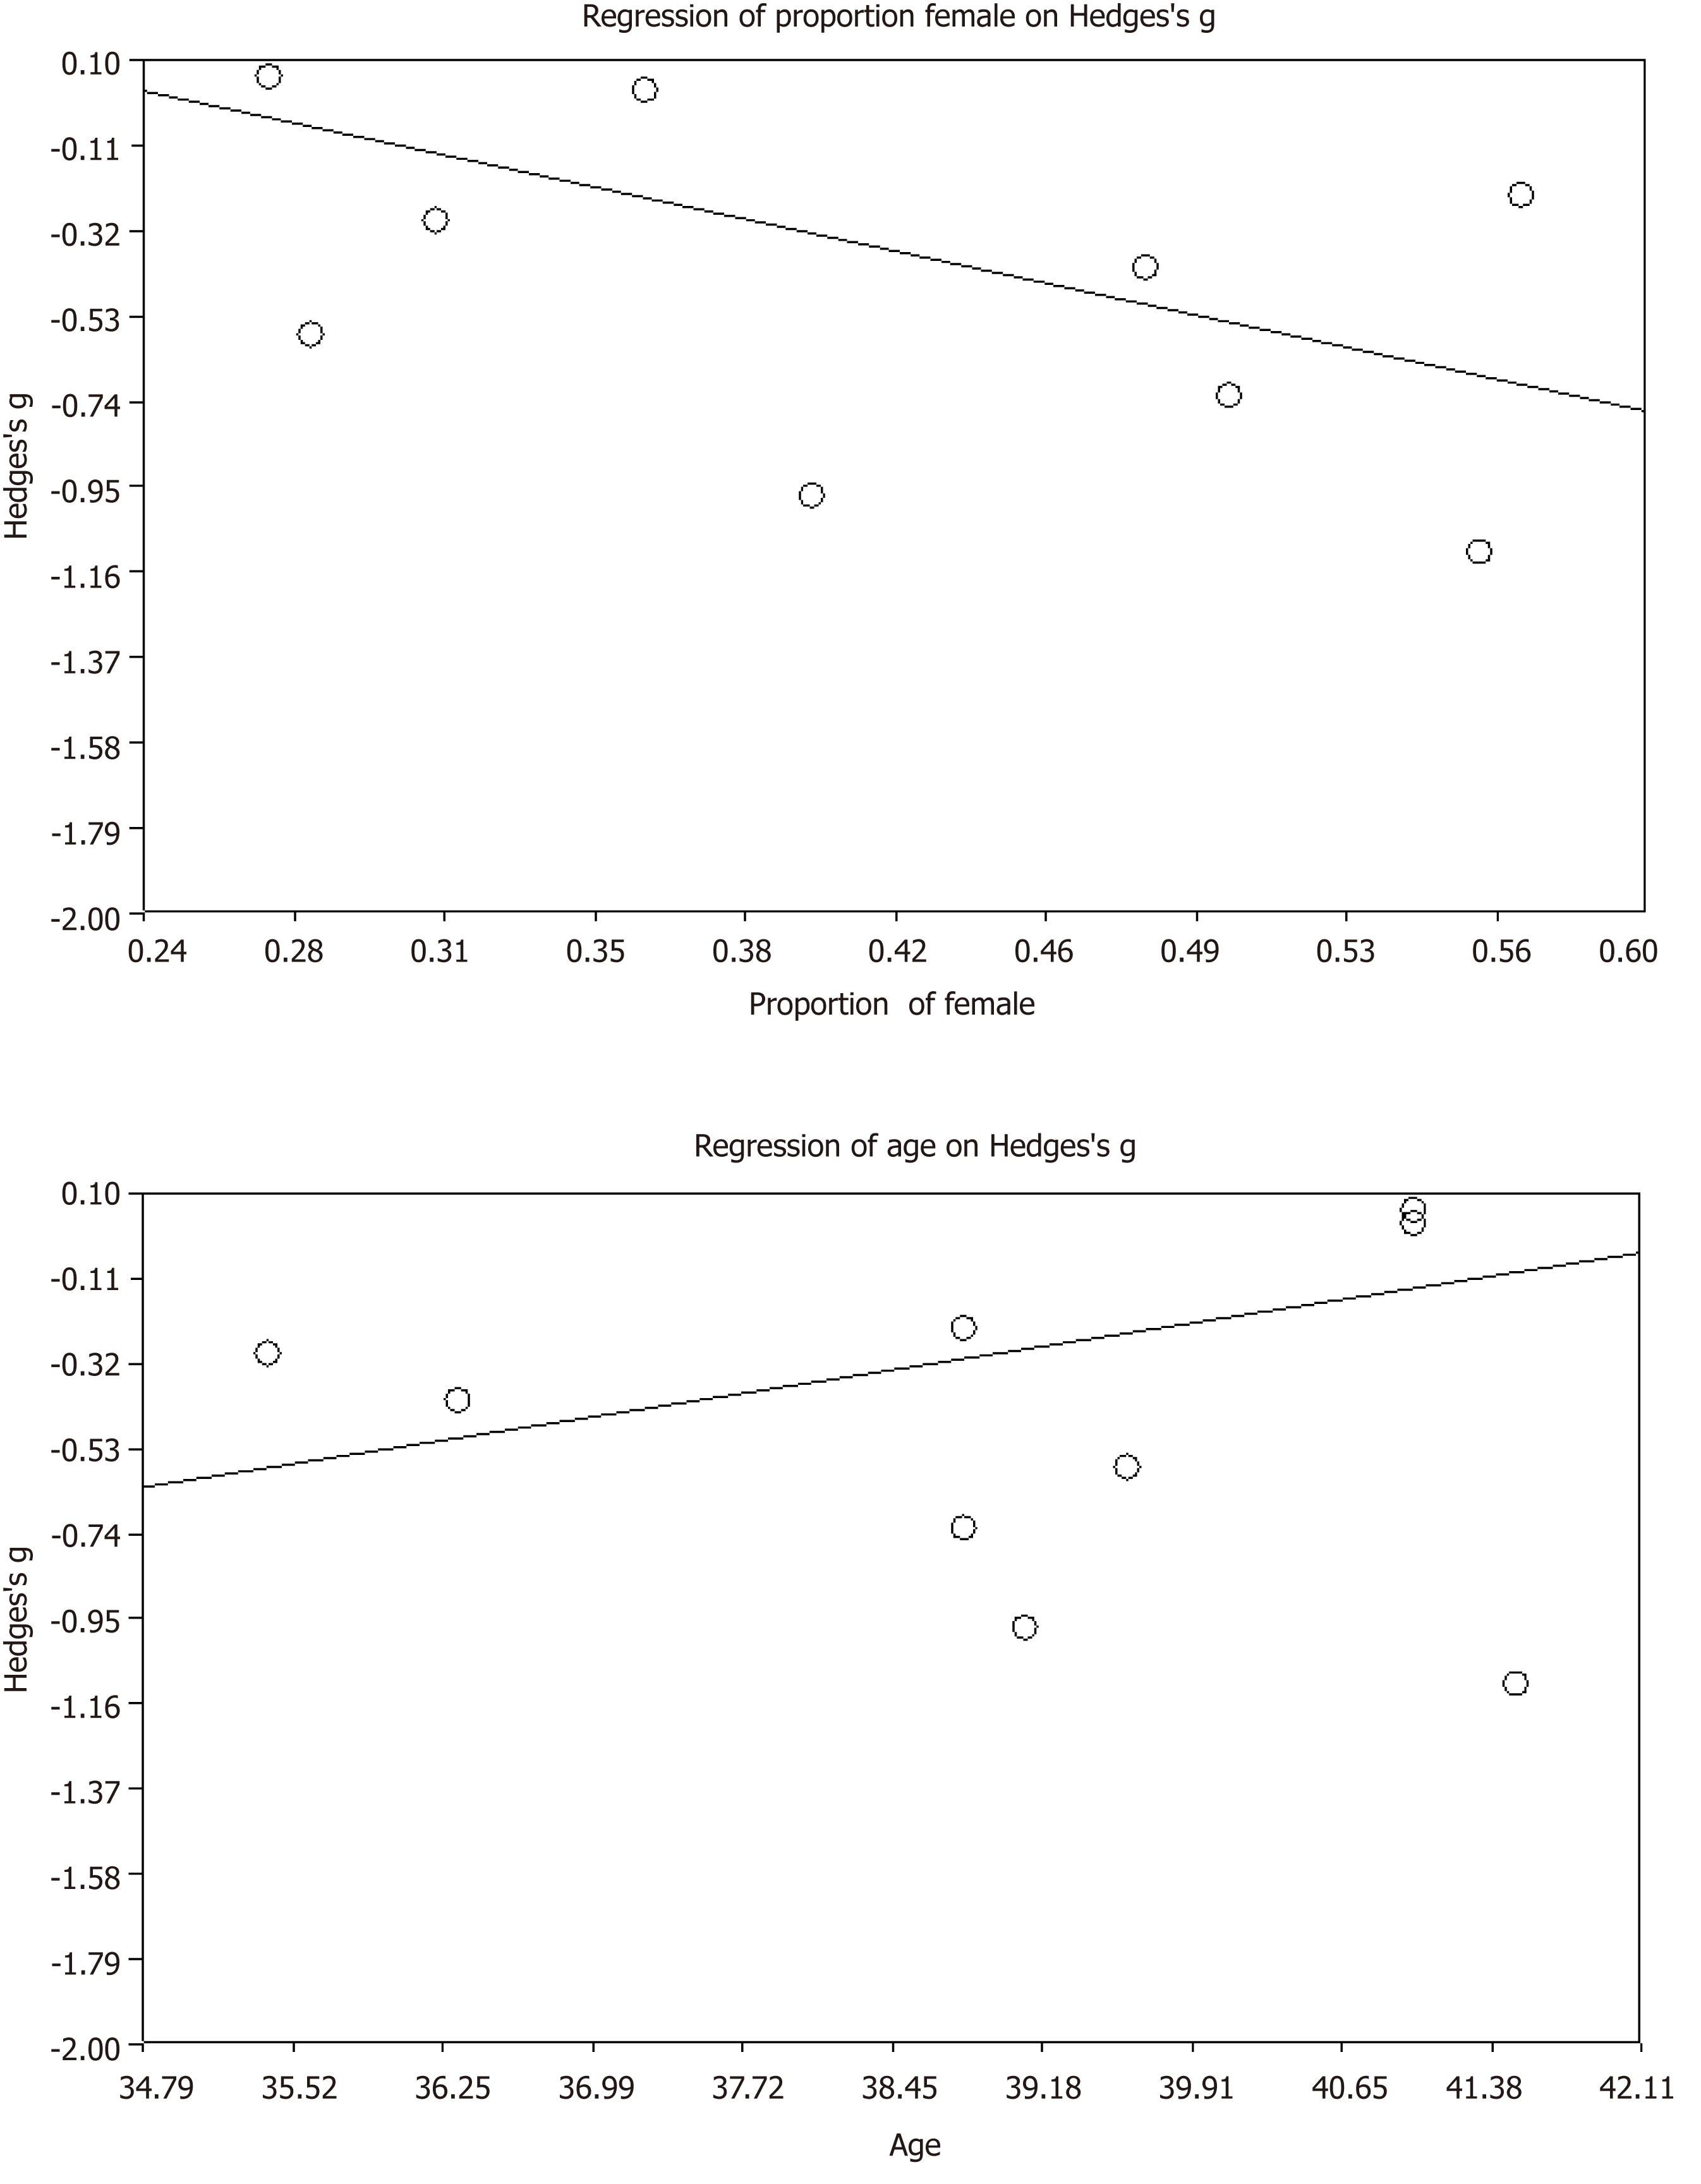
Figure 7 Regression plots showing effect size for negative symptoms against proportion of female patients per trial (top) and mean age (bottom).
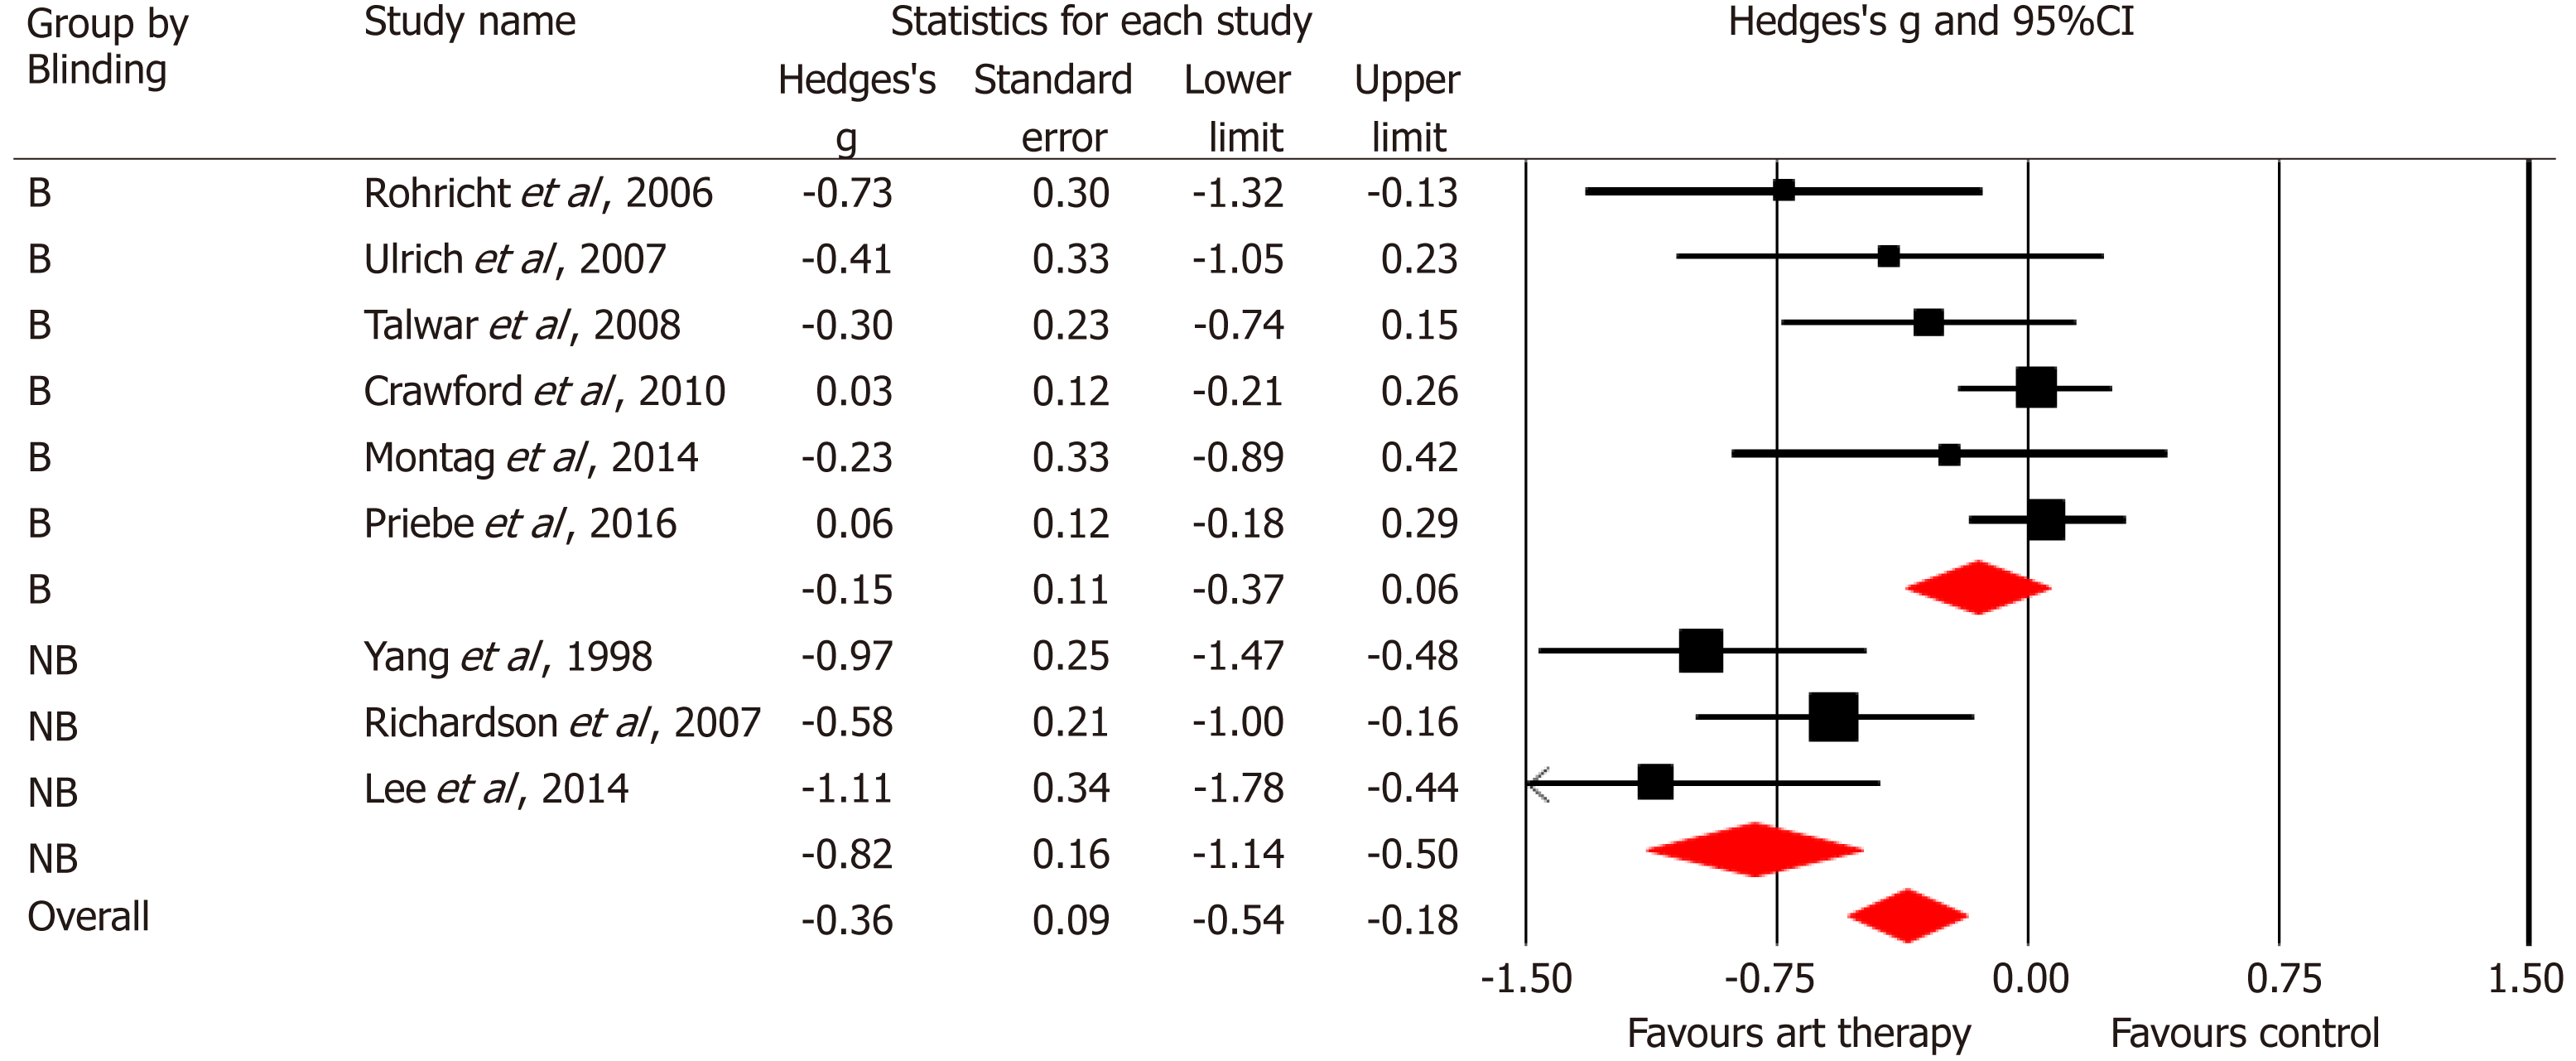
Figure 8 Forest plot comparing blind vs non-blinded outcome assessment.
B: Blind; NB: Non-blinded.
- Citation: Laws KR, Conway W. Do adjunctive art therapies reduce symptomatology in schizophrenia? A meta-analysis. World J Psychiatr 2019; 9(8): 107-120
- URL: https://www.wjgnet.com/2220-3206/full/v9/i8/107.htm
- DOI: https://dx.doi.org/10.5498/wjp.v9.i8.107


