Copyright
©The Author(s) 2015.
World J Psychiatr. Jun 22, 2015; 5(2): 193-209
Published online Jun 22, 2015. doi: 10.5498/wjp.v5.i2.193
Published online Jun 22, 2015. doi: 10.5498/wjp.v5.i2.193
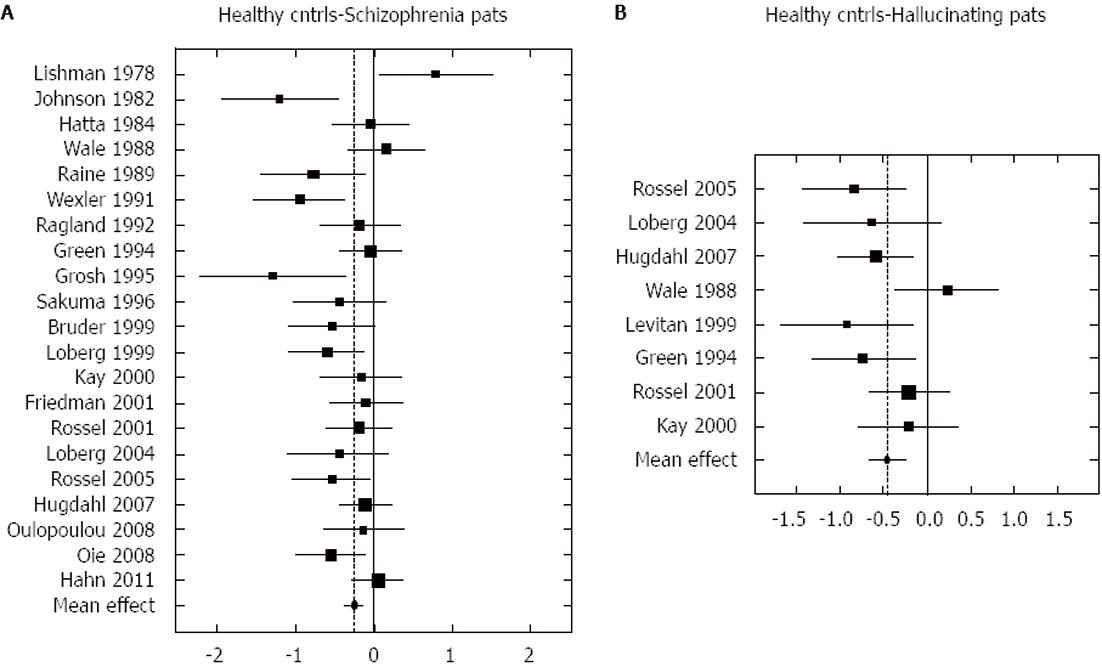
Figure 1 Graphic illustration of the meta-analysis done by Ocklenburg et al[55] on the relationship between the right-ear advantage in dichotic listening and schizophrenia (A), and between right-ear advantage and hallucinations (B).
Reprinted with permission from the authors and the publisher.
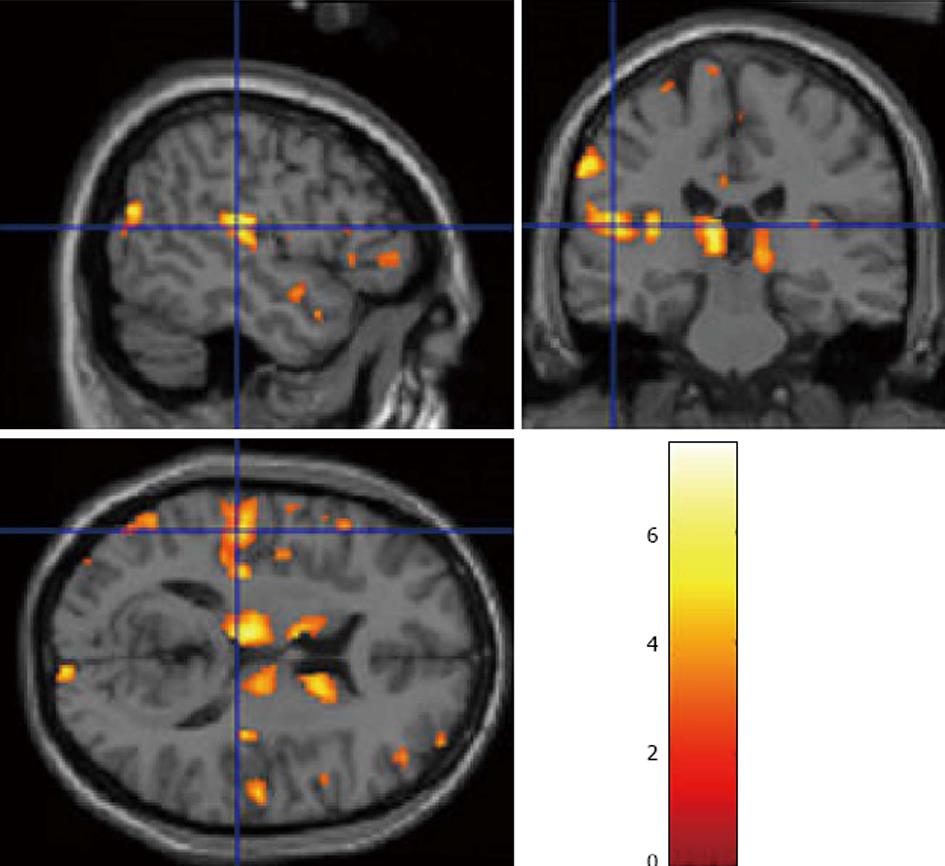
Figure 2 Structural magnetic resonance imaging, using Voxel-Based-Morphometry analysis of grey matter density in the brains of patients with frequent (PANSS P3 > 3), and infrequent (PANSS P3 < 4) hallucinations, shown in sagittal, coronal and axial slices.
Data from Neckelmann et al[59] redrawn with permission of the authors and the publisher.
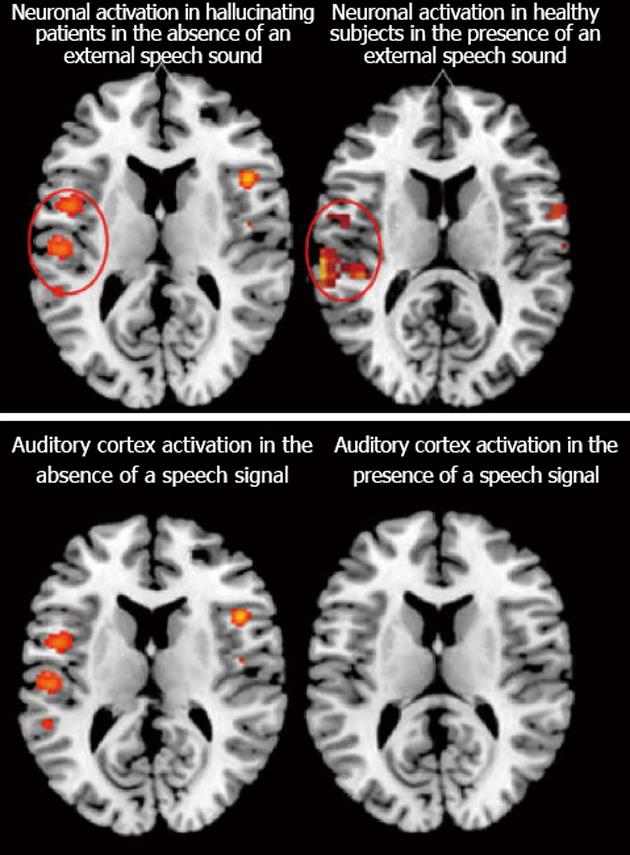
Figure 3 Functional imaging results for hallucinating patients based on the meta-analysis done by Kompus et al[24] which show activation in the absence of an external auditory stimulus (upper left panel) compared with healthy controls in the presence of an external auditory stimulus (upper right panel, data from van den Noort et al[117]).
The lower left panel shows the same activation as in the upper left panel, spontaneous activation in hallucinating patients in the absence of an external auditory stimulus, but now compared with absence of activation in hallucinating patients in the presence of an auditory stimulus. Color-coded areas indicate significantly activated brain regions during active hallucinations and task-processing. Reprinted and redrawn with permission from the authors and the publishers.
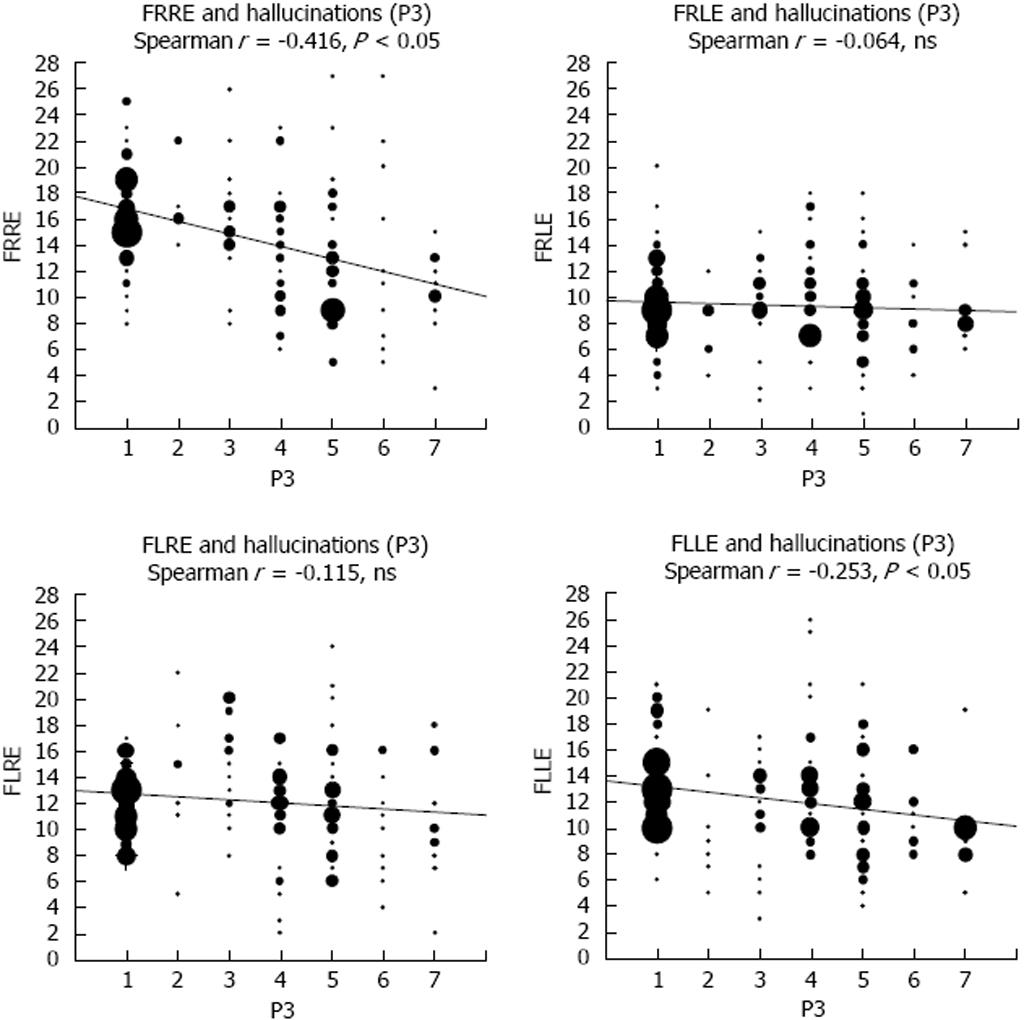
Figure 4 Correlations between the right and left ear scores on the forced-attention dichotic listening task and scores on the the PANSS P3 Hallucination item.
Note the negative correlations for the FR and FL instruction conditions (upper left and lower right), respectively. See text for further explanations. From Hugdahl et al[23], reprinted with permission from the authors and the publisher. ns: Not significant.
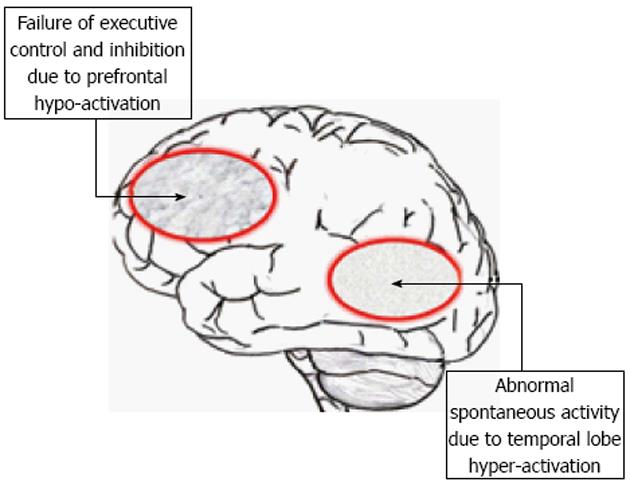
Figure 5 The ERC “VOICE” model showing impaired processing in a suggested pre-frontal and temporal lobe neuronal network, due to hyper-activation of temporal lobe regions, including the auditory cortex, which is not inhibited due to impairment of pre-frontal executive inhibitory functions.
See text for further explanations. Redrawn from Hugdahl et al[7], with permission from the authors and the Publisher.
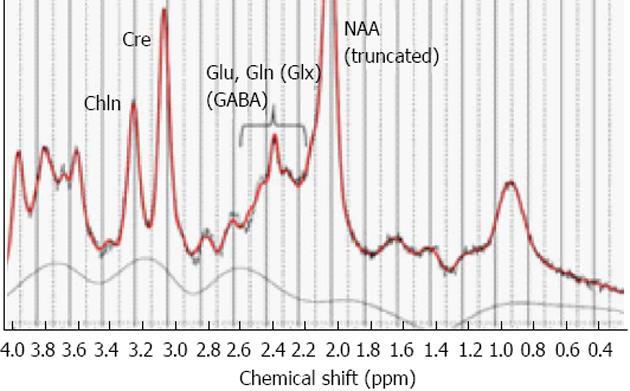
Figure 6 Example of a printout of the typical peak spectra from an MR spectroscopy sequence applied to a single voxel.
Selected metabolites are indicated with respective acronym. Glu: Glutamate; Gln: Glutamine; Glx: Glutamate + Glutamine; GABA: Gamma-amino-butyric-acid; Cre: Creatine; Chln: Choline; NAA: N-acetyl-aspartate. From Hugdahl et al[111], reprinted with permission from the authors and the publisher.
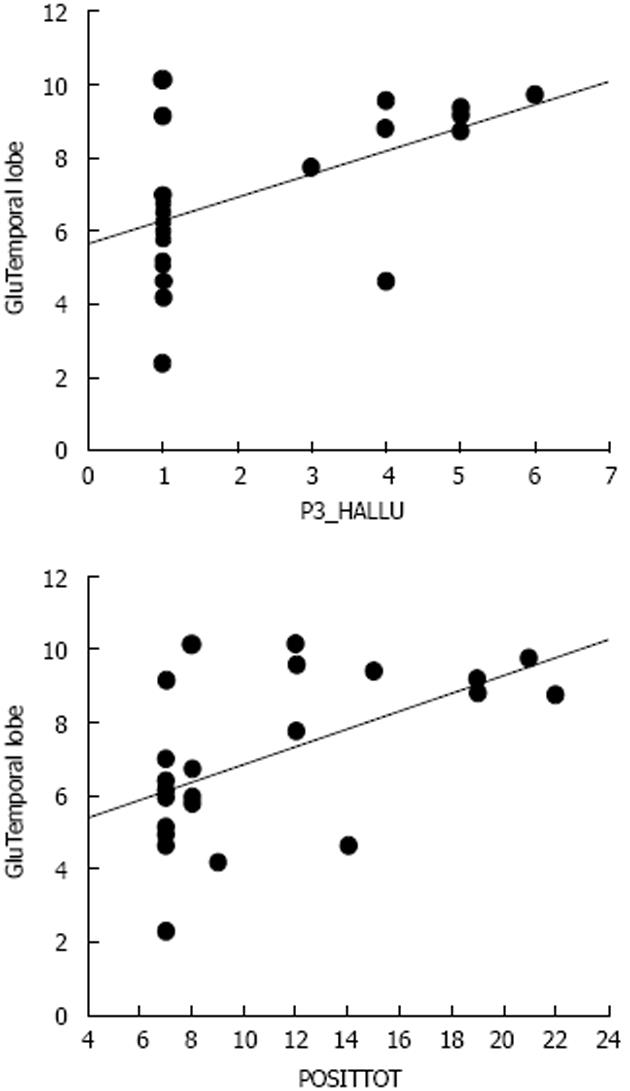
Figure 7 Scatter-plots of the correlations between scores on the PANSS P3 Hallucination item and Glutamate levels from a temporal lobe voxel, and between the sum total of positive symptoms and Glutamate levels from the same voxel.
P3_Hallu: Score for the PANSS hallucination item; POSITTOT: Sum total of positive symptoms; Glu: Glutamate.
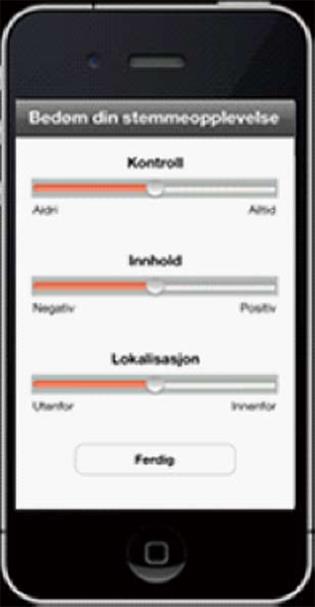
Figure 8 iPhone app for the sampling of real-time data on the three dimensions of auditory verbal hallucinations, cognitive control (upper slider), emotional content (middle slider), and perceptual locus (lower slider), developed by the ERC “VOICE” Group at the University of Bergen, Norway.
See text for further explanations.
- Citation: Hugdahl K. Auditory hallucinations: A review of the ERC “VOICE” project. World J Psychiatr 2015; 5(2): 193-209
- URL: https://www.wjgnet.com/2220-3206/full/v5/i2/193.htm
- DOI: https://dx.doi.org/10.5498/wjp.v5.i2.193


