Copyright
©The Author(s) 2025.
World J Psychiatry. Jun 19, 2025; 15(6): 104809
Published online Jun 19, 2025. doi: 10.5498/wjp.v15.i6.104809
Published online Jun 19, 2025. doi: 10.5498/wjp.v15.i6.104809
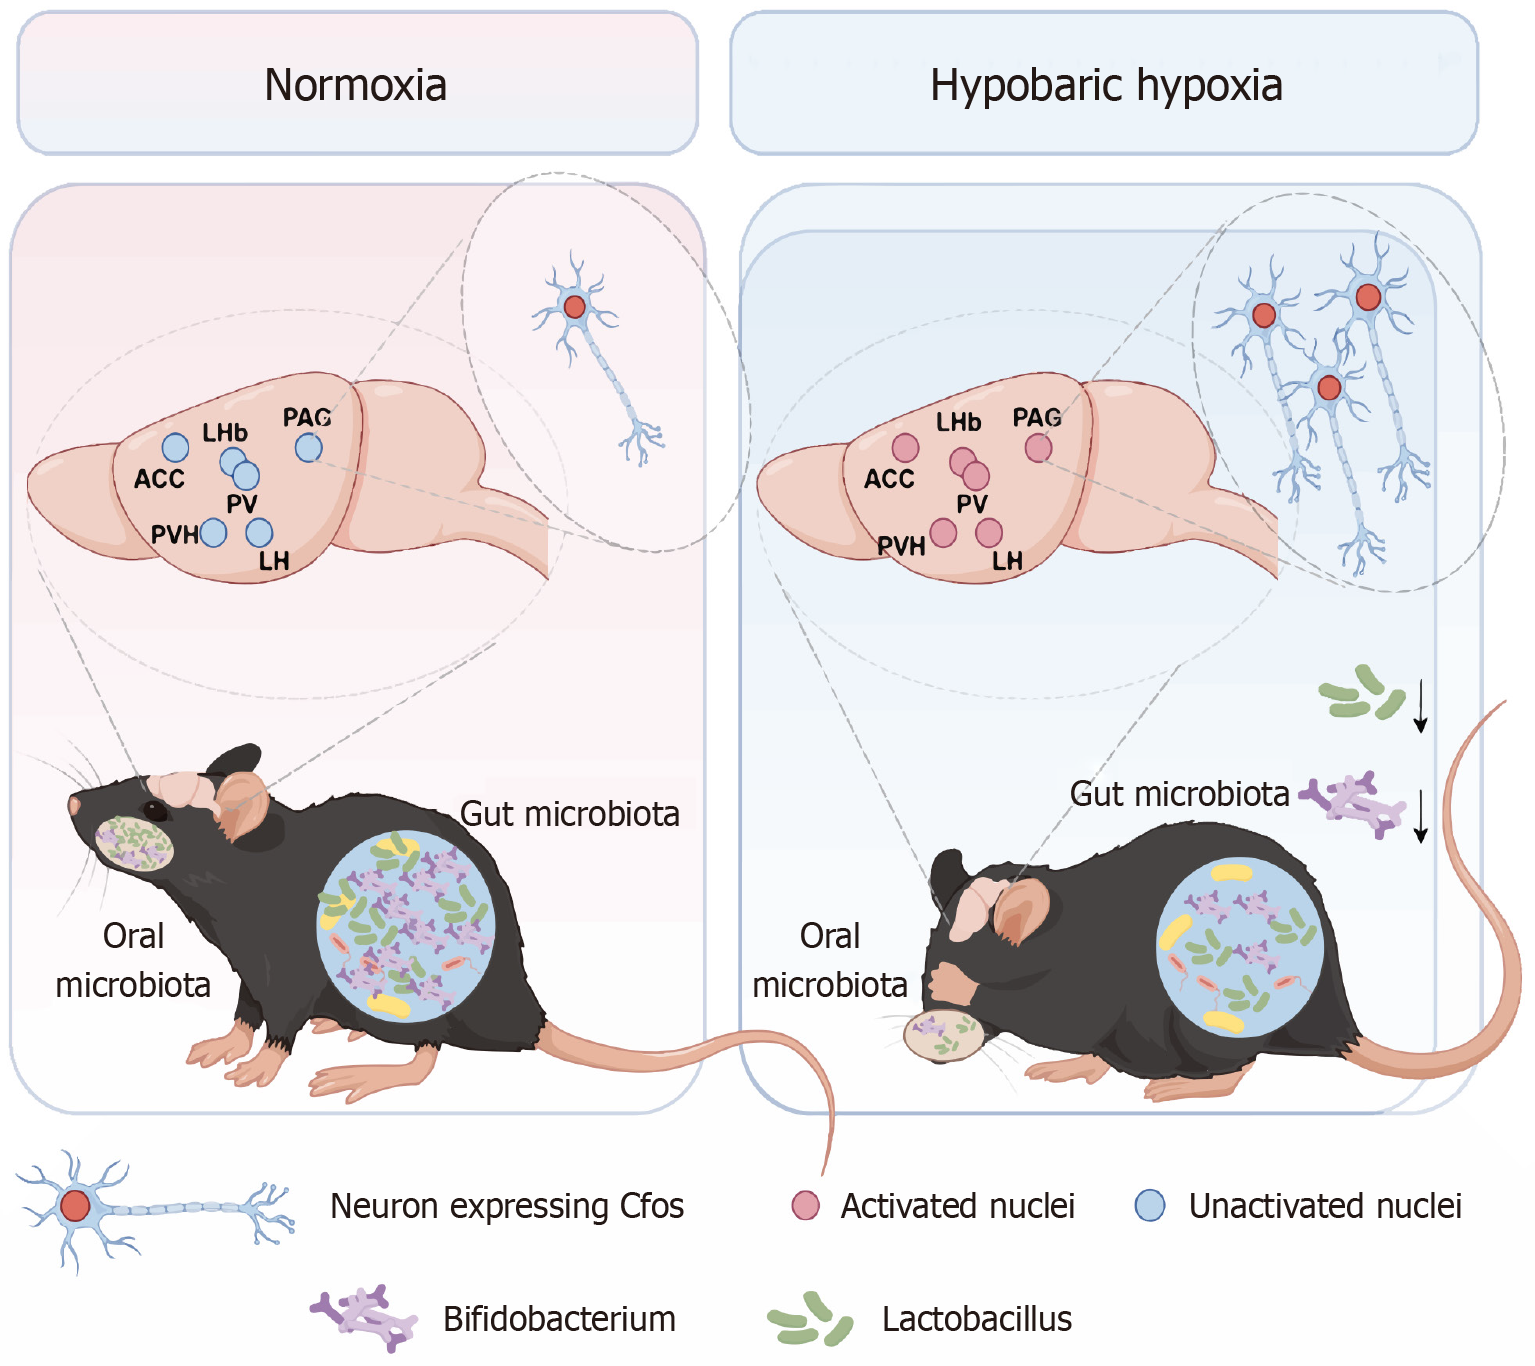
Figure 1 Schematic diagram of this study.
ACC: Anterior cingulate cortex; LHb: Lateral habenula nuclei; PAG: Periaqueductal gray; PV: Paraventricular nuclei of the thalamus; PVH: Paraventricular nuclei of the hypothalamus; LH: Lateral hypothalamus. Created by figdraw.com (Supplementary material).
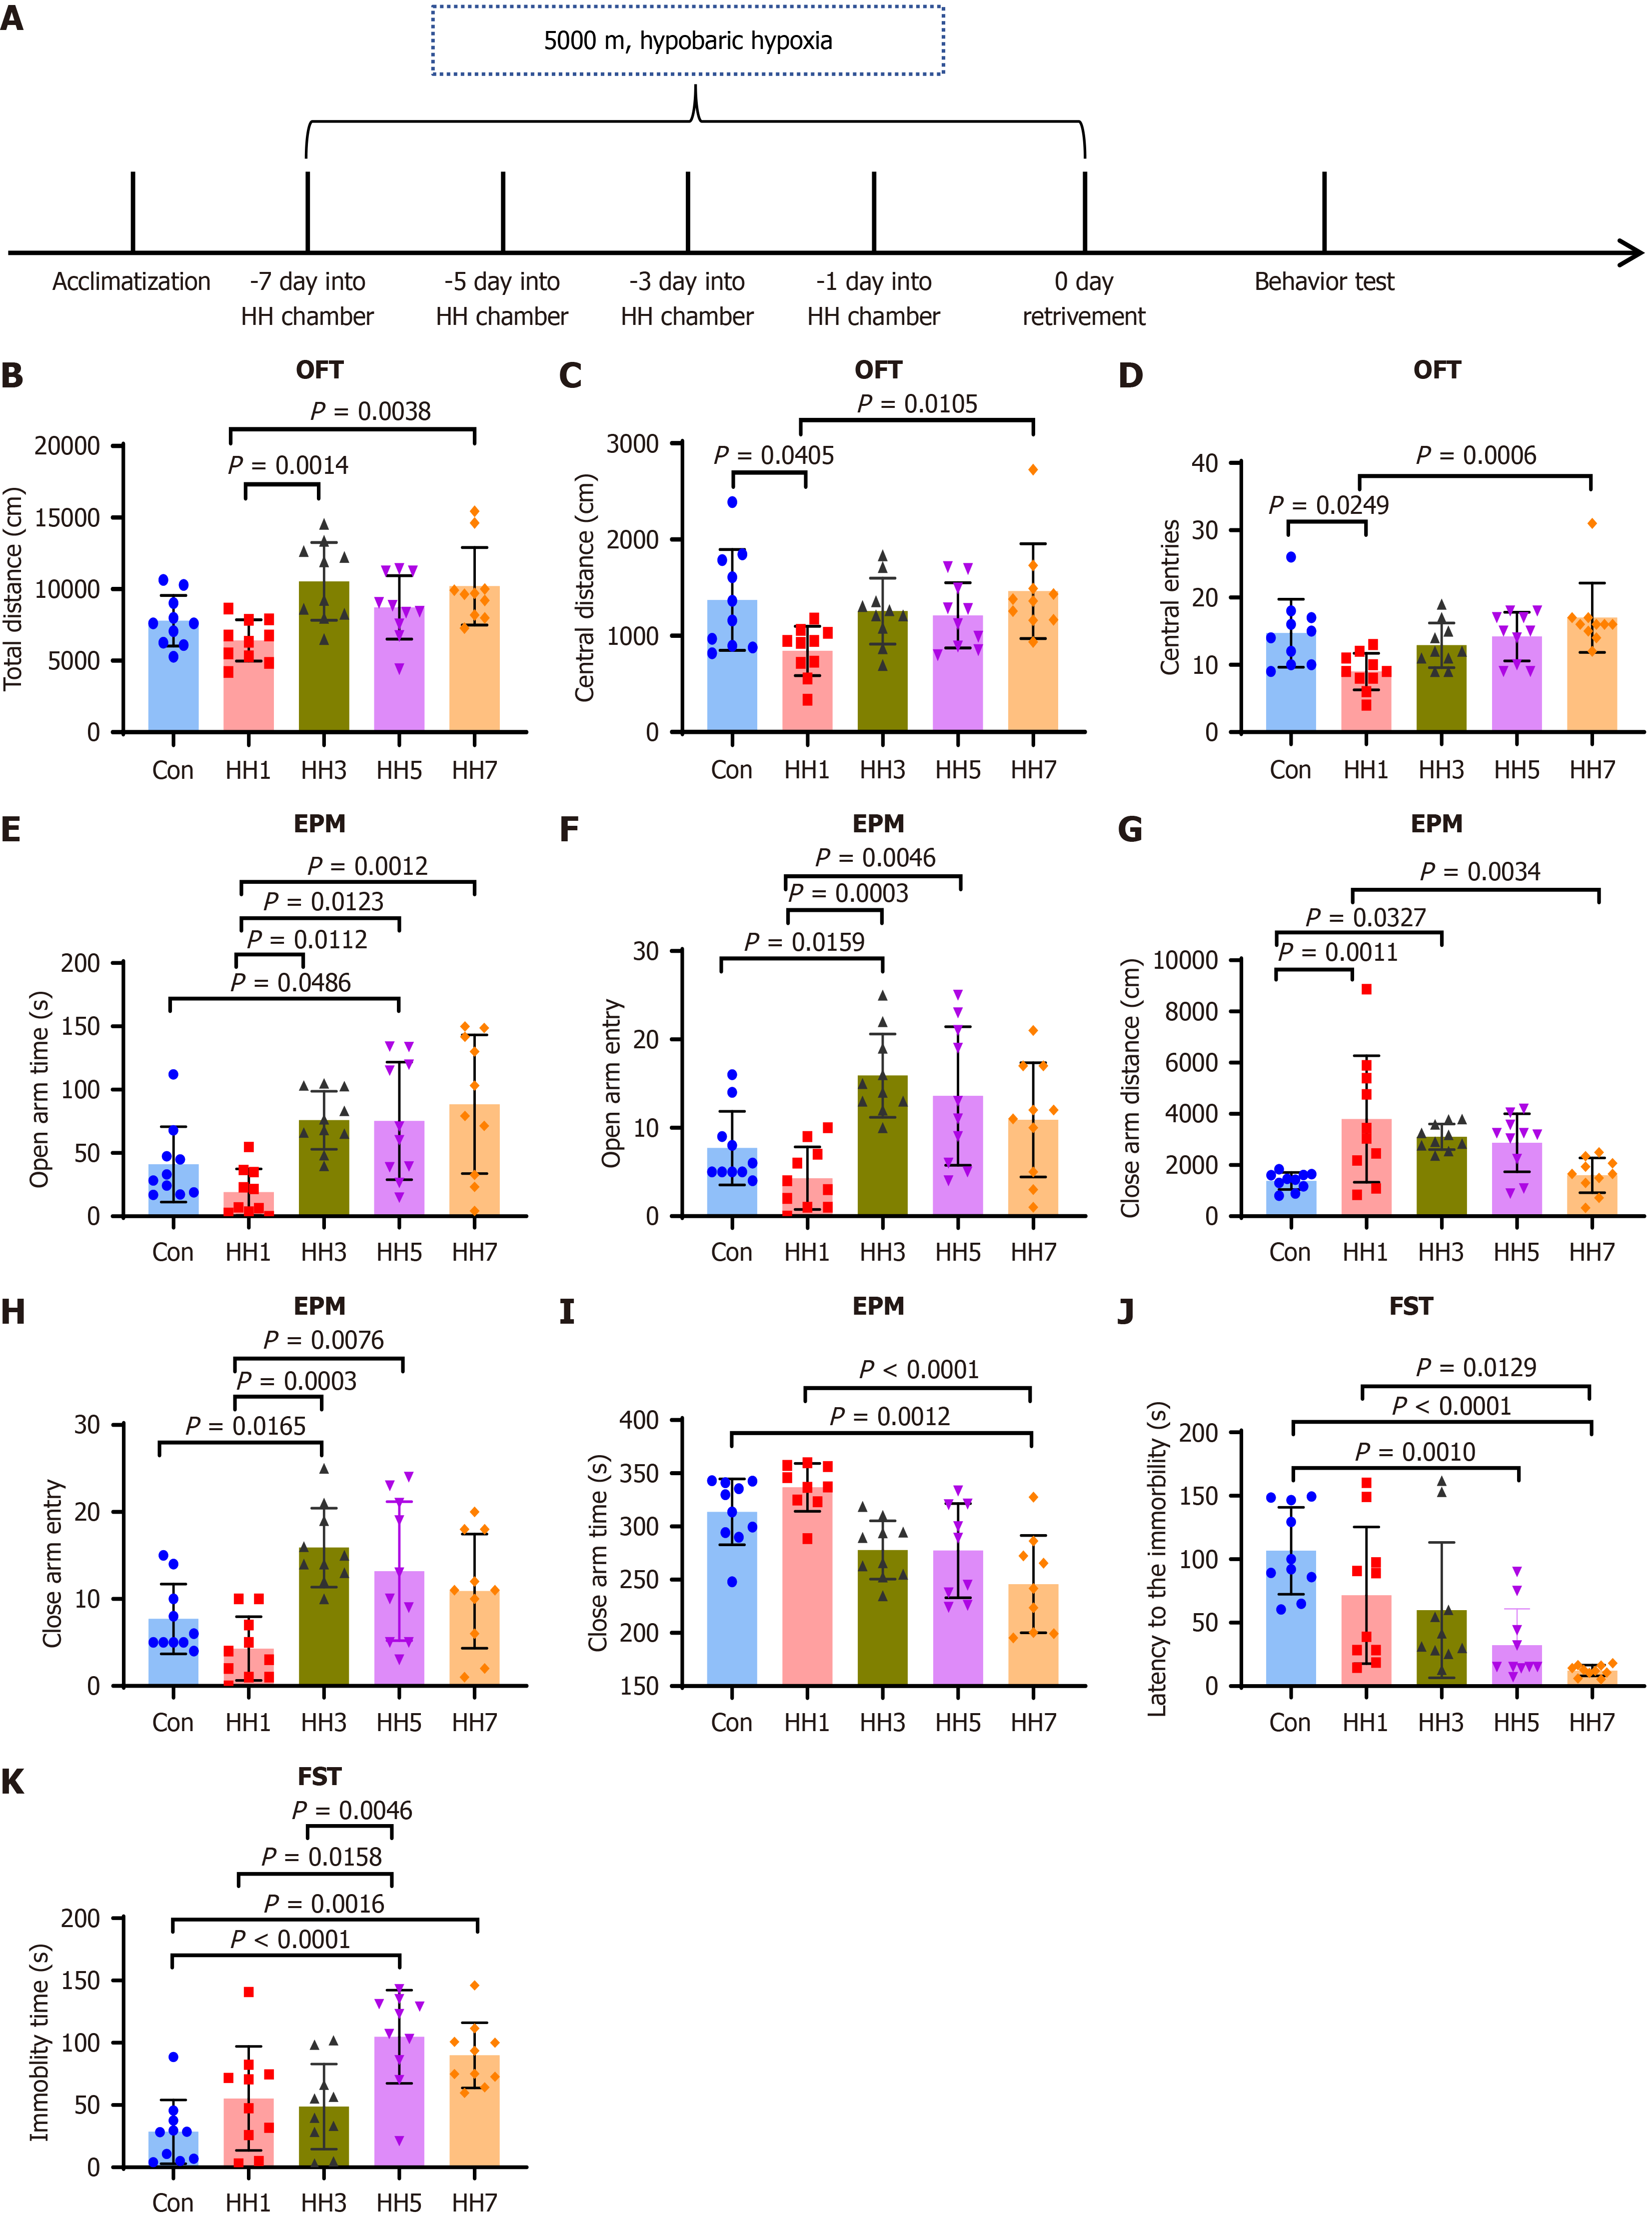
Figure 2 Effects of hypobaric hypoxia exposure on anxiety- and depression-like behaviors in mice.
A: Paradigm of hypobaric hypoxia exposure for 0, 1, 3, 5, and 7 days; B-D: Total distance, central distance, and number of entries into the central zone for each group in the open field test (n = 10); E-I: Time spent in the open arm, number of entries into the open arm, distance traveled in the close arm, number of entries into the close arm, and time spent in the close arm for each group in the elevated plus maze test (n = 10); J: Immobility latency for each group in the forced swim test (n = 10); K: Immobility time for each group in the forced swim test (n = 10). aP ≤ 0.05, bP ≤ 0.01, cP ≤ 0.001, dP ≤ 0.0001. HH: Hypobaric hypoxia; OFT: Open field test; EPM: Elevated plus maze; FST: Forced swim test; Con: Control group; HH1: One day of hypobaric hypoxia exposure; HH3: Three days of hypobaric hypoxia exposure; HH5: Five days of hypobaric hypoxia exposure; HH7: Seven days of hypobaric hypoxia exposure.
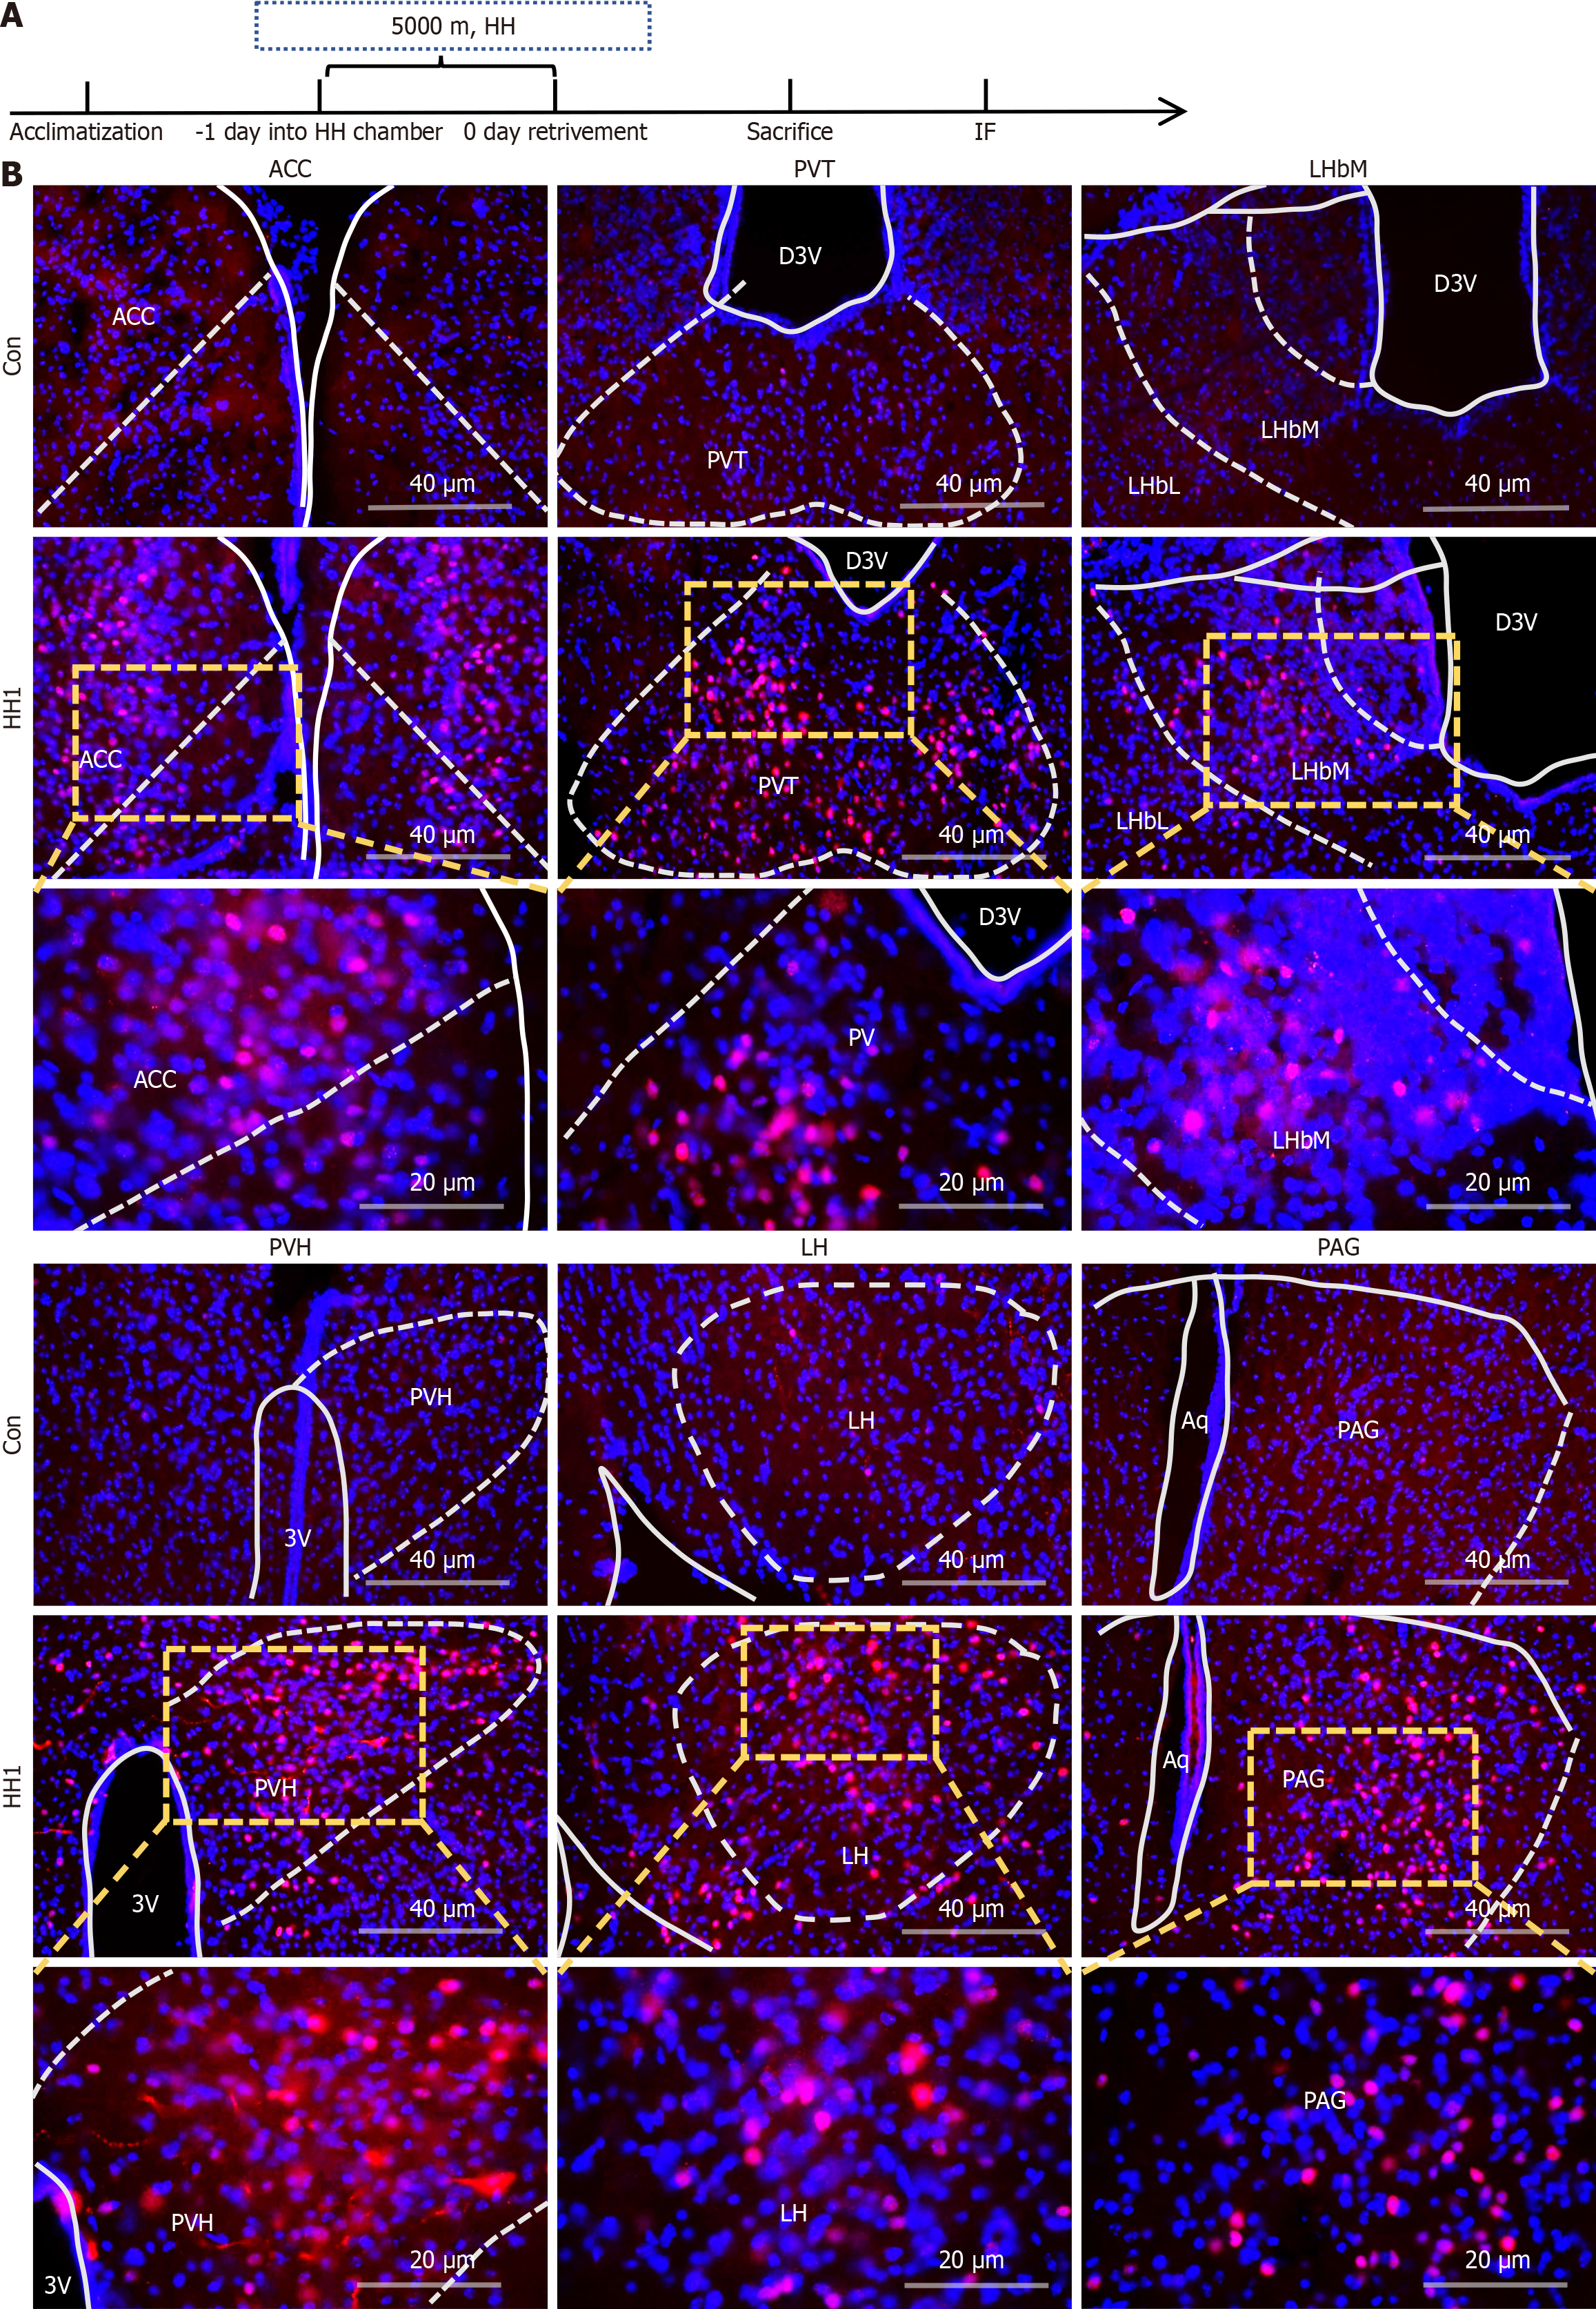
Figure 3 c-Fos expression in nuclei, indicating activation in certain brain regions after 1-day hypobaric hypoxia exposure.
A: One day of hypobaric hypoxia exposure paradigm; B: Expression of c-Fos in the anterior cingulate cortex, paraventricular thalamic nucleus, lateral habenula nucleus, paraventricular nuclei of the hypothalamus, lateral hypothalamus, and anterior periaqueductal gray. Con: Control group; HH1: One day of hypobaric hypoxia exposure; HH: Hypobaric hypoxia; IF: Immunofluorescence staining; ACC: Anterior cingulate cortex; PVT: Paraventricular thalamic nucleus; LHbM: Lateral habenular nucleus, medial part; LHbI: Lateral habenular nucleus, lateral part; D3V: Dorsal part of the third ventricle; PVH: Paraventricular nuclei of the hypothalamus; 3V: Third ventricle; LH: Lateral hypothalamus; PAG: Periaqueductal gray; Aq: Aqueduct of Sylvius.
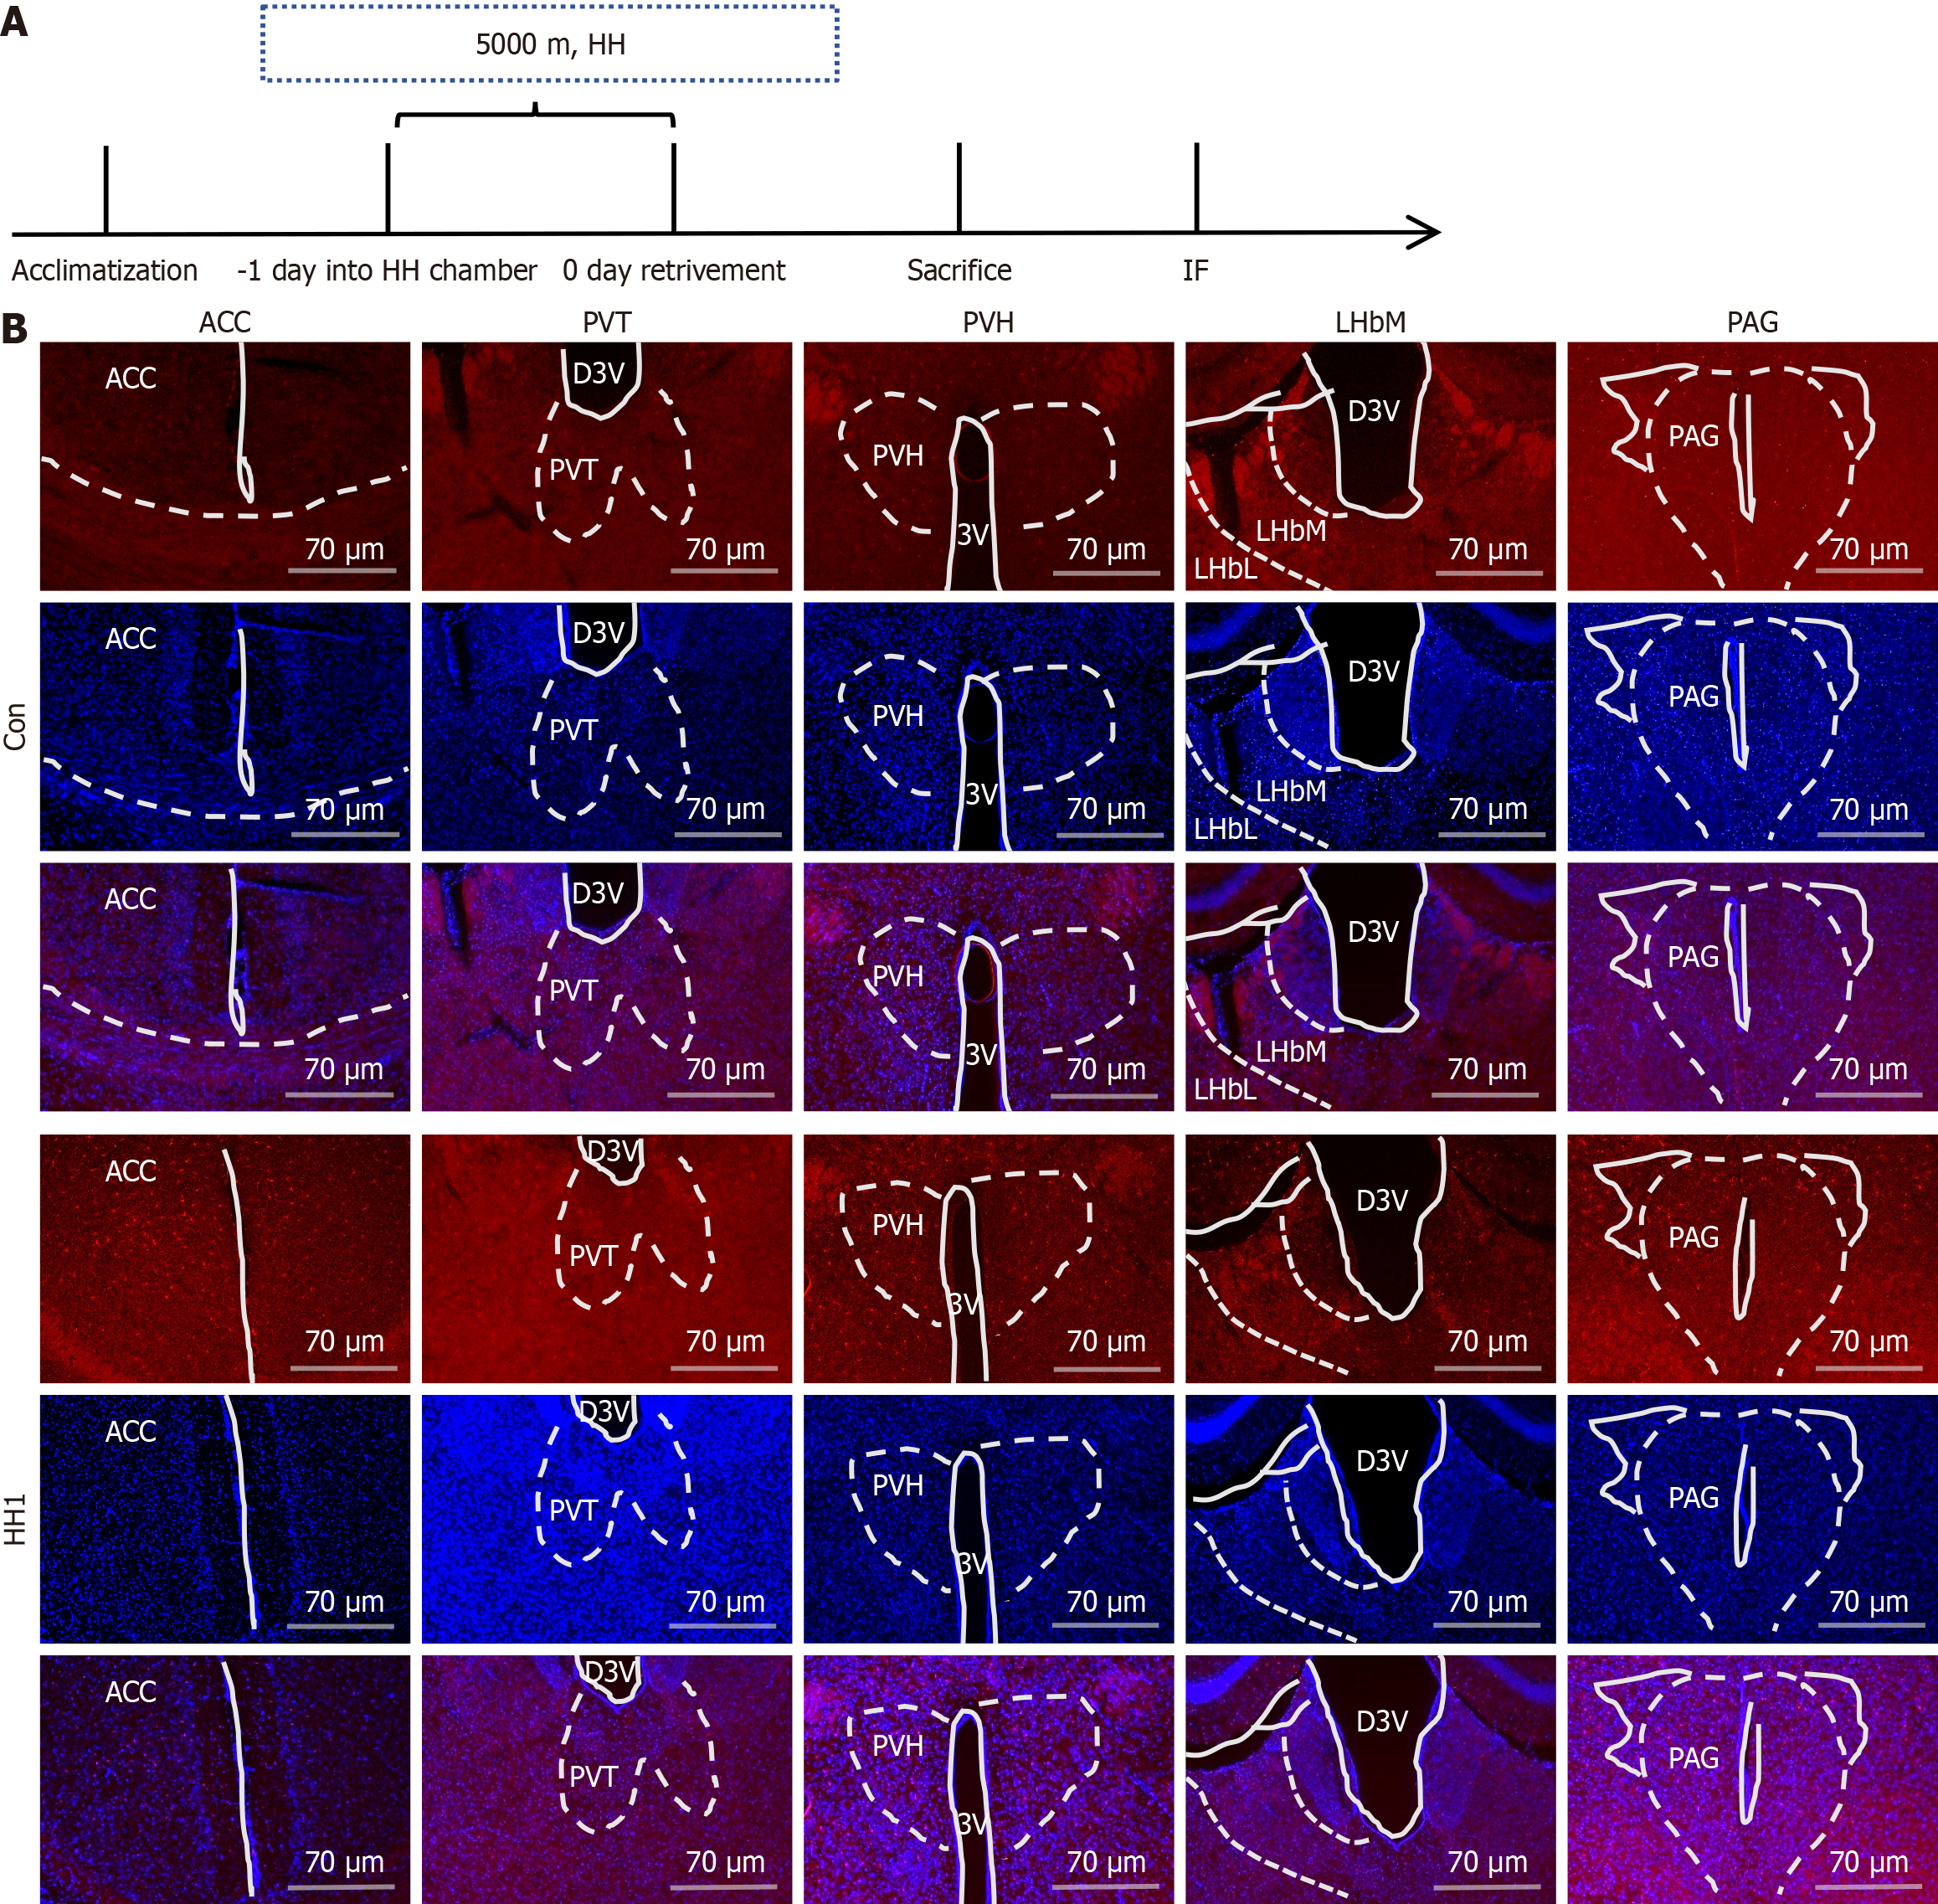
Figure 4 Iba-1 expression indicating activation in certain brain regions after 1d hypobaric hypoxia exposure.
A: One day hypobaric hypoxia paradigm; B: The expression of Iba-1 in the anterior cingulate cortex, paraventricular thalamic nucleus, lateral habenula nucleus, paraventricular nuclei of the hypothalamus, and the anterior periaqueductal gray. Con: Control group; HH1: One day of hypobaric hypoxia exposure; HH: Hypobaric hypoxia; IF: Immunofluorescence staining; ACC: Anterior cingulate cortex; PVT: Paraventricular thalamic nucleus; LHbM: Lateral habenular nucleus, medial part; LHbI: Lateral habenular nucleus, lateral part; D3V: Dorsal part of the third ventricle; PVH: Paraventricular nuclei of the hypothalamus; 3V: Third ventricle; LH: Lateral Hypothalamus; PAG: Periaqueductal gray; Aq: Aqueduct of Sylvius.
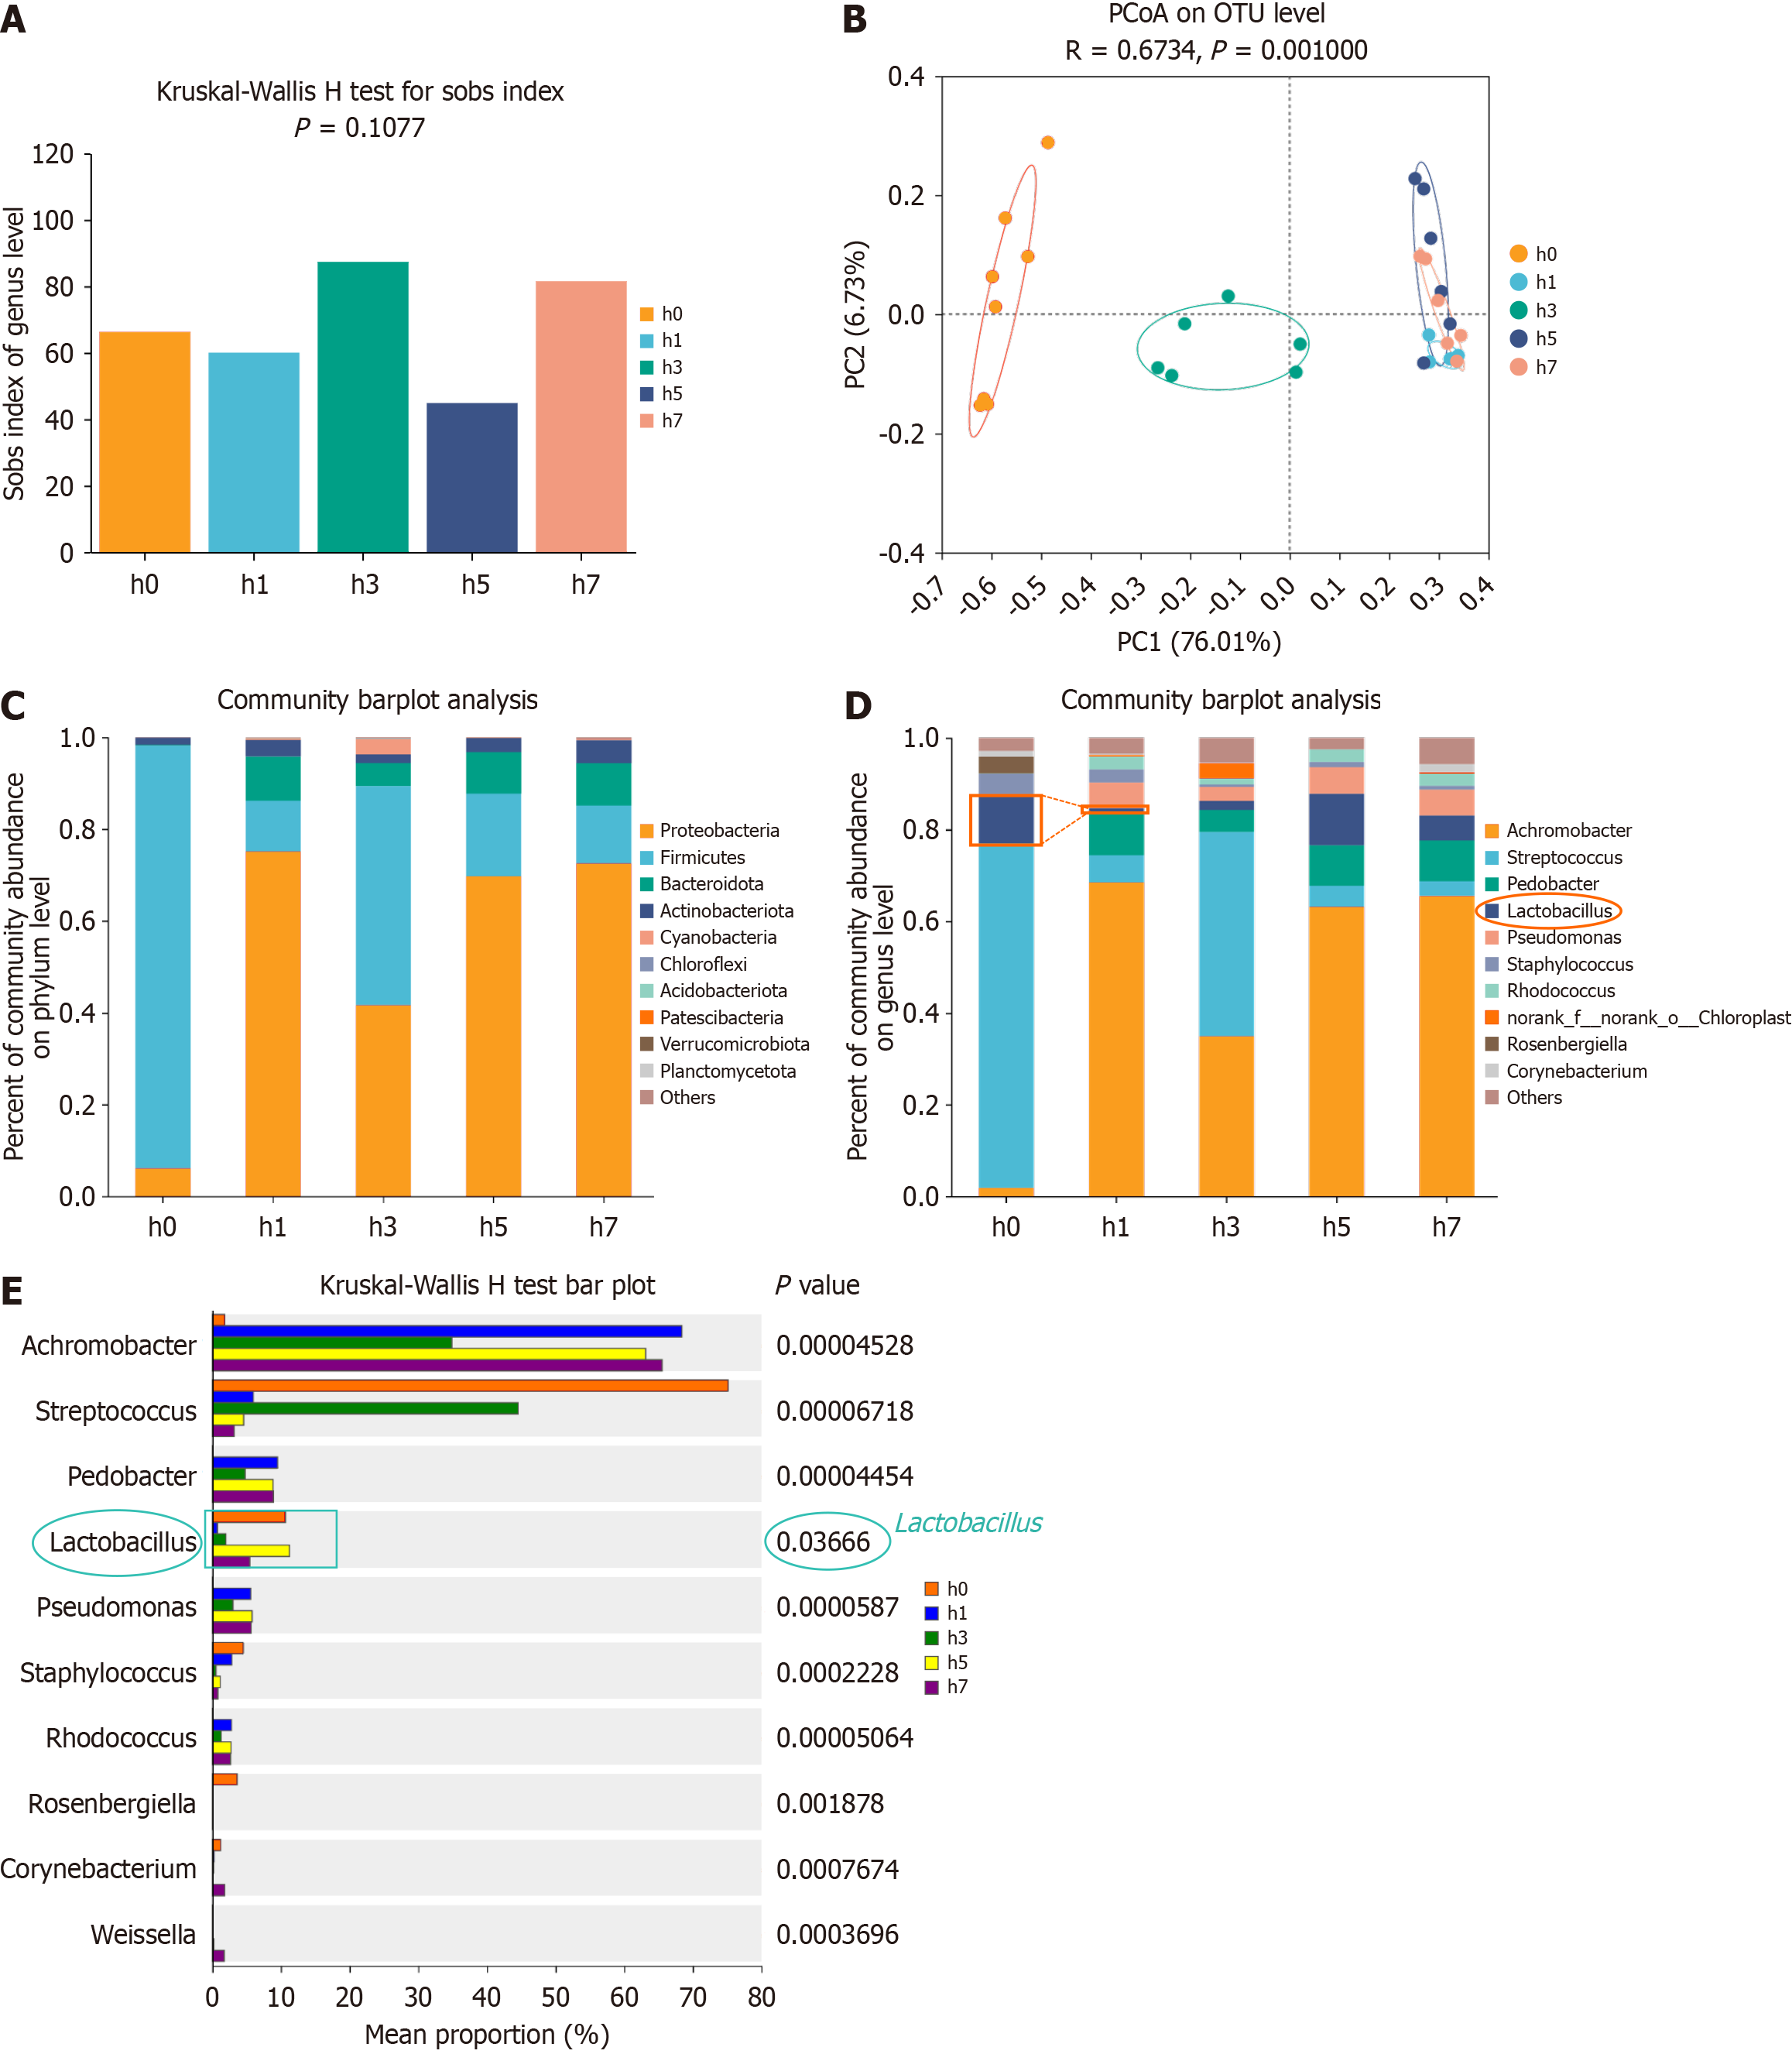
Figure 5 Hypobaric hypoxia causes variations in the composition and diversity of the oral microbiota.
A: Α-diversity is represented by the Sobs index for each group; B: Principal coordinate analysis was performed, and statistical significance between groups was evaluated using PERMANOVA; C: Richness of oral flora in each group at the phylum level; D: Richness of oral flora in each group at the genus level; E: Differences in microbial communities among groups were analyzed using a multi-group comparison of species composition. PCoA: Principal coordinate analysis; OTU: Operational taxonomic unit.
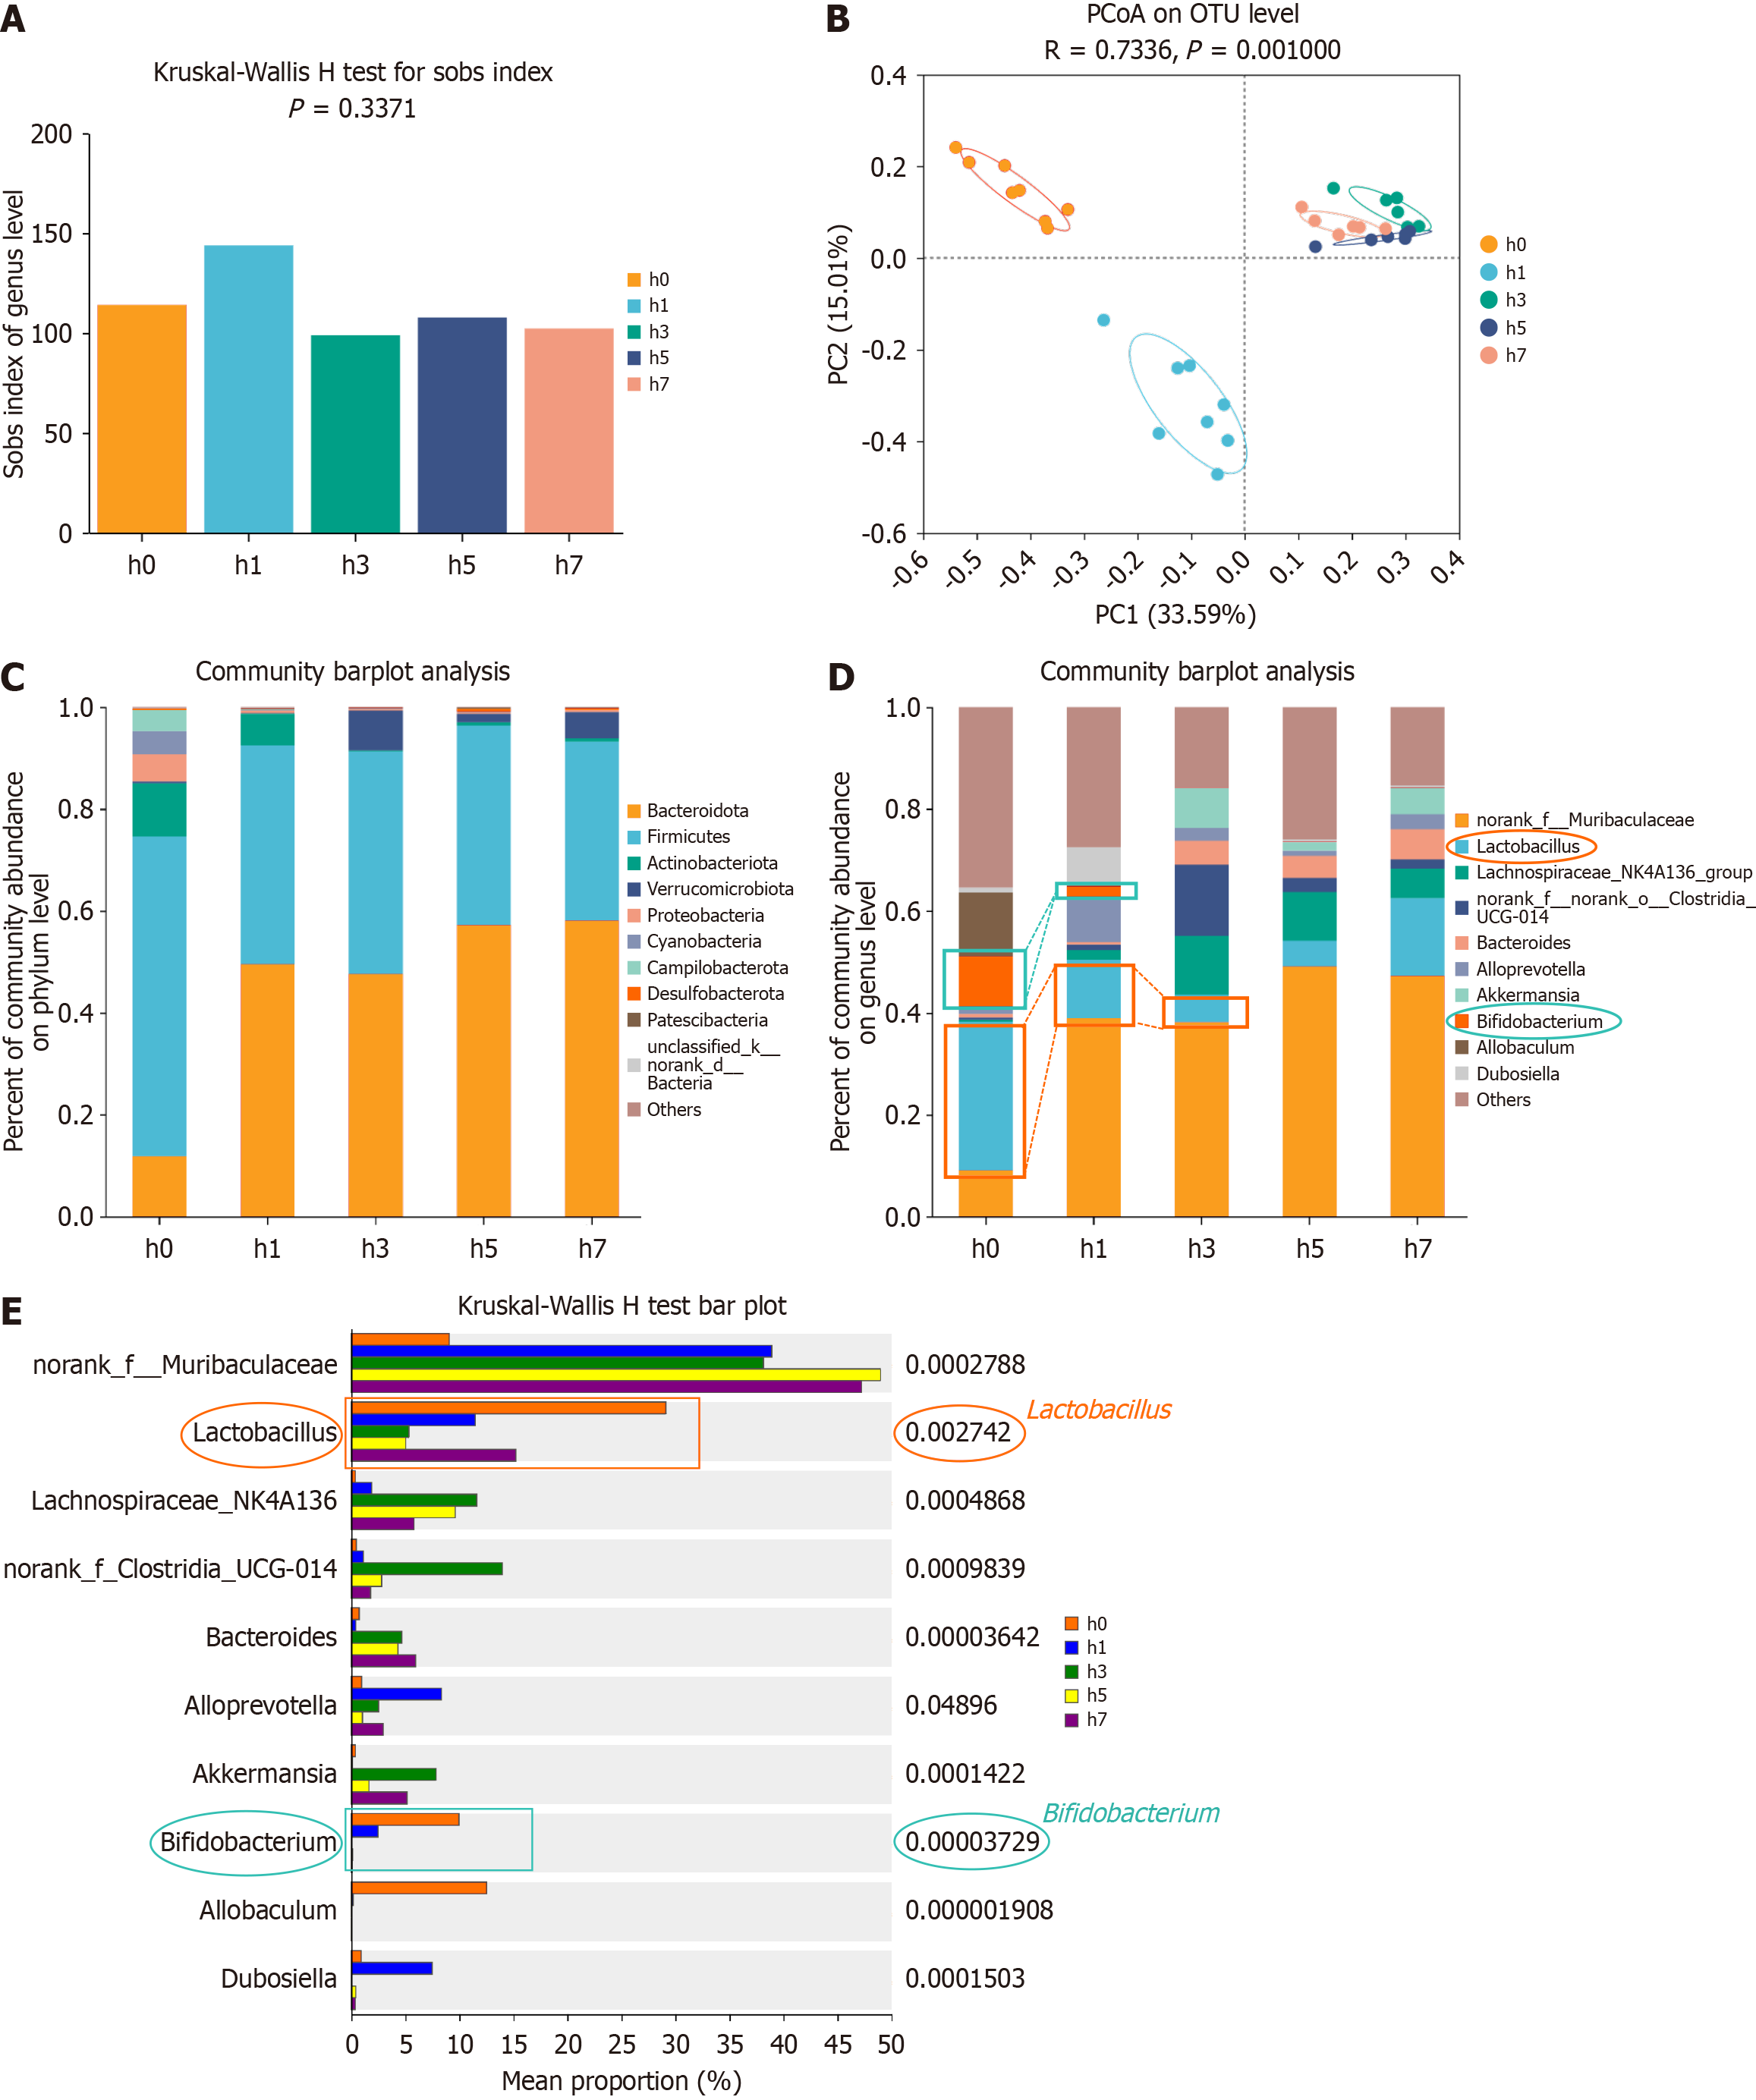
Figure 6 Hypobaric hypoxia exposure leads to changes in the fecal microbiota.
A: Α-diversity is represented by the Sobs index for fecal flora samples in each group; B: Principal coordinate analysis was performed, and statistical significance between groups was evaluated using PERMANOVA for fecal flora samples in each group; C: Richness of fecal flora in each group at the phylum level; D: Richness of fecal flora in each group at the genus level; E: Differences in microbial communities among groups were assessed using a multigroup comparison of species composition. PCoA: Principal coordinate analysis; OTU: Operational taxonomic unit.
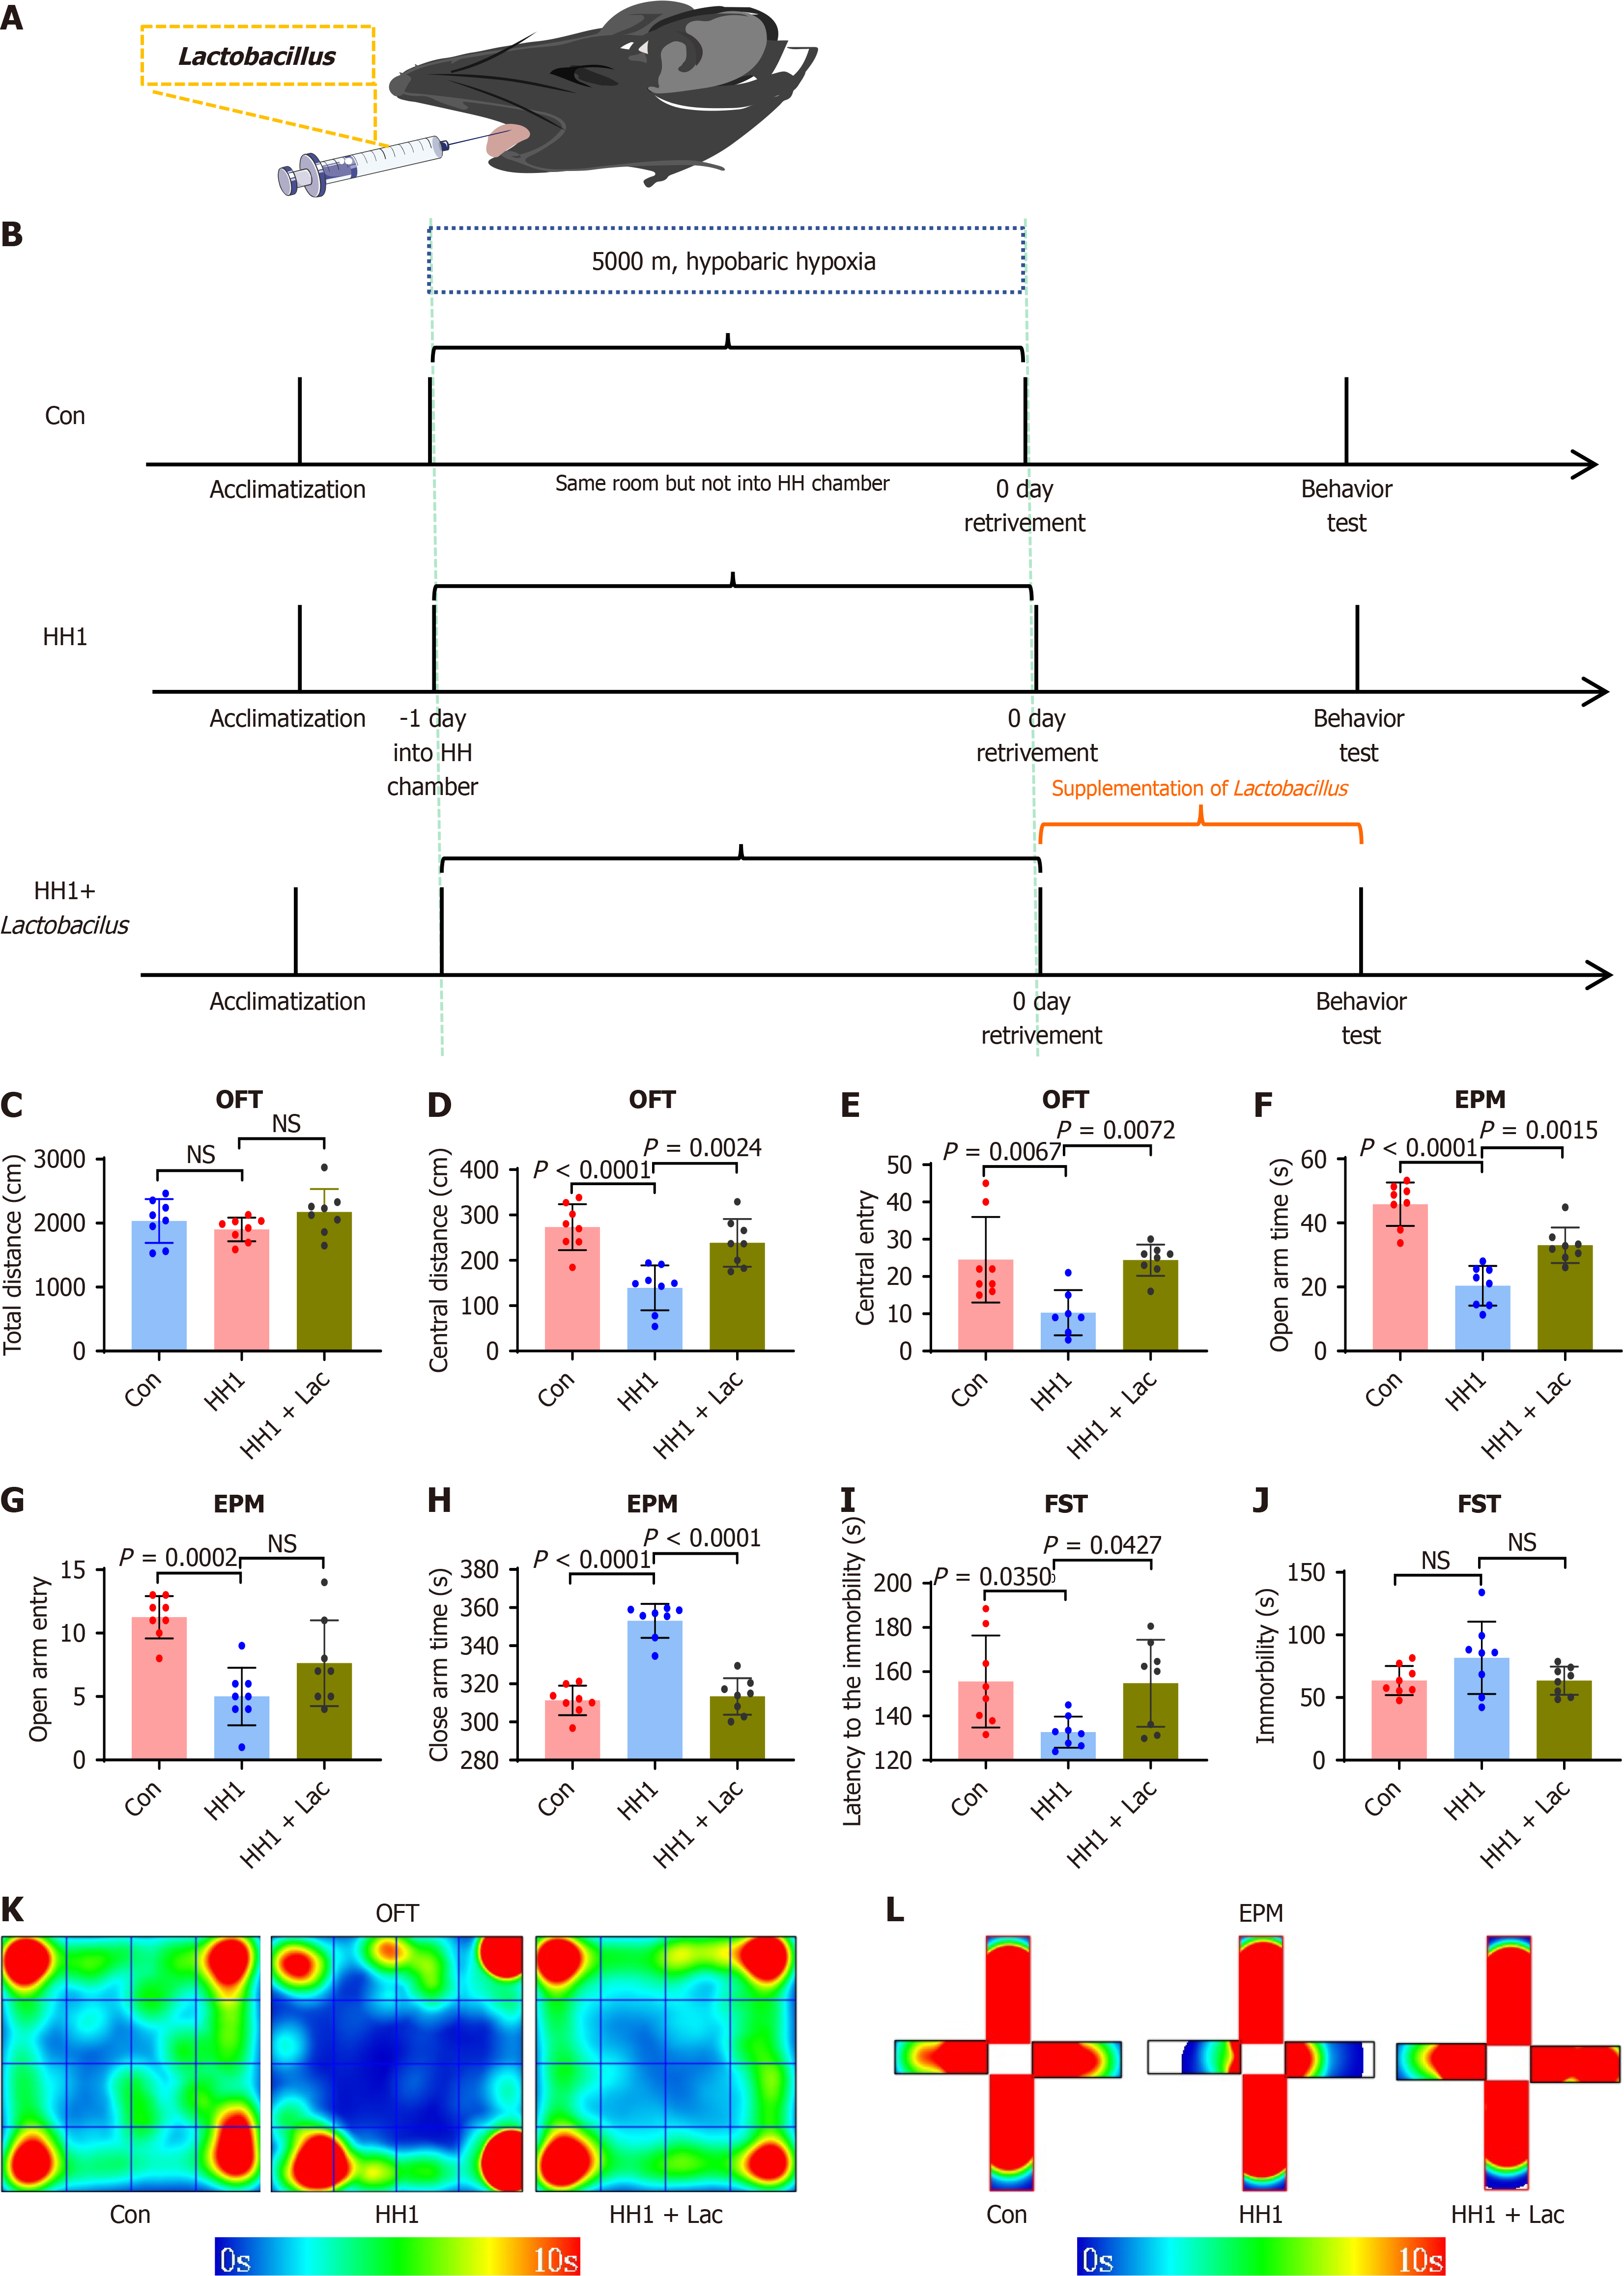
Figure 7 Supplementation with Lactobacillus complex alleviates anxiety and depression-like behavior in one day of hypobaric hypoxia exposure mice.
A: Schematic diagram of oral supplementation with Lactobacillus complex in mice; B: Lactobacillus supplementation experiment paradigm; C: Total distance for each group in the open field test (n = 8); D: Central distance for each group in the open field test (n = 8); E: Entries to the central zone for each group in the open field test (n = 8); F: Time spend in the open arm for each group in the elevated plus maze test (n = 8); G: Entries to the open arm for each group in the elevated plus maze test (n = 8); H: Time spend in the close arm for each group in the elevated plus maze test (n = 8); I: Immobility latency for each group in the forced swim test (n = 8); J: Immobility time or each group in the forced swim test (n = 8); K: Cluster heat-map for open field test across groups; L: Cluster heat-map for elevated plus maze across groups. NS: No significance; Con: Control group; HH1: One day of hypobaric hypoxia exposure; HH: Hypobaric hypoxia; OFT: Open field test; EPM: Elevated plus maze; FST: Forced swim test.
- Citation: Chang WY, Qin QZ, Li XT, Wang JJ, Chen Y, Ruan HQ, Qu YN, Jiang XX, He HX. Modulating oral microbiota ameliorates hypobaric hypoxia-induced anxiety- and depression-like behaviors in mice. World J Psychiatry 2025; 15(6): 104809
- URL: https://www.wjgnet.com/2220-3206/full/v15/i6/104809.htm
- DOI: https://dx.doi.org/10.5498/wjp.v15.i6.104809


