Copyright
©The Author(s) 2025.
World J Psychiatry. Feb 19, 2025; 15(2): 101818
Published online Feb 19, 2025. doi: 10.5498/wjp.v15.i2.101818
Published online Feb 19, 2025. doi: 10.5498/wjp.v15.i2.101818
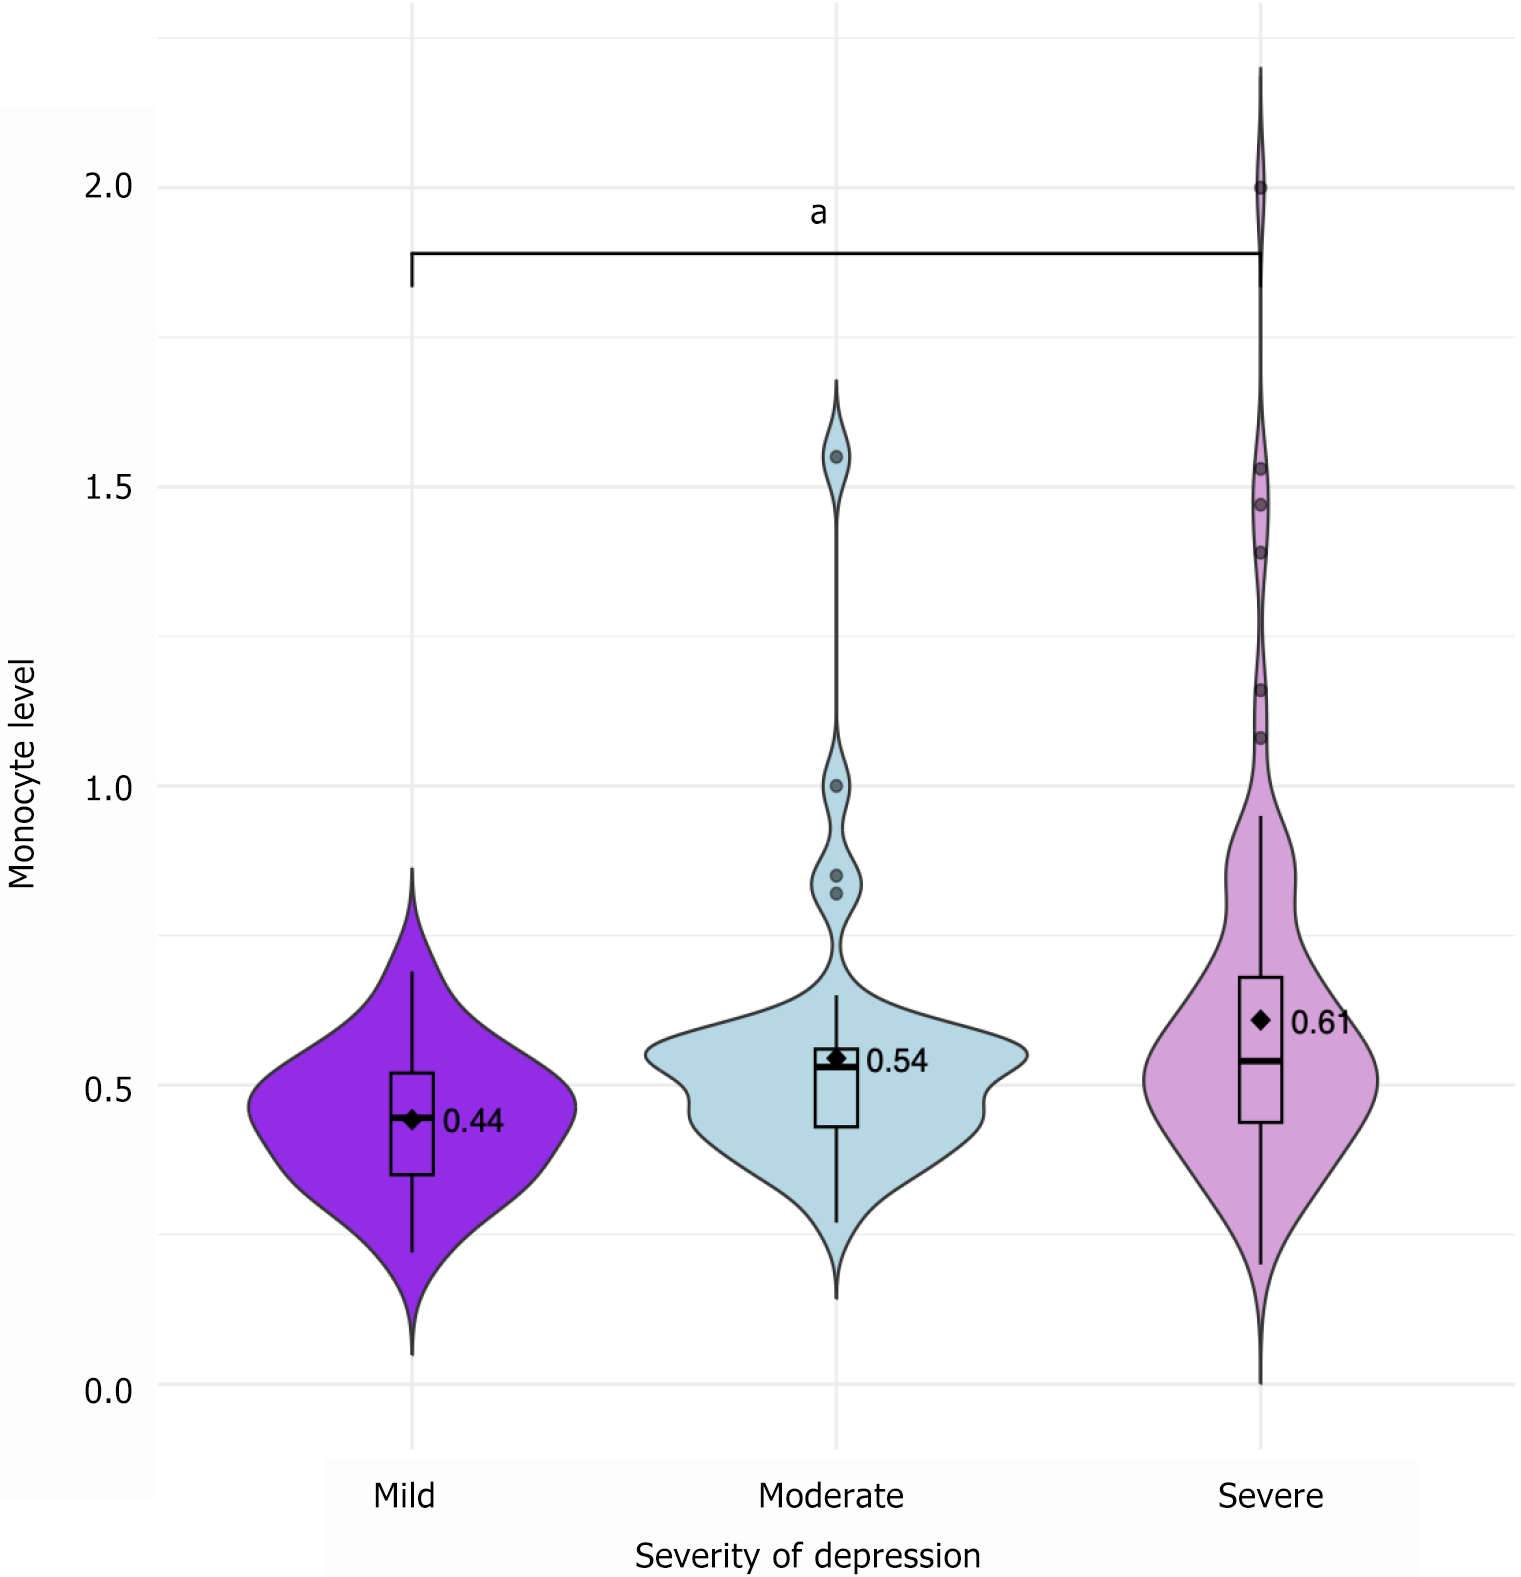
Figure 1 Comparison of monocyte counts among patients with mild, moderate, and severe depression.
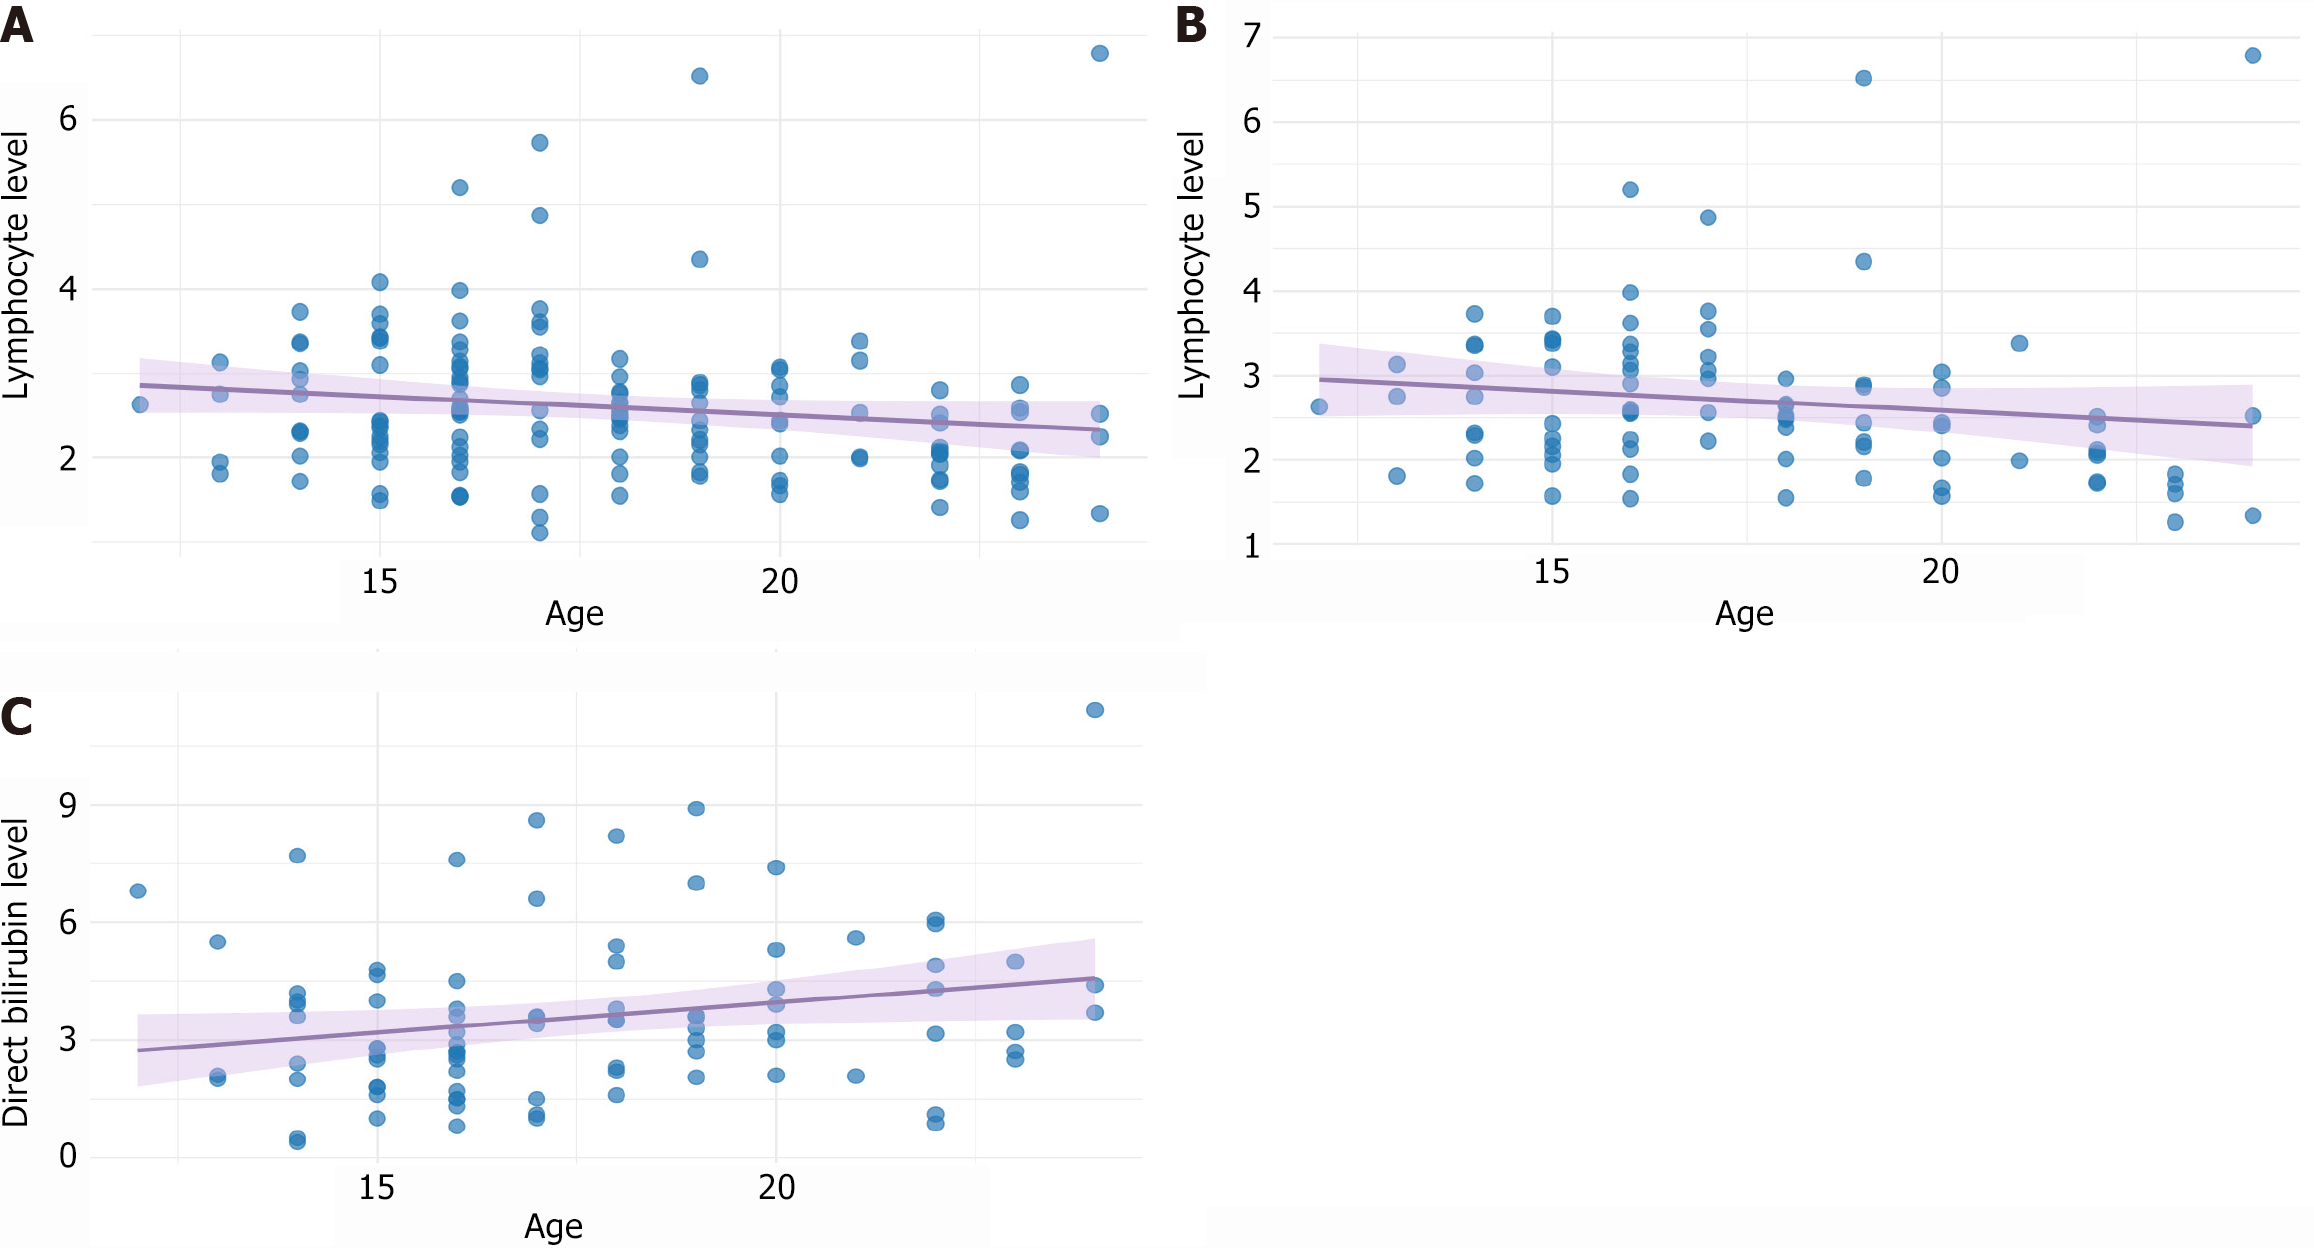
Figure 2 Correlation of age and lymphocyte count and correlation of age and direct bilirubin level in patients.
A and B: Correlation of age and lymphocyte count in patients of depression (A) and severe depression (B); C: Correlation of age and direct bilirubin level in patients with severe depression.
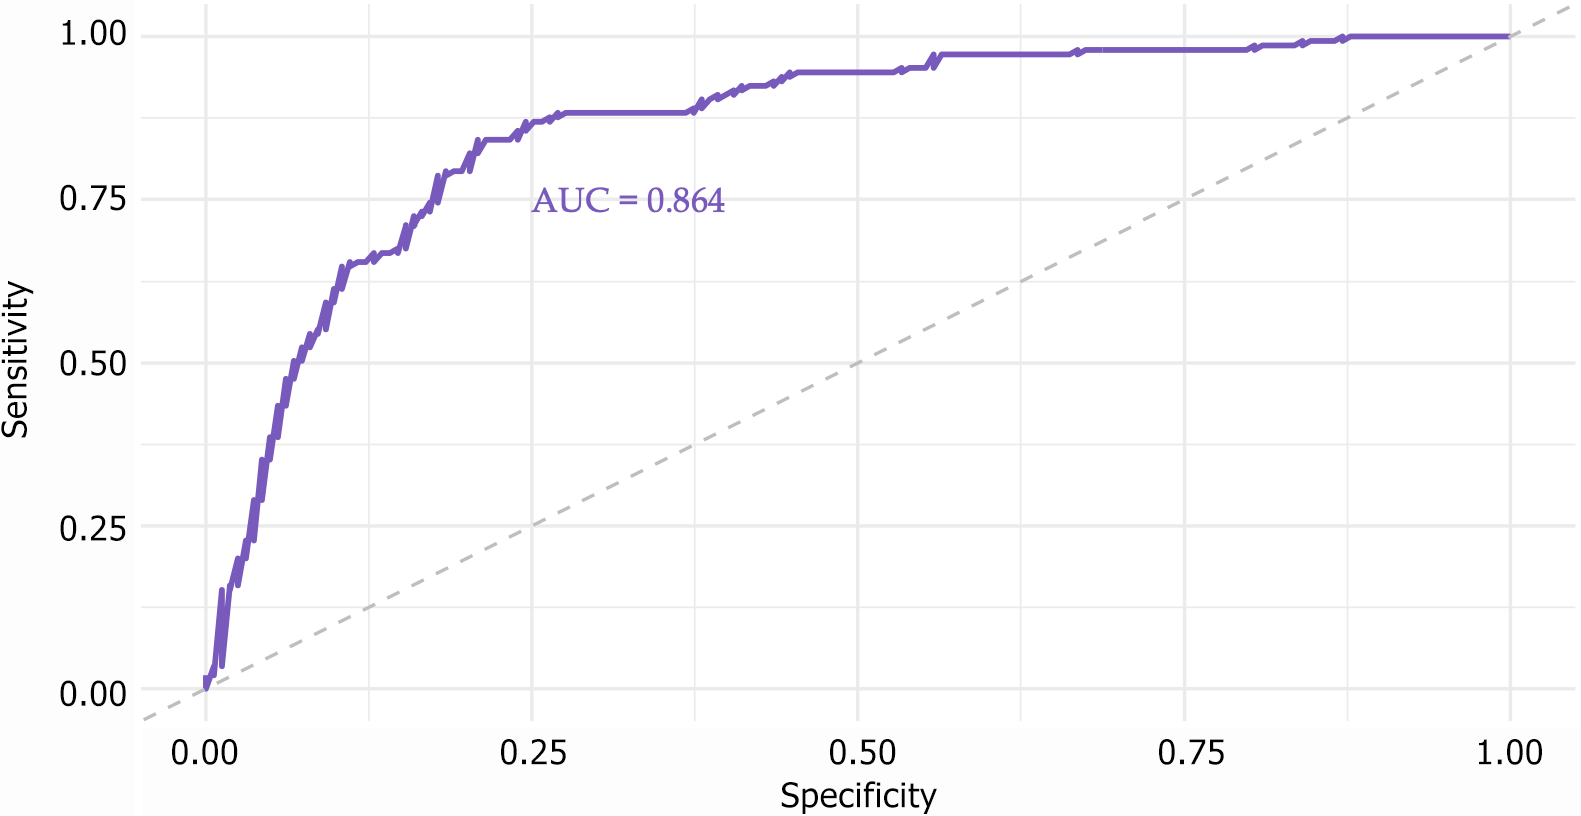
Figure 3 Receiver operating characteristic curve of the multivariable model.
AUC: Area under the curve.
- Citation: Dai J, Lin XT, Shen LL, Zhang XW, Ding ZW, Wang J, Fan XW, Ning WD. Immune indicators and depression in adolescents: Associations with monocytes, lymphocytes, and direct bilirubin. World J Psychiatry 2025; 15(2): 101818
- URL: https://www.wjgnet.com/2220-3206/full/v15/i2/101818.htm
- DOI: https://dx.doi.org/10.5498/wjp.v15.i2.101818


