Copyright
©The Author(s) 2025.
World J Psychiatry. Jan 19, 2025; 15(1): 97945
Published online Jan 19, 2025. doi: 10.5498/wjp.v15.i1.97945
Published online Jan 19, 2025. doi: 10.5498/wjp.v15.i1.97945
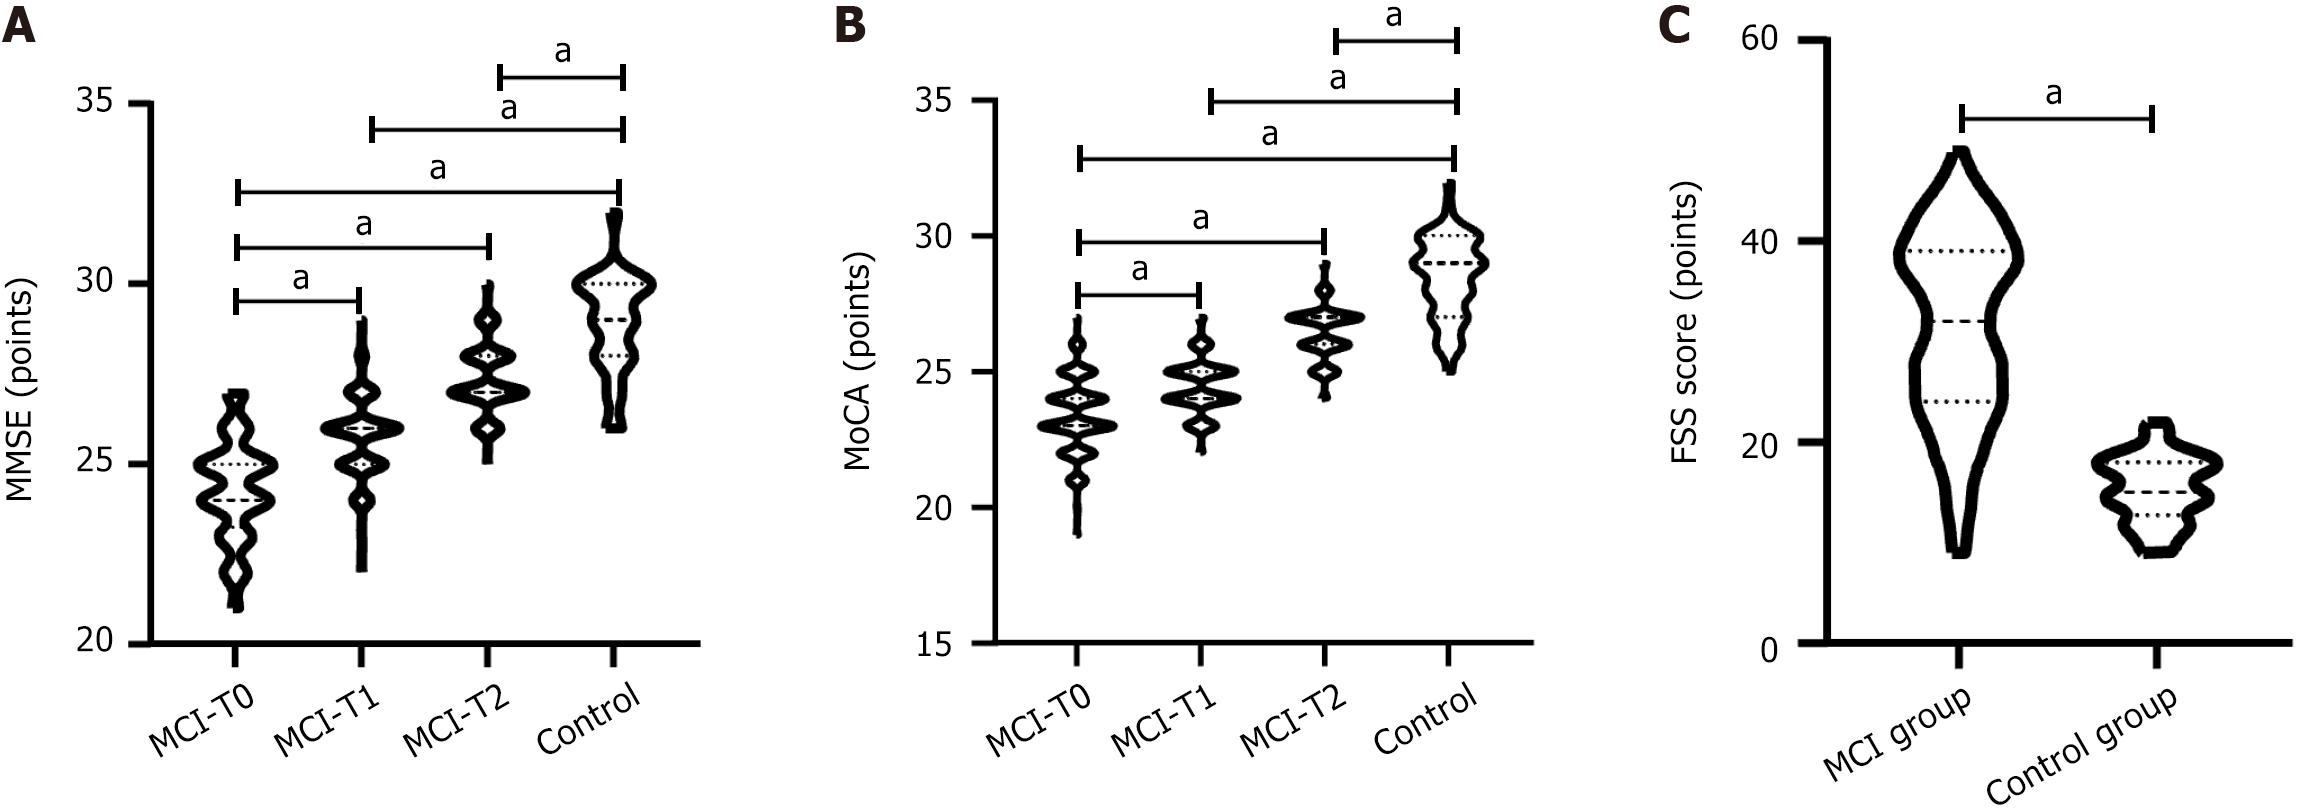
Figure 1 Comparison of Mini-Mental State Examination, Montreal Cognitive Assessment, and fatigue severity scale scores among different groups.
A: Mini-Mental State Examination score; B: Montreal Cognitive Assessment score; C: Fatigue severity scale score. aP < 0.05, represents the comparison of data between the two groups. MCI-T0, MCI-T1, and MCI-T2 represent the indicator levels of the mild cognitive impairment group at T0, T1, and T2, respectively. MCI: Mild cognitive impairment; MMSE: Mini-Mental State Examination; MoCA: Montreal Cognitive Assessment; FSS: Fatigue severity scale.
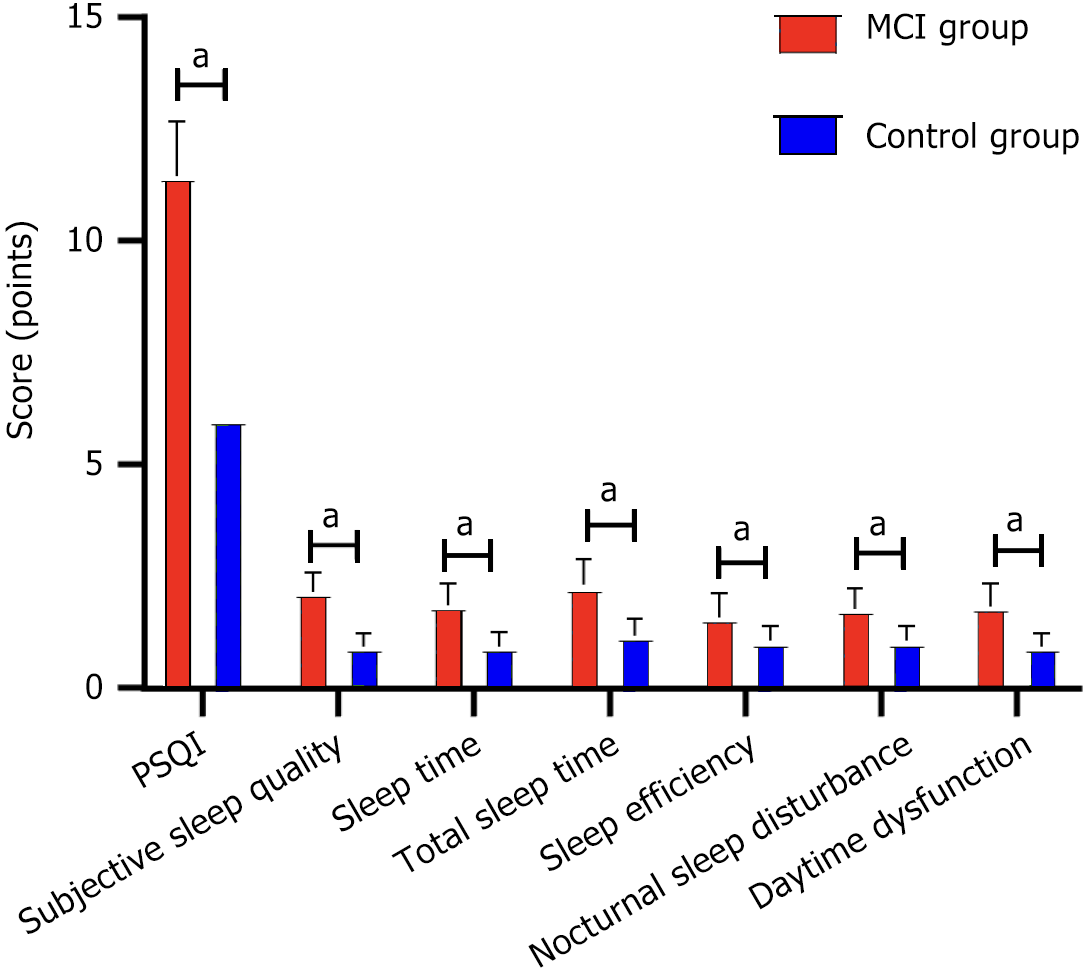
Figure 2 Comparison of Pittsburgh sleep quality index and its various dimensions scores between mild cognitive impairment group and control group.
aP < 0.05, represents the comparison of data between the two groups. MCI: Mild cognitive impairment; PSQI: Pittsburgh sleep quality index.
Figure 3 Comparison of sleep parameter between mild cognitive impairment group and control group.
A: Sleep efficiency; B: Awakening frequency; C: Rem sleep latency period; D: Total sleep time; E: Oxygen desaturation index. aP < 0.05, represents the comparison of data between the two groups. MCI: Mild cognitive impairment.
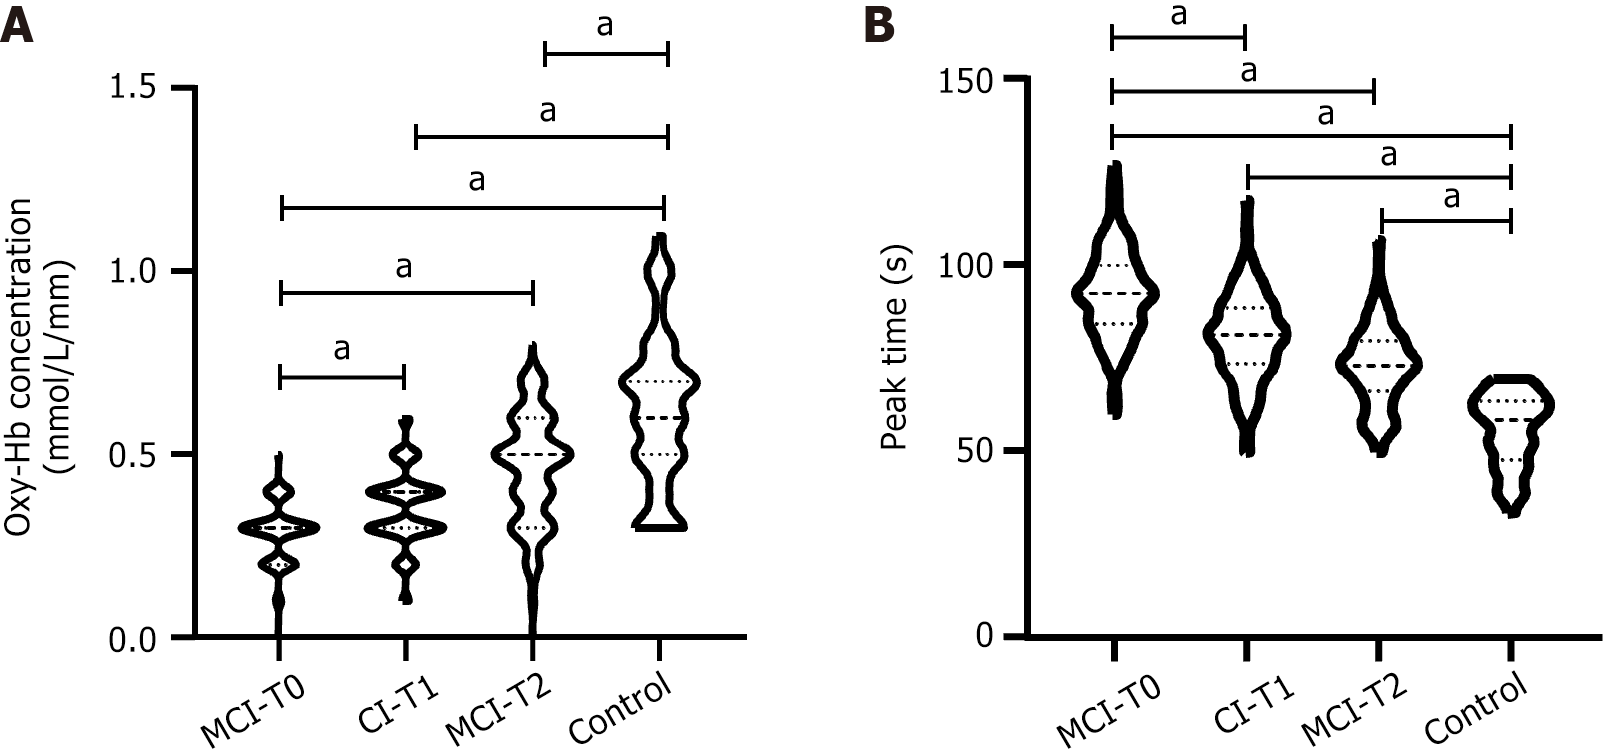
Figure 4 Comparison of oxyhemoglobin concentration and peak time during the task period among different groups.
A: Oxyhemoglobin concentration; B: Peak time. aP < 0.05, represents the comparison of data between the two groups. MCI-T0, MCI-T1, and MCI-T2 represent the indicator levels of the mild cognitive impairment group at T0, T1, and T2, respectively. MCI: Mild cognitive impairment; Oxy-Hb: Oxyhemoglobin.
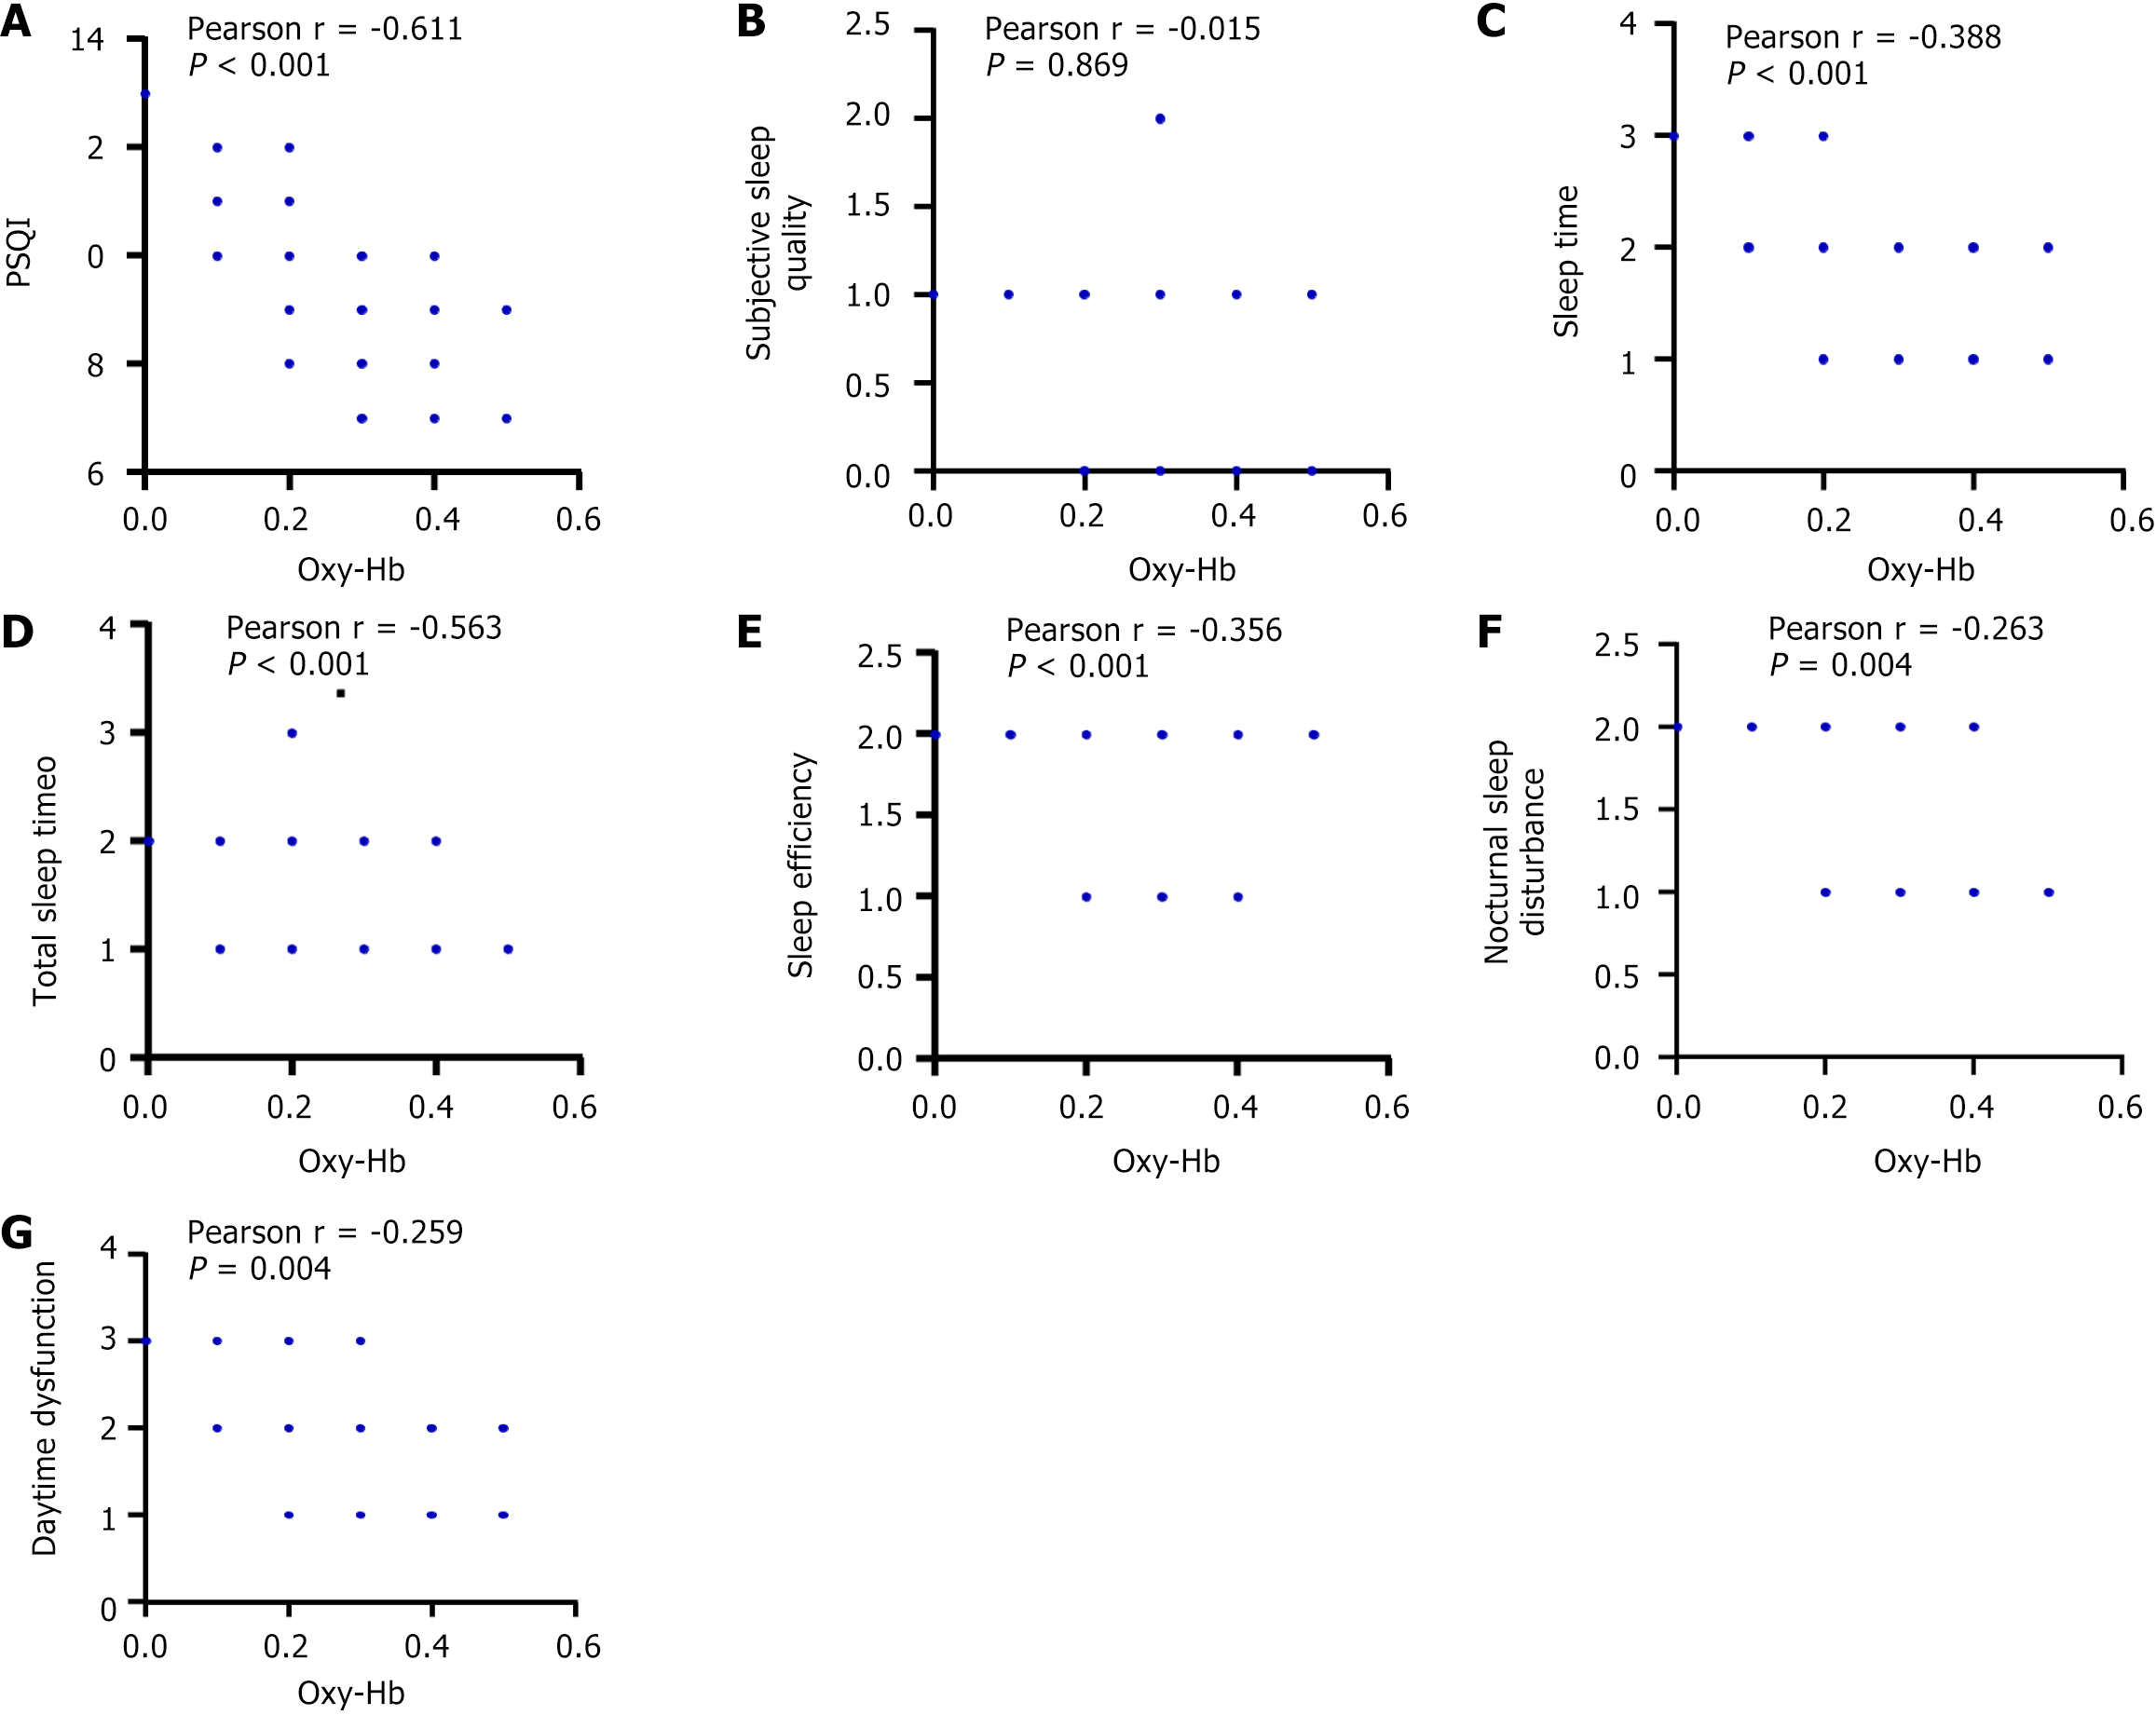
Figure 5 Scatter plot of the correlation between oxyhemoglobin concentration during the task period and Pittsburgh sleep quality index and its dimension scores.
A: Pittsburgh sleep quality index; B: Subjective sleep quality; C: Sleep time; D: Total sleep time; E: Sleep efficiency; F: Nocturnal sleep disturbance; G: Daytime dysfunction. PSQI: Pittsburgh sleep quality index; Oxy-Hb: Oxyhemoglobin.
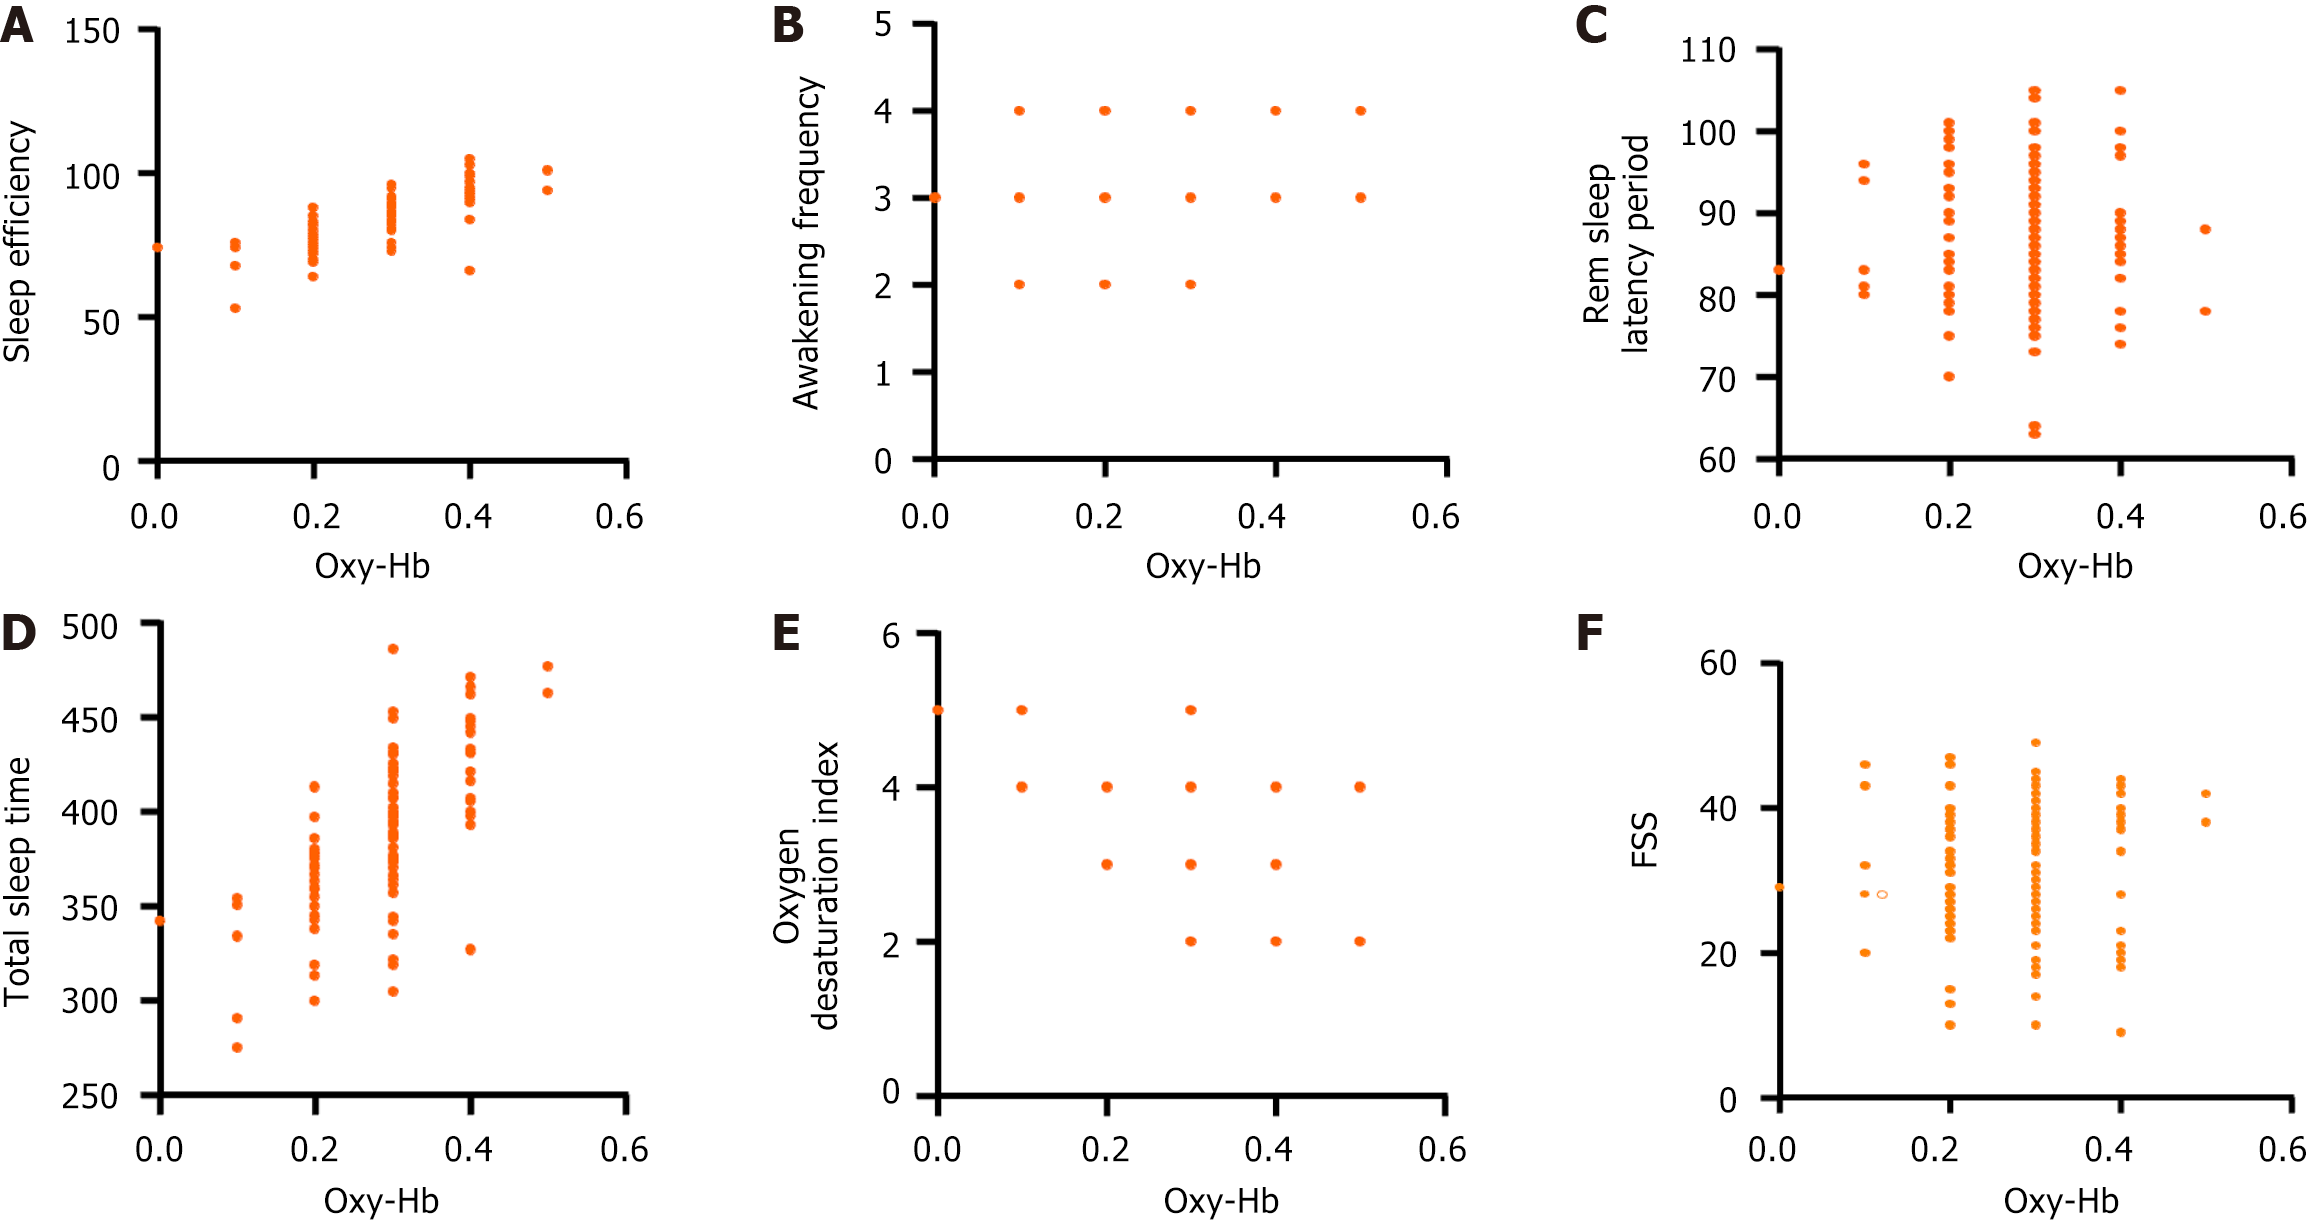
Figure 6 Scatterplot of the correlation between oxyhemoglobin concentration during the task period and sleep parameters and fatigue severity scale scores.
A: Sleep efficiency; B: Awakening frequency; C: Rem sleep latency period; D: Total sleep time; E: Oxygen desaturation index; F: Fatigue severity scale score. FSS: Fatigue severity scale; Oxy-Hb: Oxyhemoglobin.
- Citation: Liao H, Liao S, Gao YJ, Wang X, Guo LH, Zheng S, Yang W, Dai YN. Near-infrared brain functional characteristics of mild cognitive impairment with sleep disorders. World J Psychiatry 2025; 15(1): 97945
- URL: https://www.wjgnet.com/2220-3206/full/v15/i1/97945.htm
- DOI: https://dx.doi.org/10.5498/wjp.v15.i1.97945


