Copyright
©The Author(s) 2025.
World J Psychiatry. Jan 19, 2025; 15(1): 101750
Published online Jan 19, 2025. doi: 10.5498/wjp.v15.i1.101750
Published online Jan 19, 2025. doi: 10.5498/wjp.v15.i1.101750
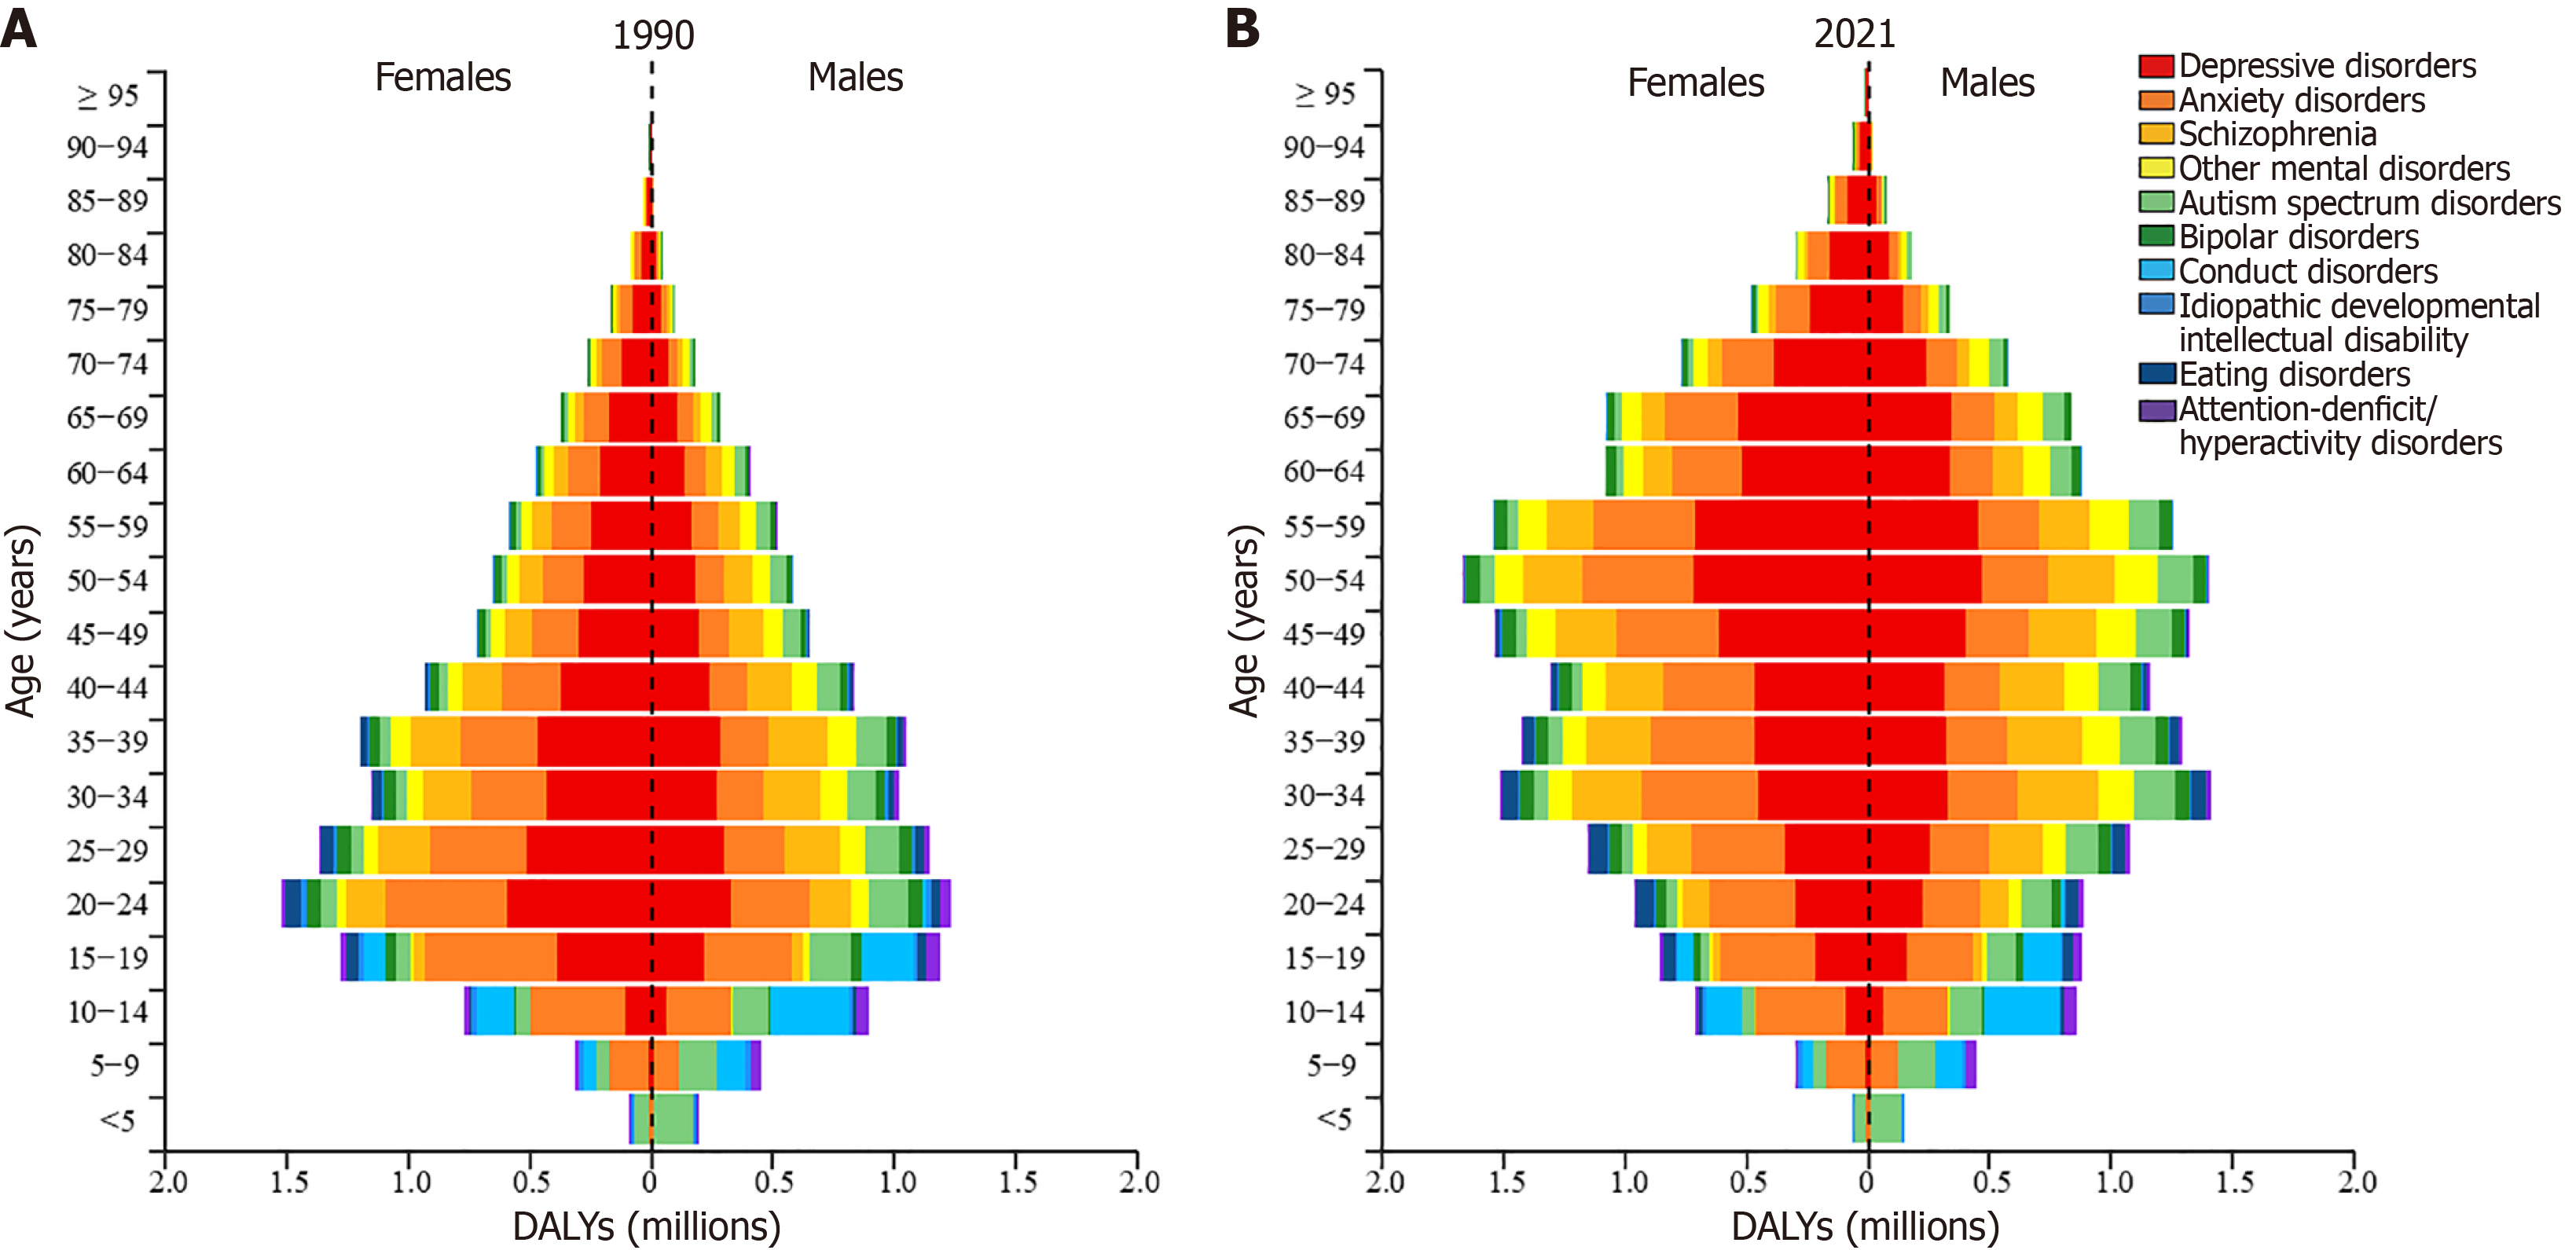
Figure 1 Disability-adjusted life-years for mental disorders in the Western Pacific Region by sex and age, 1990 and 2021.
DALYs: Disability-adjusted life-years.
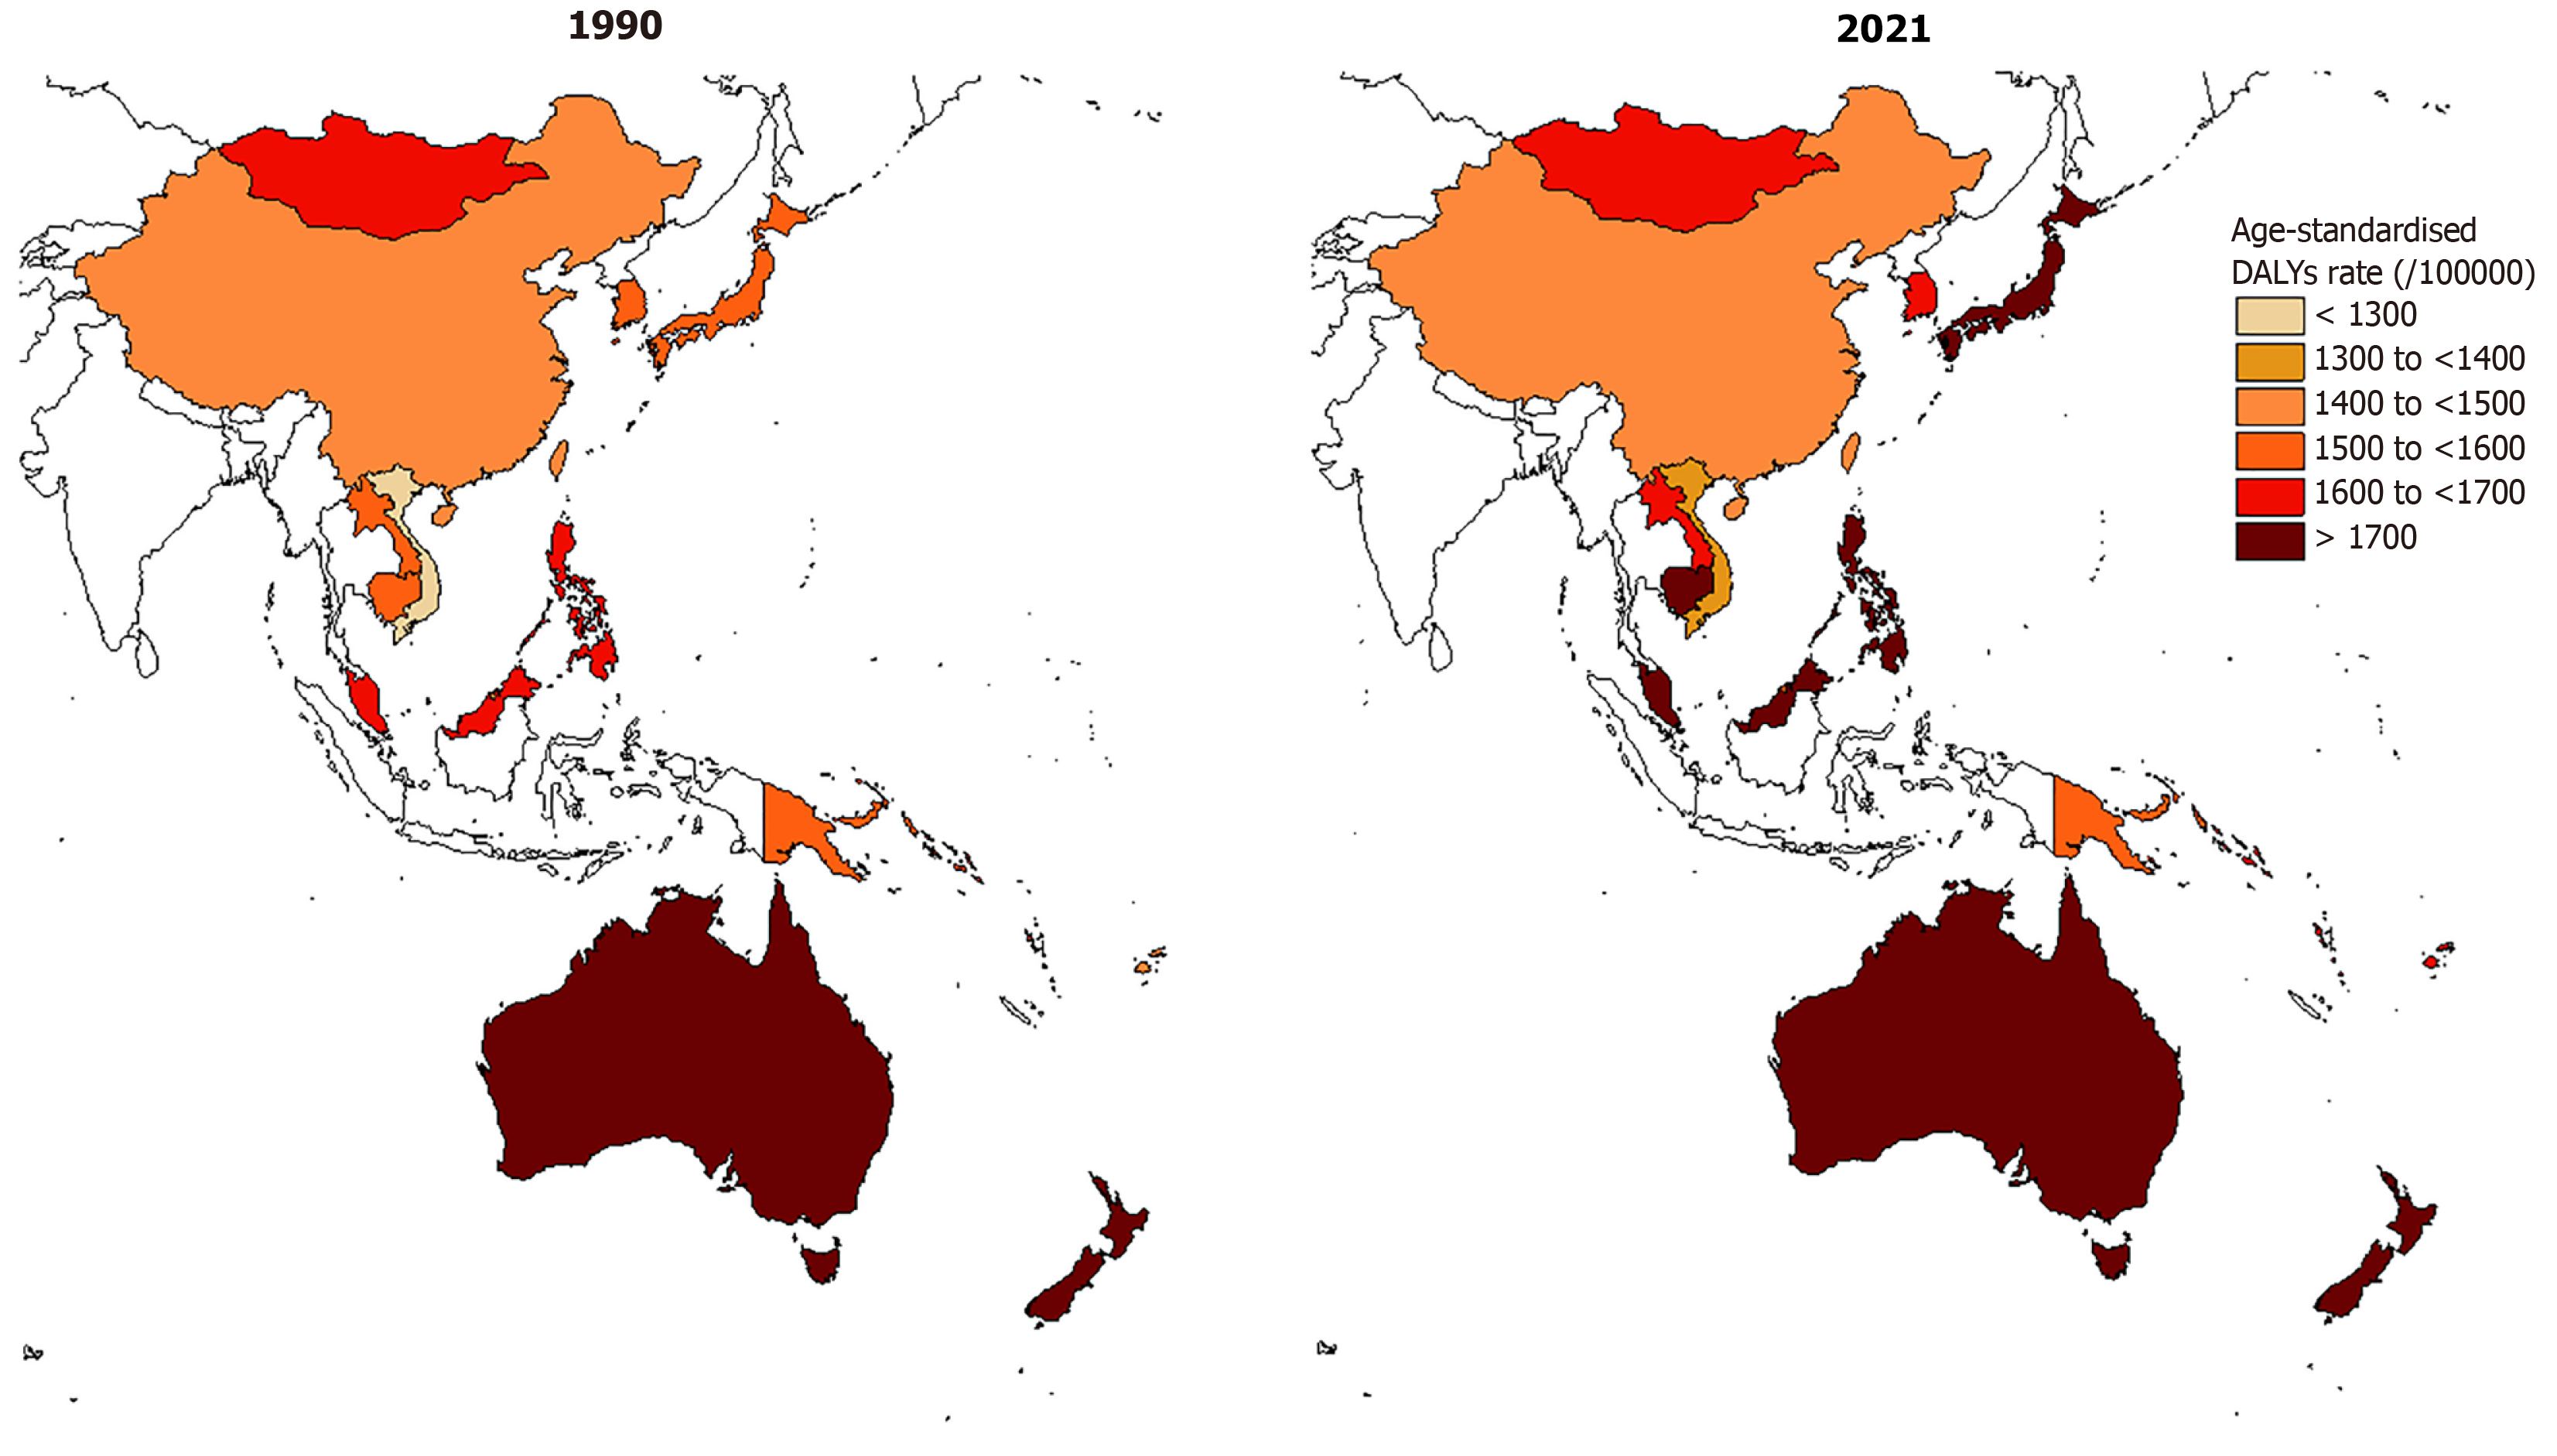
Figure 2 Age-standardised disability-adjusted life-years per 100000 population attributable to mental disorders in the Western Pacific Region, 1990 and 2021.
DALYs: Disability-adjusted life-years; ASR: Age-standardised rates.
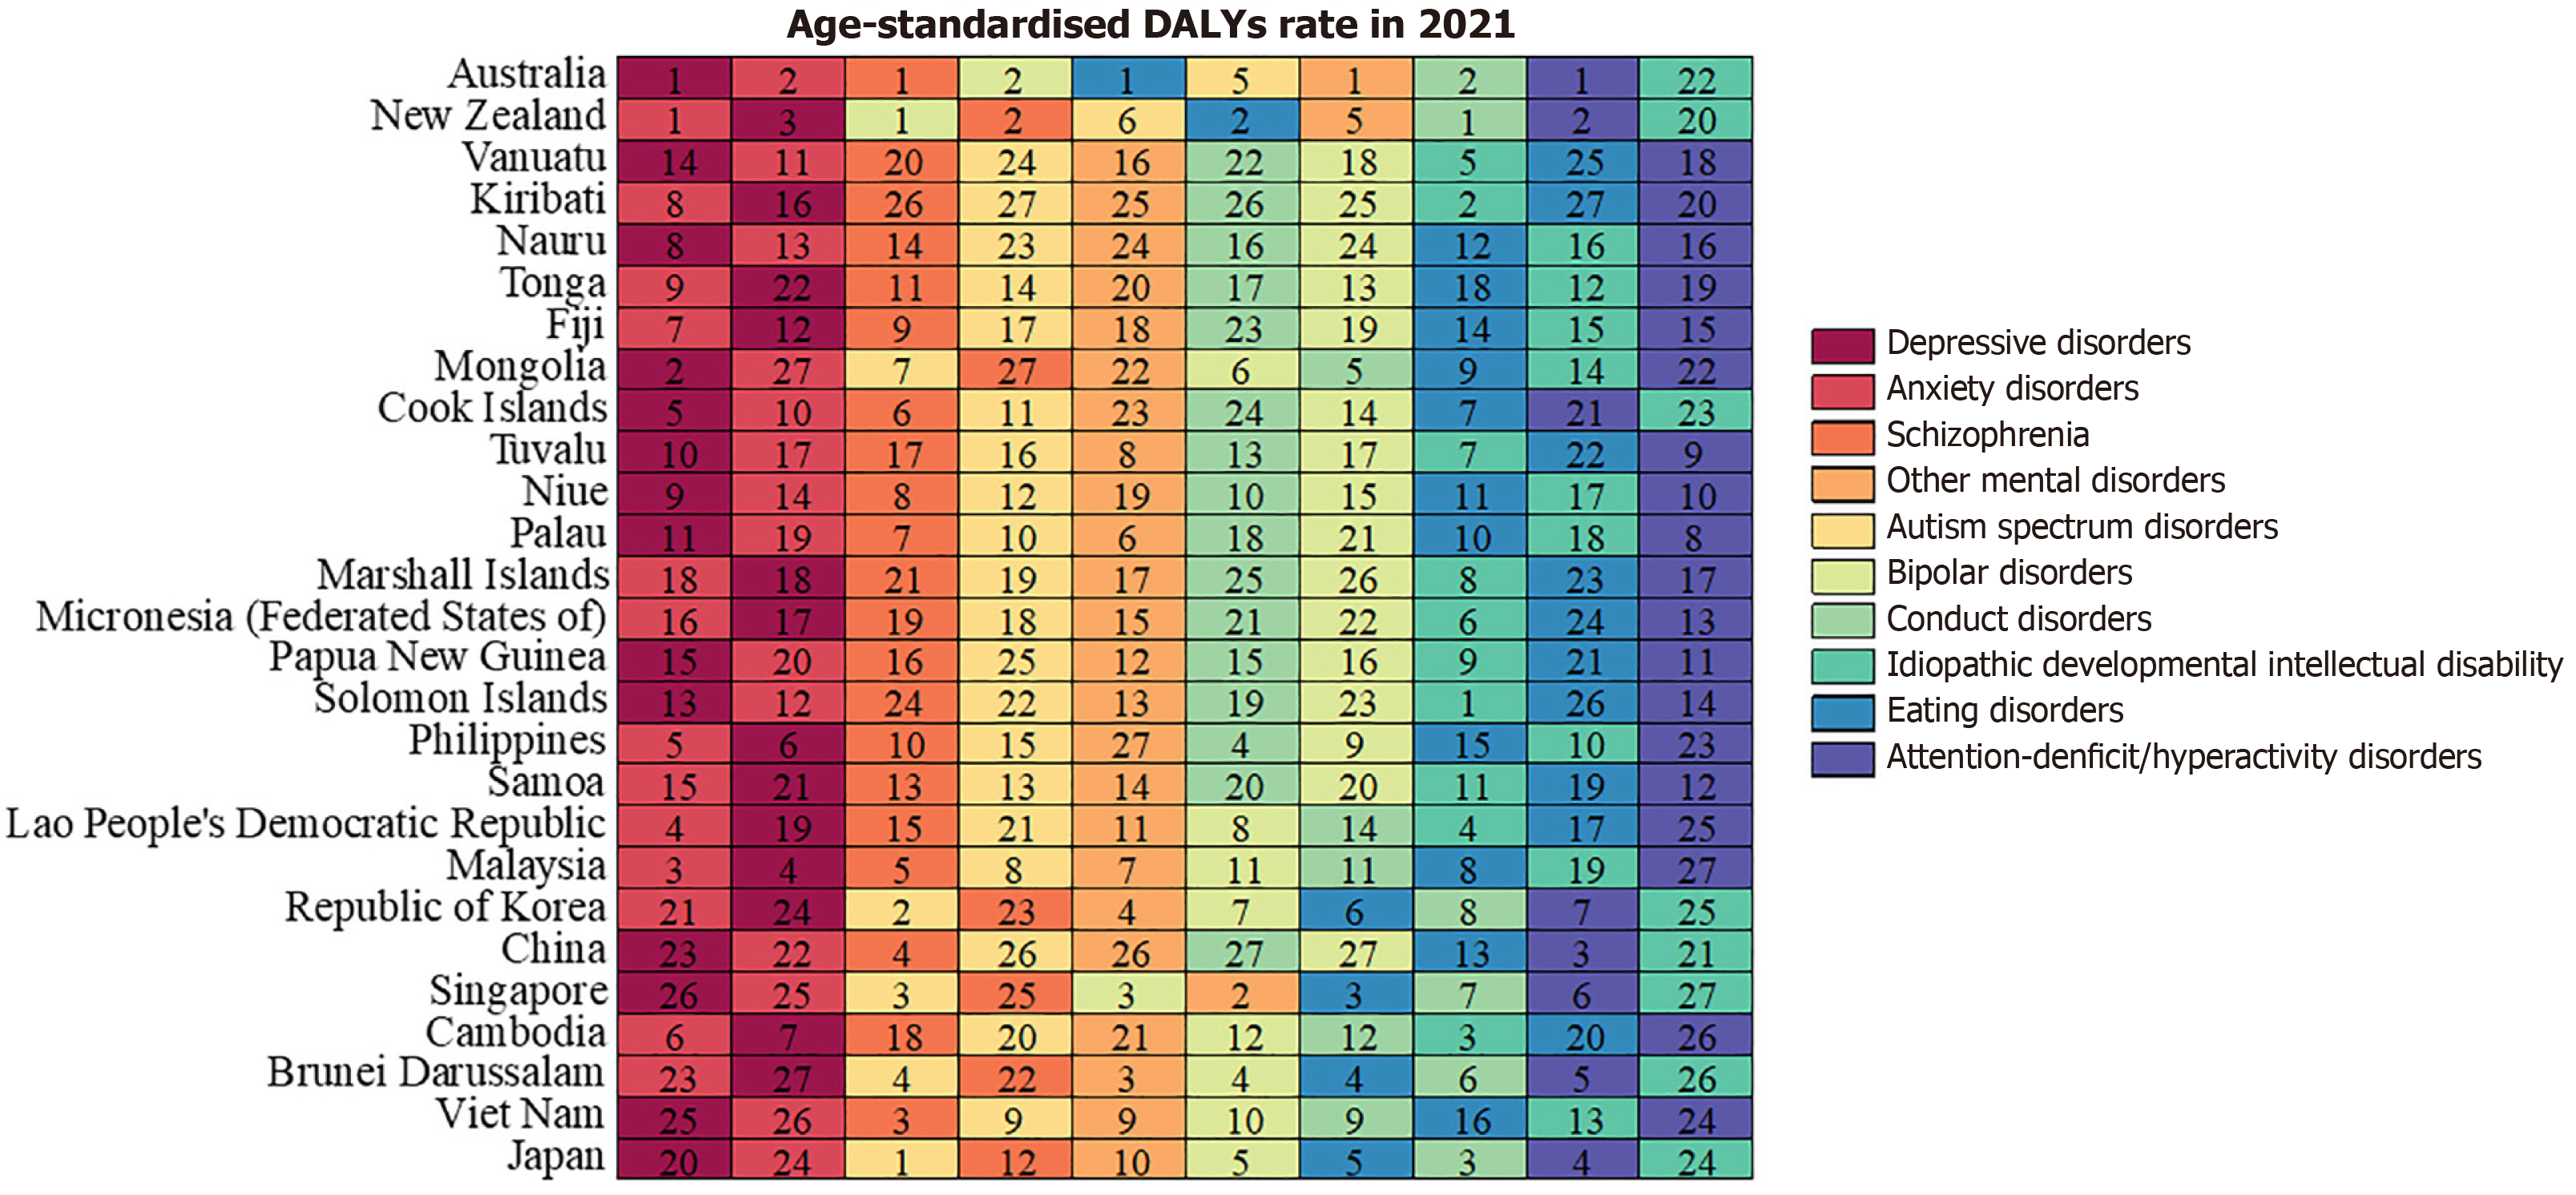
Figure 3 Rankings of age-standardised disability-adjusted life-years for mental disorders by country, 2021.
The disorders are sequentially ordered from highest to lowest burden per country. Each distinct color denotes a different type of mental disorder. The numerical labels within each box indicate the regional rank of that particular mental disorder's disability-adjusted life-years within the Western Pacific Region. DALYs: Disability-adjusted life-years.
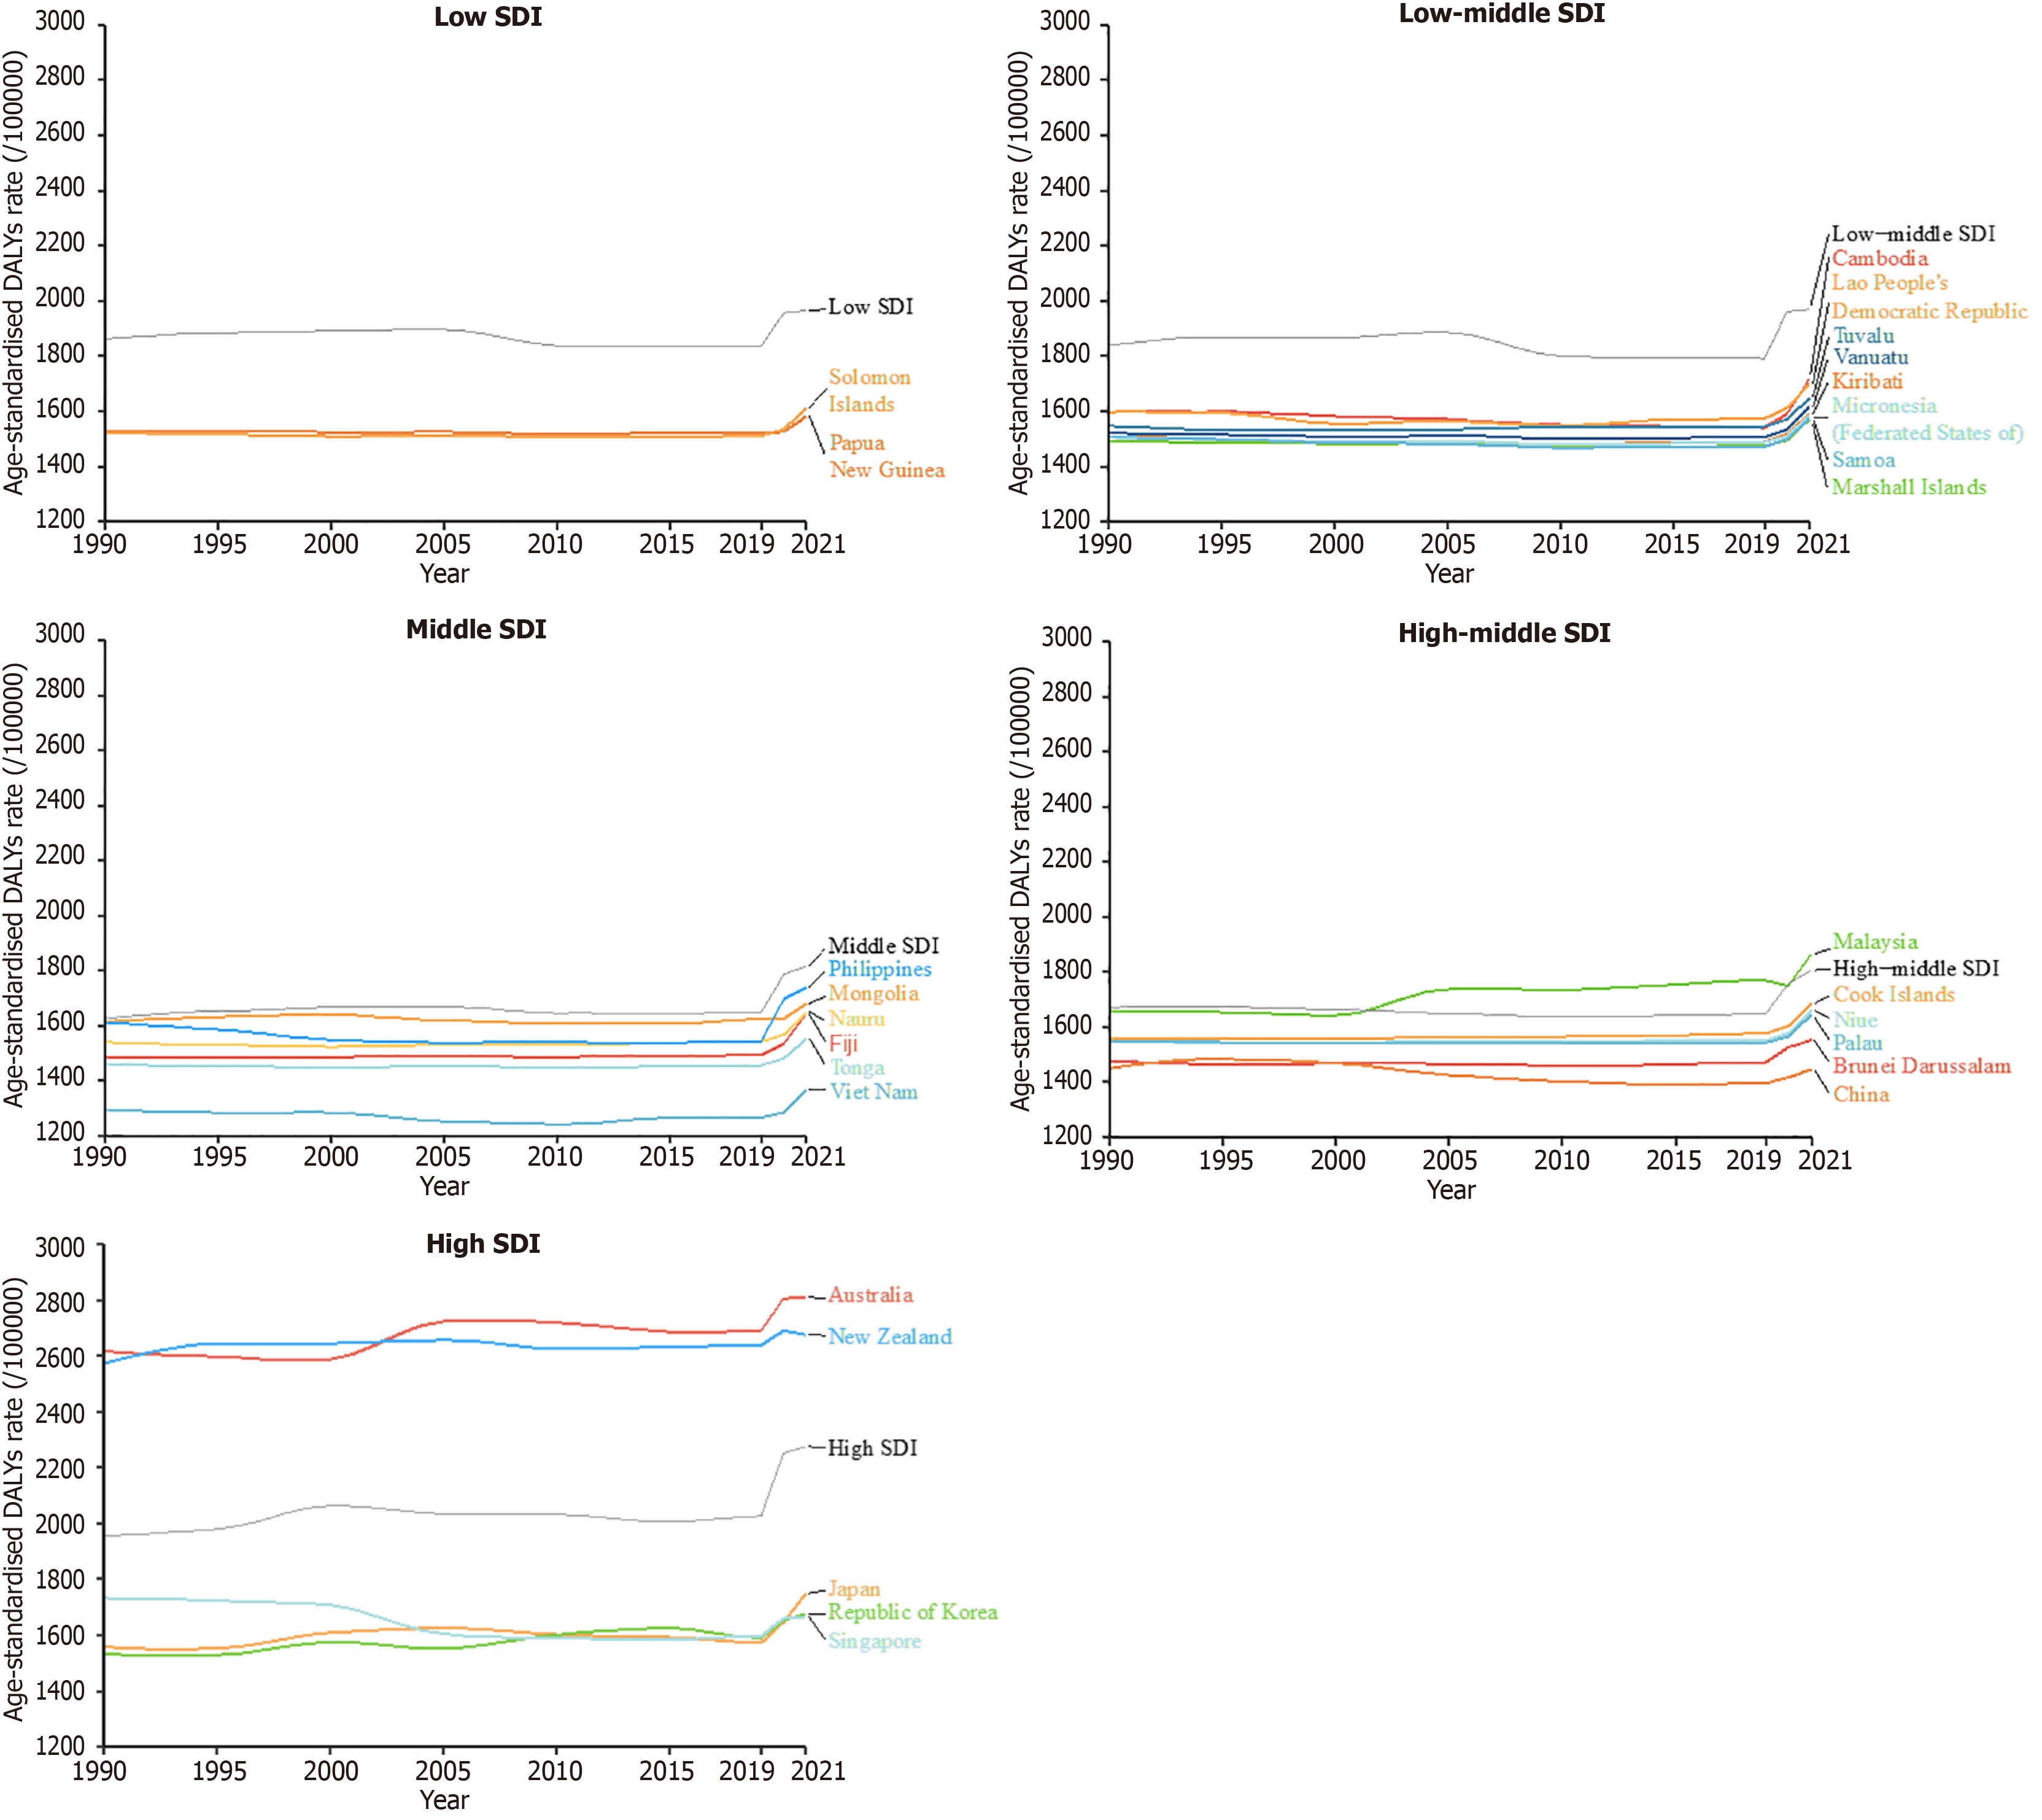
Figure 4 Temporal trends of age-standardised disability-adjusted life-years for mental disorders in the Western Pacific Region by country and Sociodemographic Index, 1990-2021.
DALYs: Disability-adjusted life-years; ASR: Age-standardised rates; SDI: Sociodemographic Index.
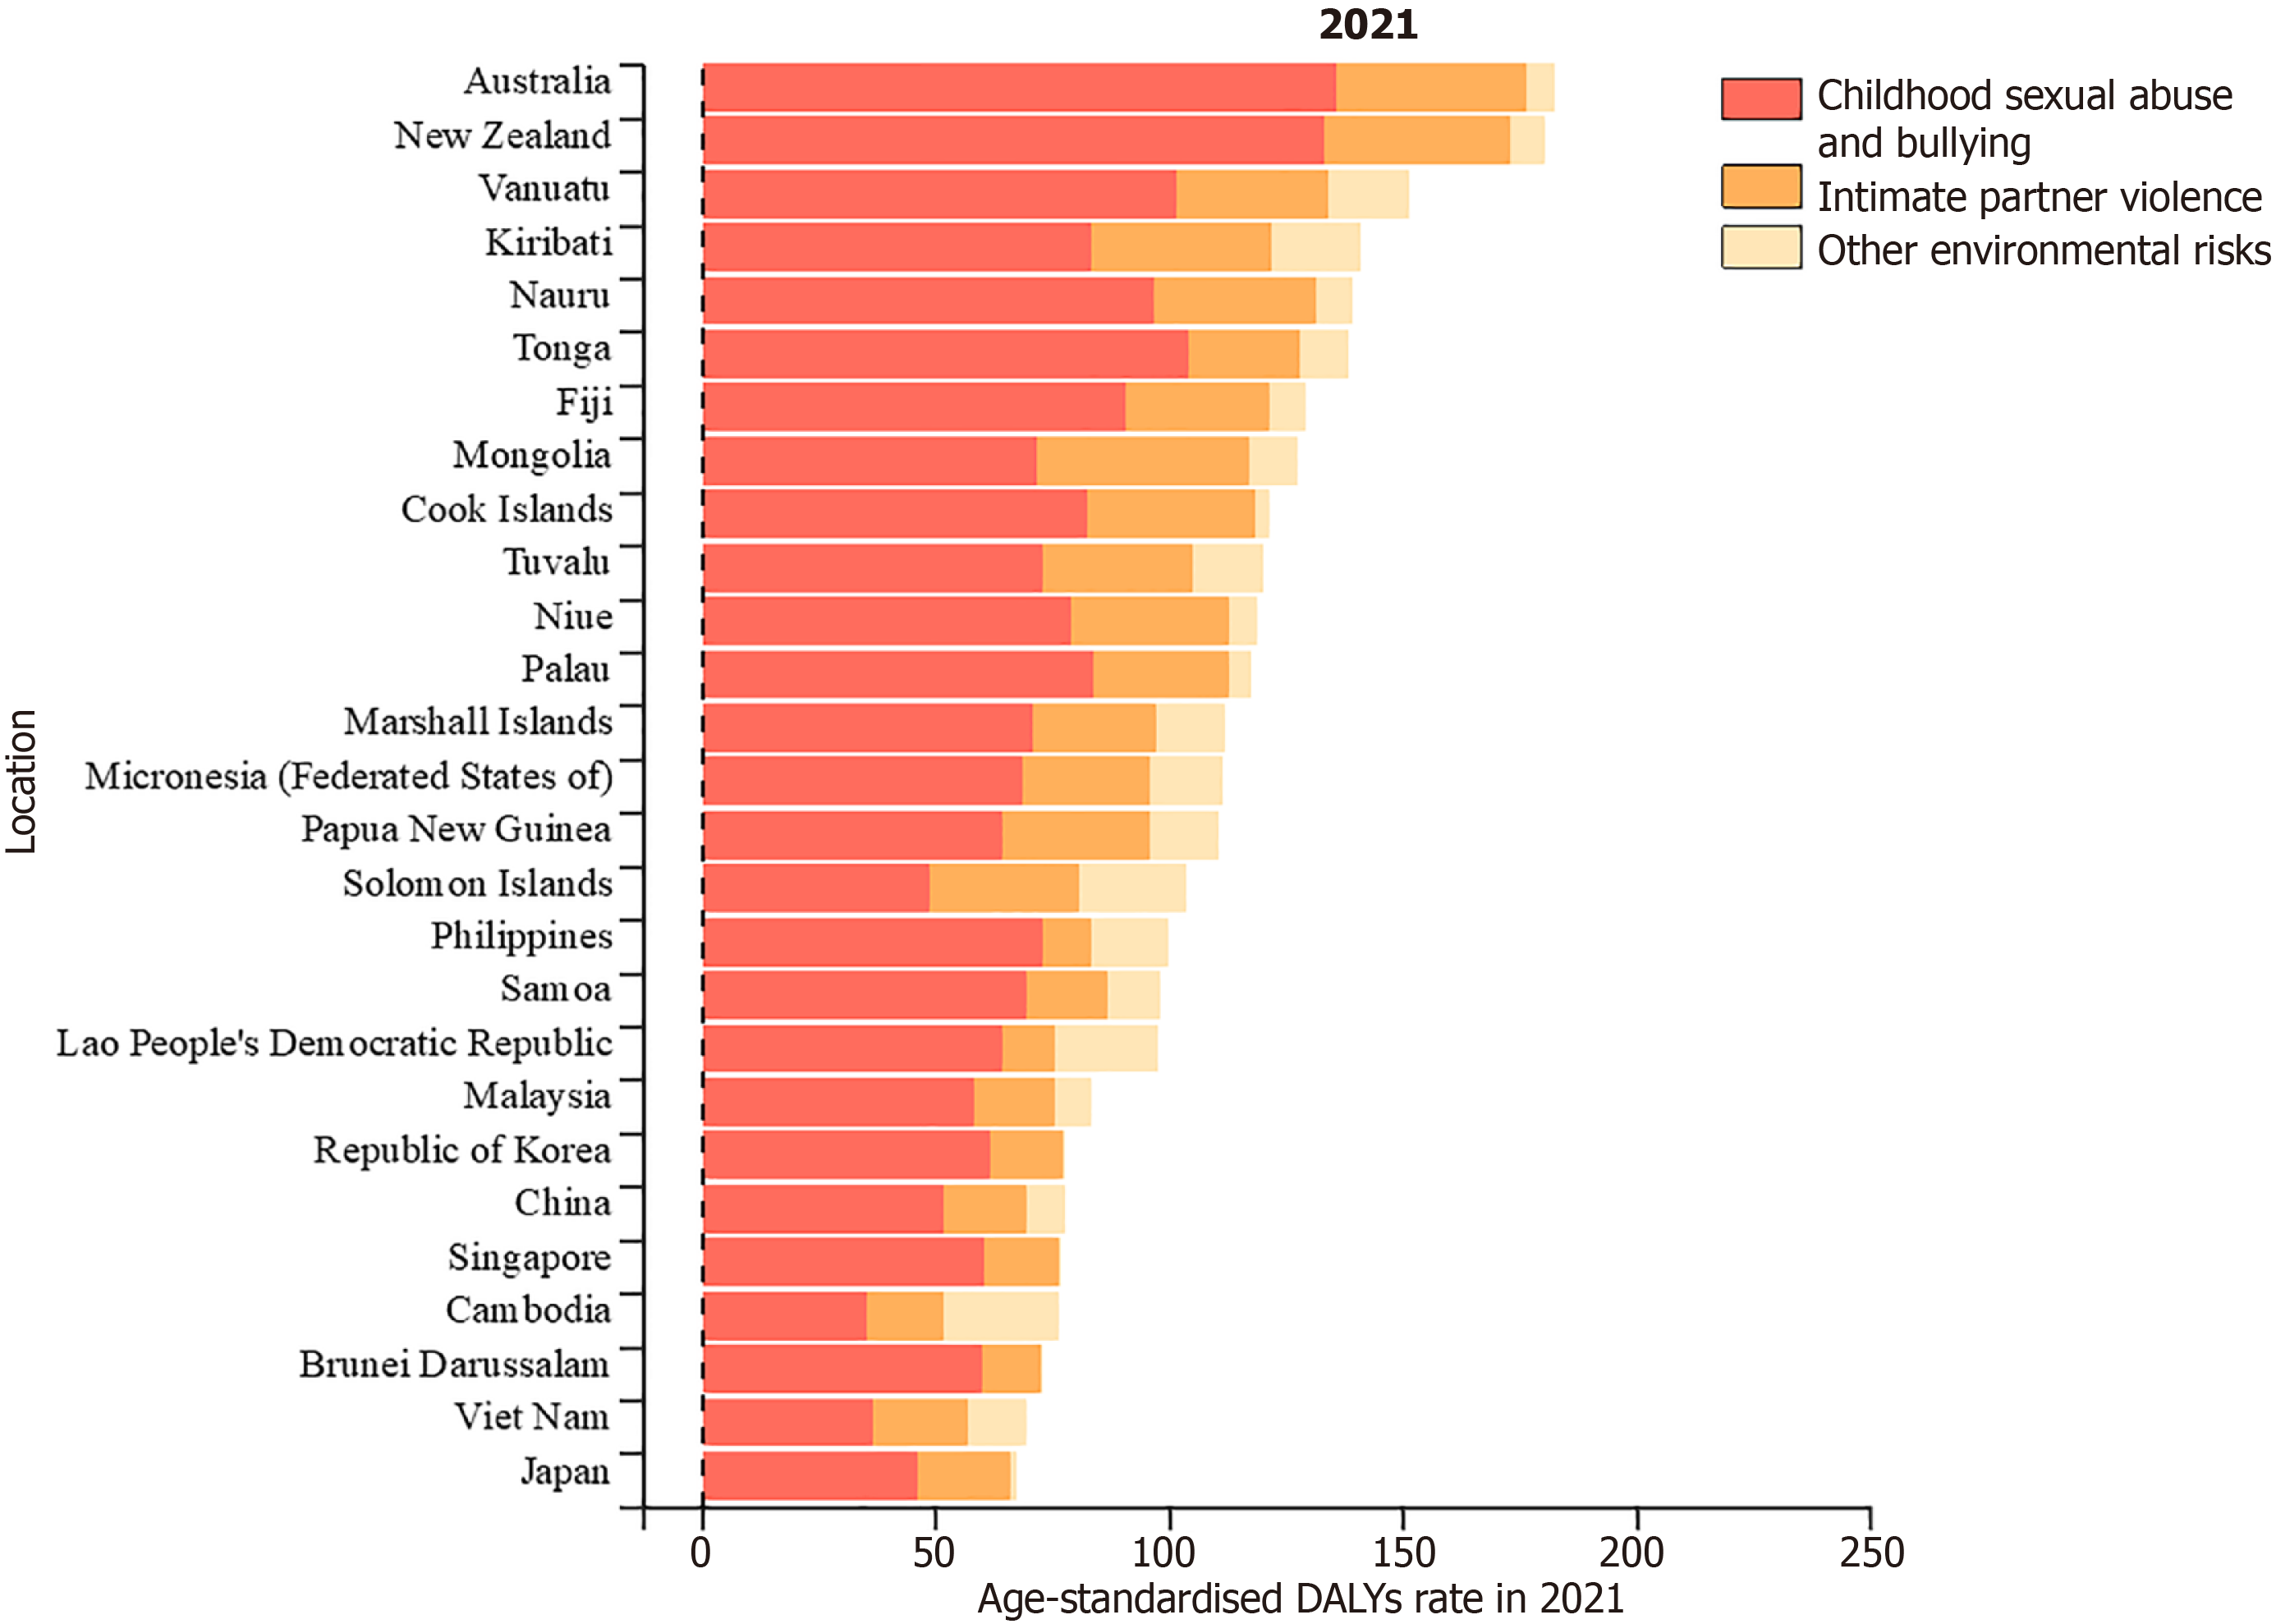
Figure 5 Distribution of age-standardised disability-adjusted life-years for mental disorders attributed to various risk factors in the Western Pacific Region in 2021.
DALYs: Disability-adjusted life-years; ASR: Age-standardised rates.
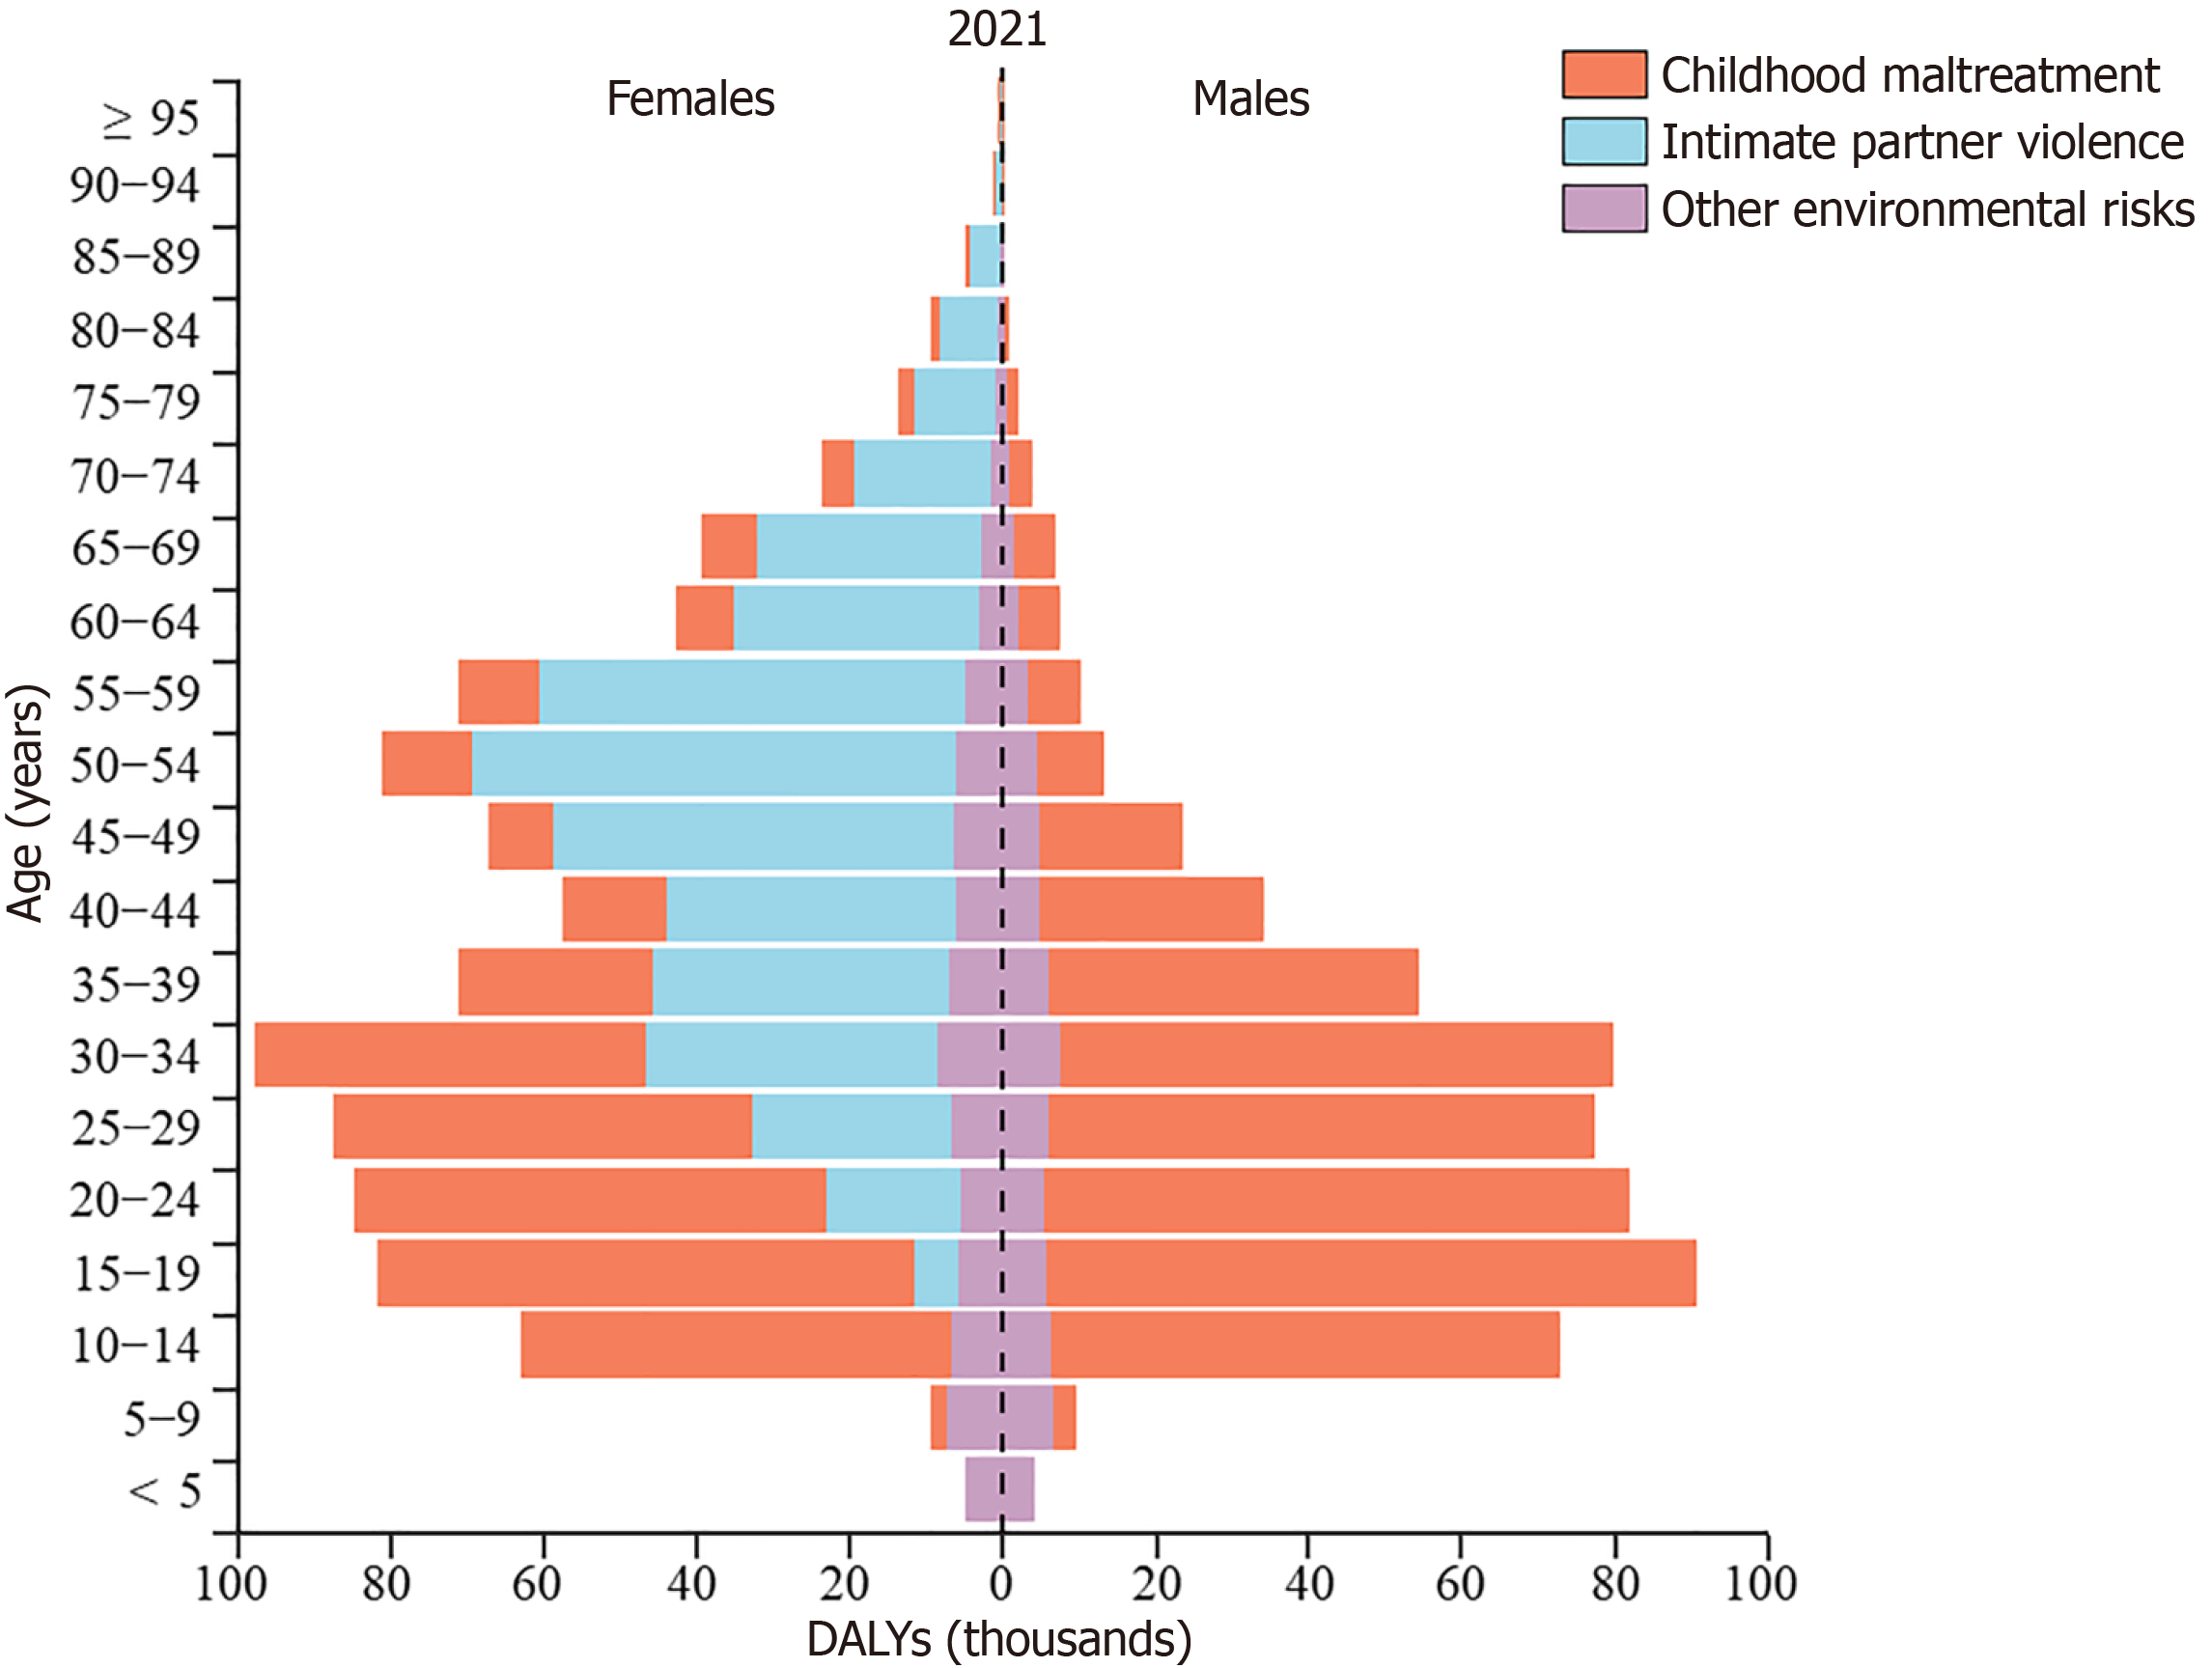
Figure 6 Distribution of disability-adjusted life-years for mental disorders attributed to various risk factors by sex and age in the Western Pacific Region in 2021.
DALYs: Disability-adjusted life-years.
- Citation: Xu YX, Niu XX, Jia WC, Wen J, Cheng XL, Han Y, Peng MH, Zhou J, Liu Y, Jiang SF, Li XP. Burden of mental disorders and risk factors in the Western Pacific region from 1990 to 2021. World J Psychiatry 2025; 15(1): 101750
- URL: https://www.wjgnet.com/2220-3206/full/v15/i1/101750.htm
- DOI: https://dx.doi.org/10.5498/wjp.v15.i1.101750


