Copyright
©The Author(s) 2024.
World J Psychiatry. Sep 19, 2024; 14(9): 1386-1396
Published online Sep 19, 2024. doi: 10.5498/wjp.v14.i9.1386
Published online Sep 19, 2024. doi: 10.5498/wjp.v14.i9.1386
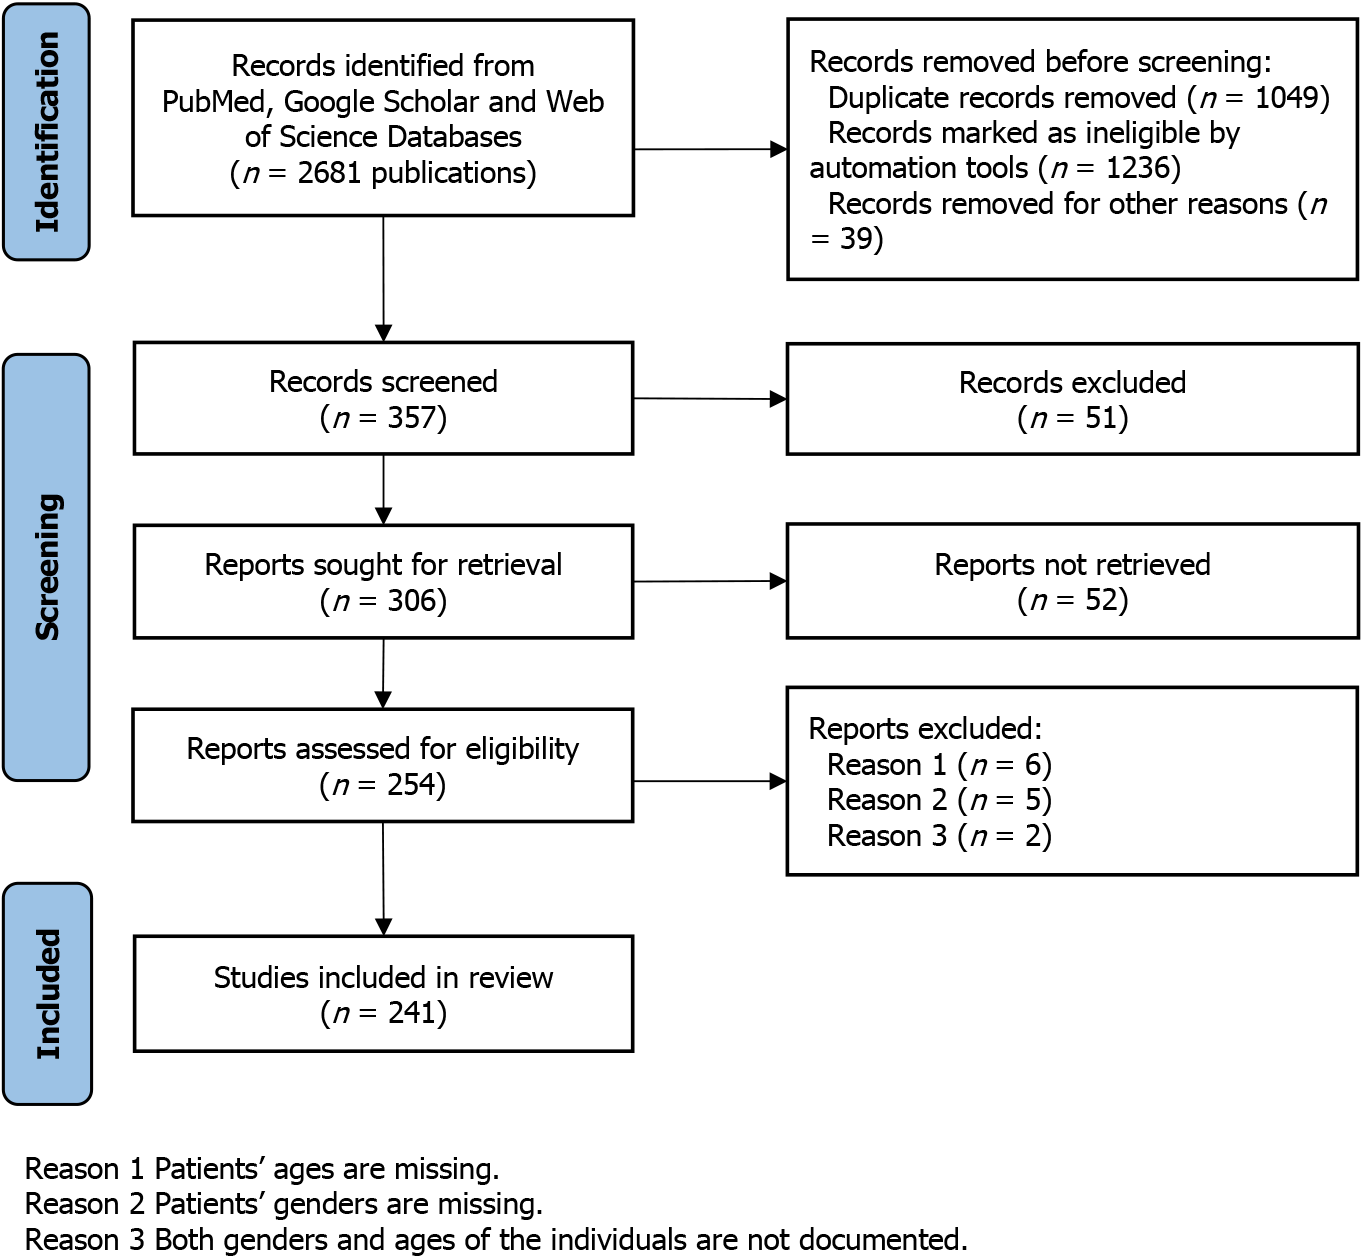
Figure 1 The PRISMA protocol diagram for musical hallucinations study selection.
A comprehensive search was conducted in the NCBI PubMed database, Google Scholar, and Web of Science to identify all available articles with key words of “music hallucination,” “musical hallucination,” “musical hallucination and mental illness,” “music hallucination and gender difference,” and “music hallucination and psychiatric disease.” Of 2681 publications were collected, 1049 of duplicate records together with those non-retrievable articles such as lack of full texts, non-English language or not related to musical hallucinations (MHs) were removed. The selected articles were further scrutinized to exclude those with some essential categories missing (as indicated as reason 1-3), and 241 MH publications were assembled to form the data pool for this study.
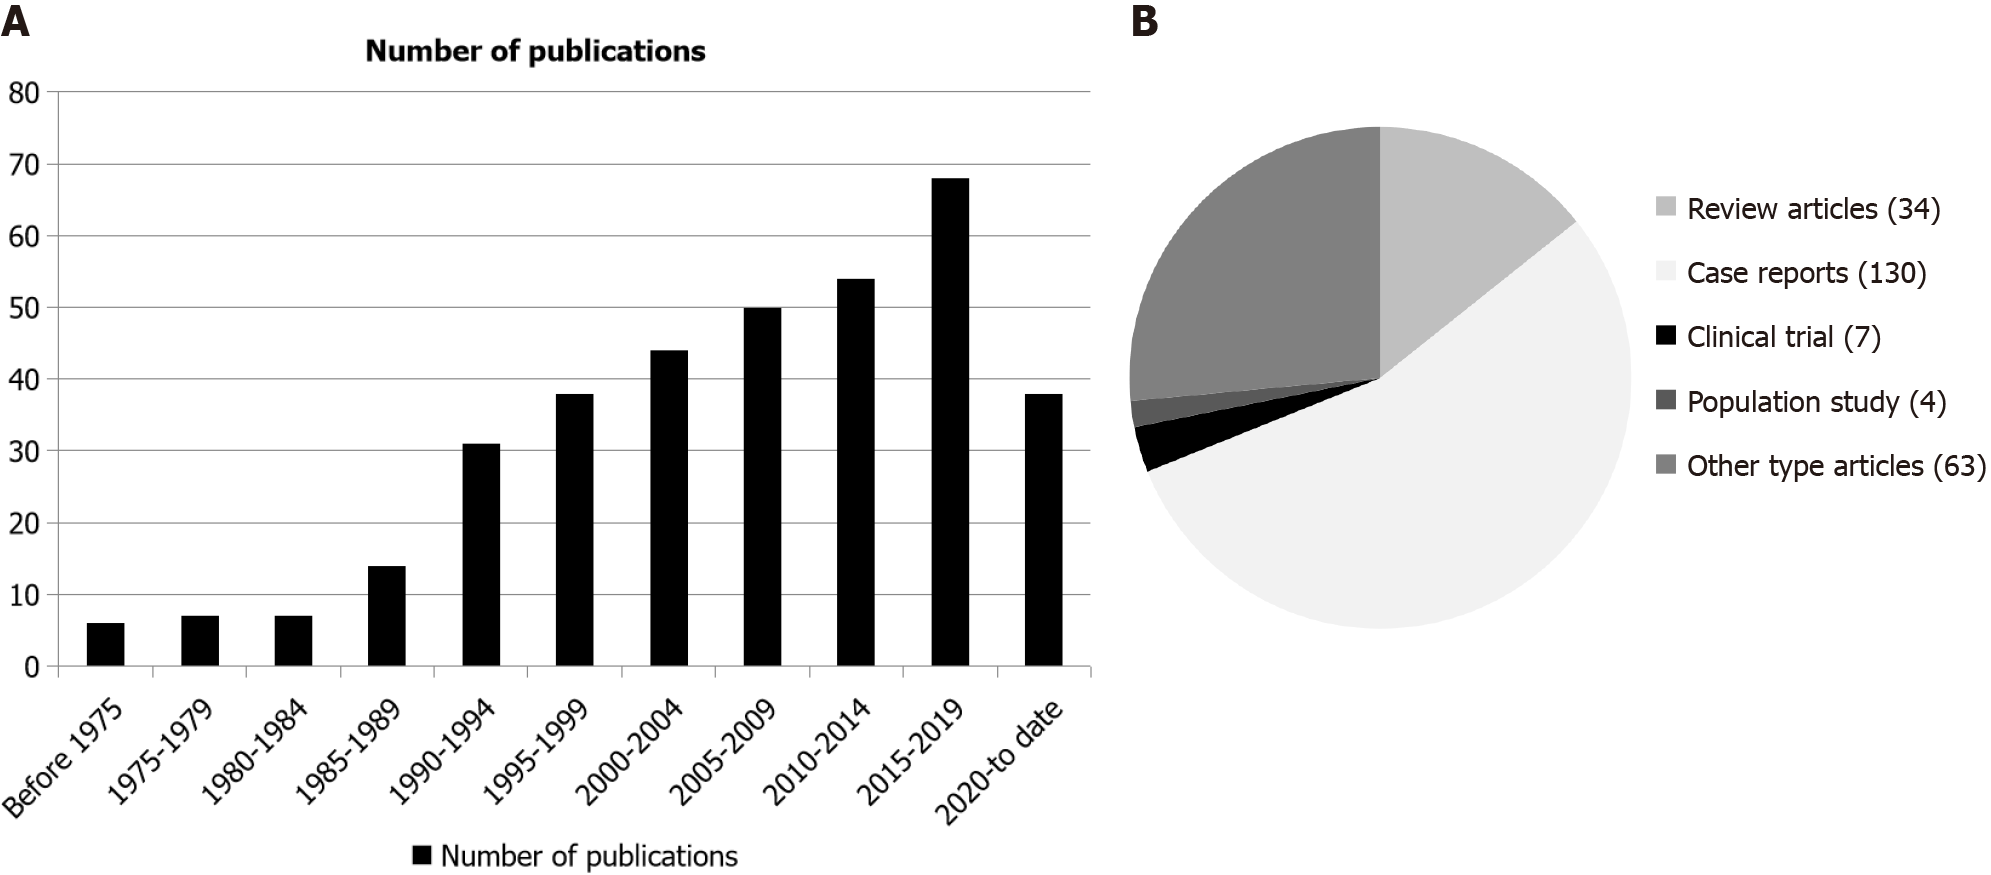
Figure 2 Summary and classification of the publications on musical hallucinations.
A: Summary of the publications on musical hallucinations (MHs); The earliest article pertaining to MH was published in 1958. Only 20 articles were identified in connection to MH from 1958 to the end of 1984. As interest in MH grew, more research emerged. From 1990 to end of 1994, there were 31 publications on MH, and this number doubled during the 5-year period from 2015 to the end of 2019; B: Classification of MH-related publications. This pie chart illustrates the classification of the total 238 publications which were selected in this study. These articles can be classified into 5 different classes. The numbers in parentheses represent the total articles of each class.
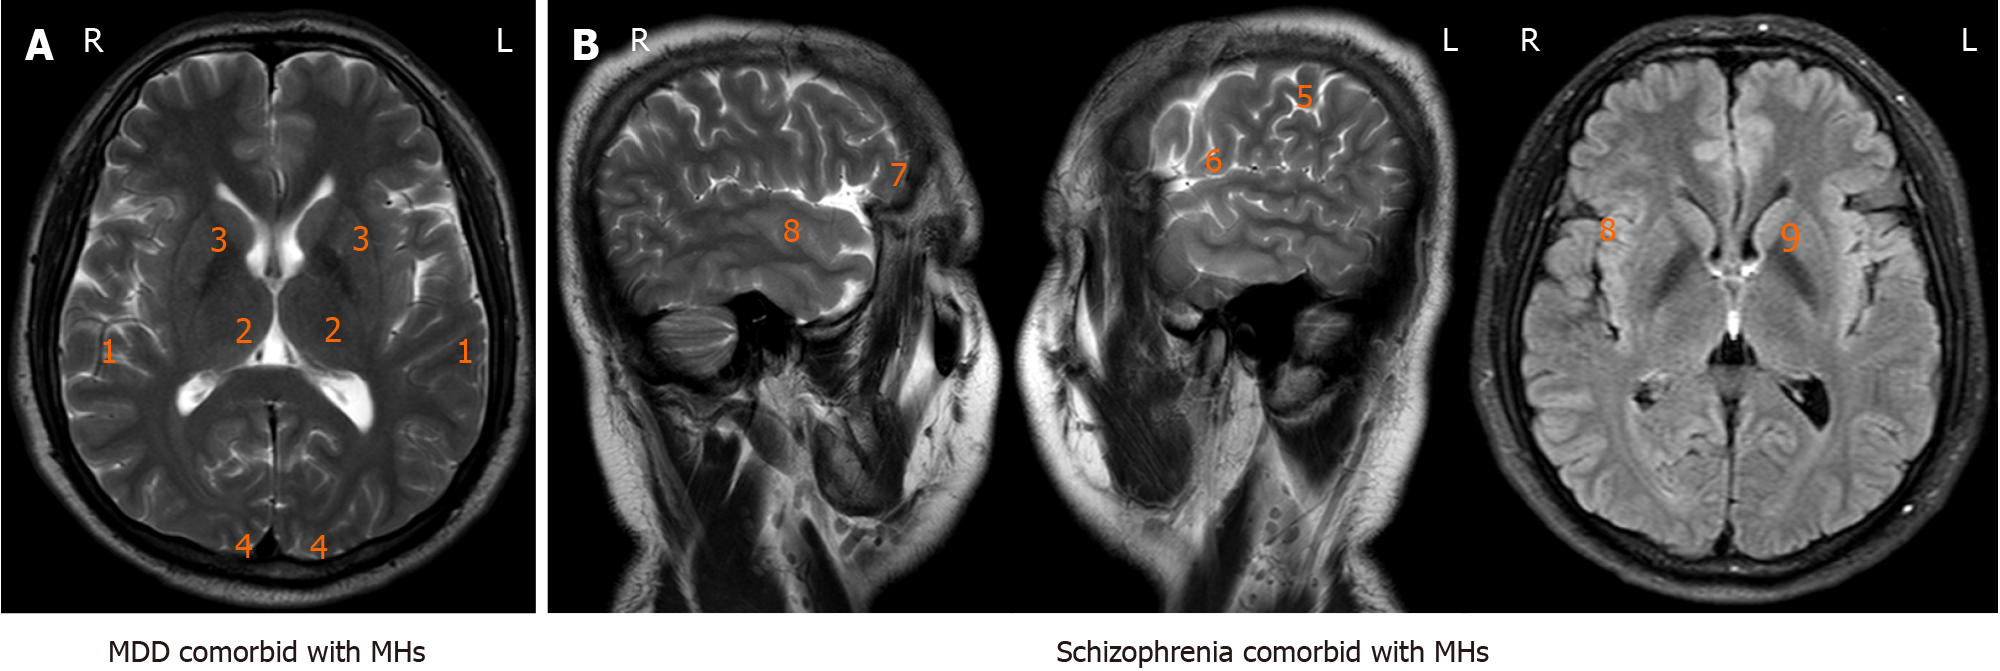
Figure 3 Schematic display of neurological regions increased activation in association with musical hallucinations and psychiatry diseases.
Standardized magnetic resonance imaging (MRI) on contrast enhanced T1-weighted axial image the brain viewed from the side, sagittal (left and right); back, coronal (middle); and above axial (right). Specific cortical regions and subcortical structures are labeled. The MRI image was offered by the Department of Radiology and Biomedical Imaging, Shanxi Bethune Hospital, Shanxi Academy of Medical Sciences. A: Represents the active brain area in the individuals of major depressive disorder comorbid with musical hallucinations (MH); B: Represents the active brain area in the individuals of schizophrenia comorbid with MH. 1Superior temporal cortex; 2Thalamus; 3Basal ganglia; 4Parasagittal occipital cortex; 5Inferior and middle frontal gyri; 6Left dorsolateral, prefrontal cortex; 7Right orbitofrontal cortex, and right middle temporal gyrus; 8Right auditory associated cortex and striatal regions; 9Left caudate head. MDD: Major depressive disorder; MHs: Musical hallucinations; L: Left; R: Right.
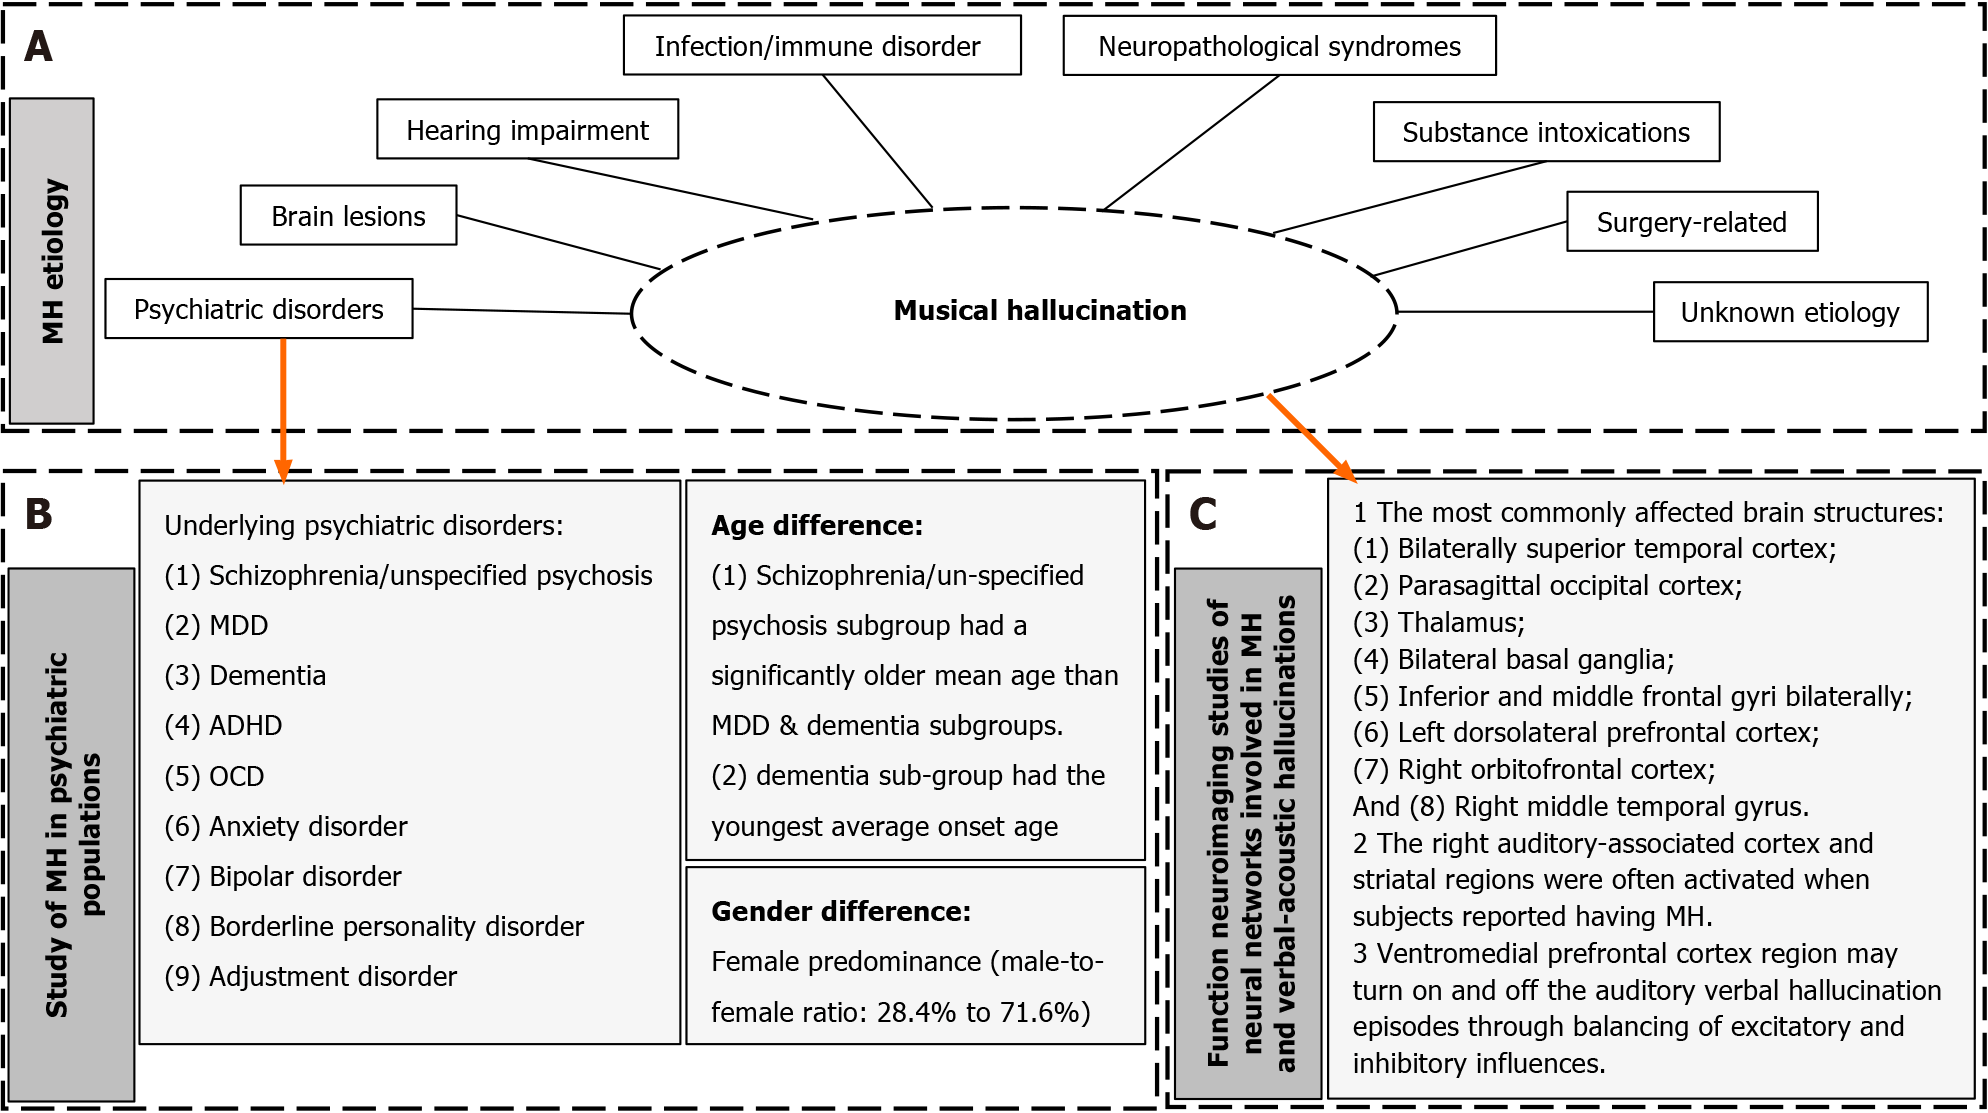
Figure 4 Summary of the classification of musical hallucinations, the characters of musical hallucinations in psychiatric disorders, and highlight of shared and distinct mechanisms of musical and verbal-acoustic hallucinations in the field.
A: Summaries the eight new classes of musical hallucinations (MHs) based on their etiological mechanisms; B: Represents the varying psychiatric diagnoses comorbid with MHs, the age difference and the gender difference in this category of the MH; C: Shows the up-to-date neuroimaging studies of brain regions and neural networks that most commonly affect MH. MH: Musical hallucinations; MDD: Major depressive disorder; ADHD: Attention deficit hyperactivity disorder; OCD: Obsessive-compulsive disorder.
- Citation: Lian X, Song W, Si TM, Lian NZ. Classification of musical hallucinations and the characters along with neural-molecular mechanisms of musical hallucinations associated with psychiatric disorders. World J Psychiatry 2024; 14(9): 1386-1396
- URL: https://www.wjgnet.com/2220-3206/full/v14/i9/1386.htm
- DOI: https://dx.doi.org/10.5498/wjp.v14.i9.1386


