Copyright
©The Author(s) 2024.
World J Psychiatry. Jul 19, 2024; 14(7): 1127-1139
Published online Jul 19, 2024. doi: 10.5498/wjp.v14.i7.1127
Published online Jul 19, 2024. doi: 10.5498/wjp.v14.i7.1127
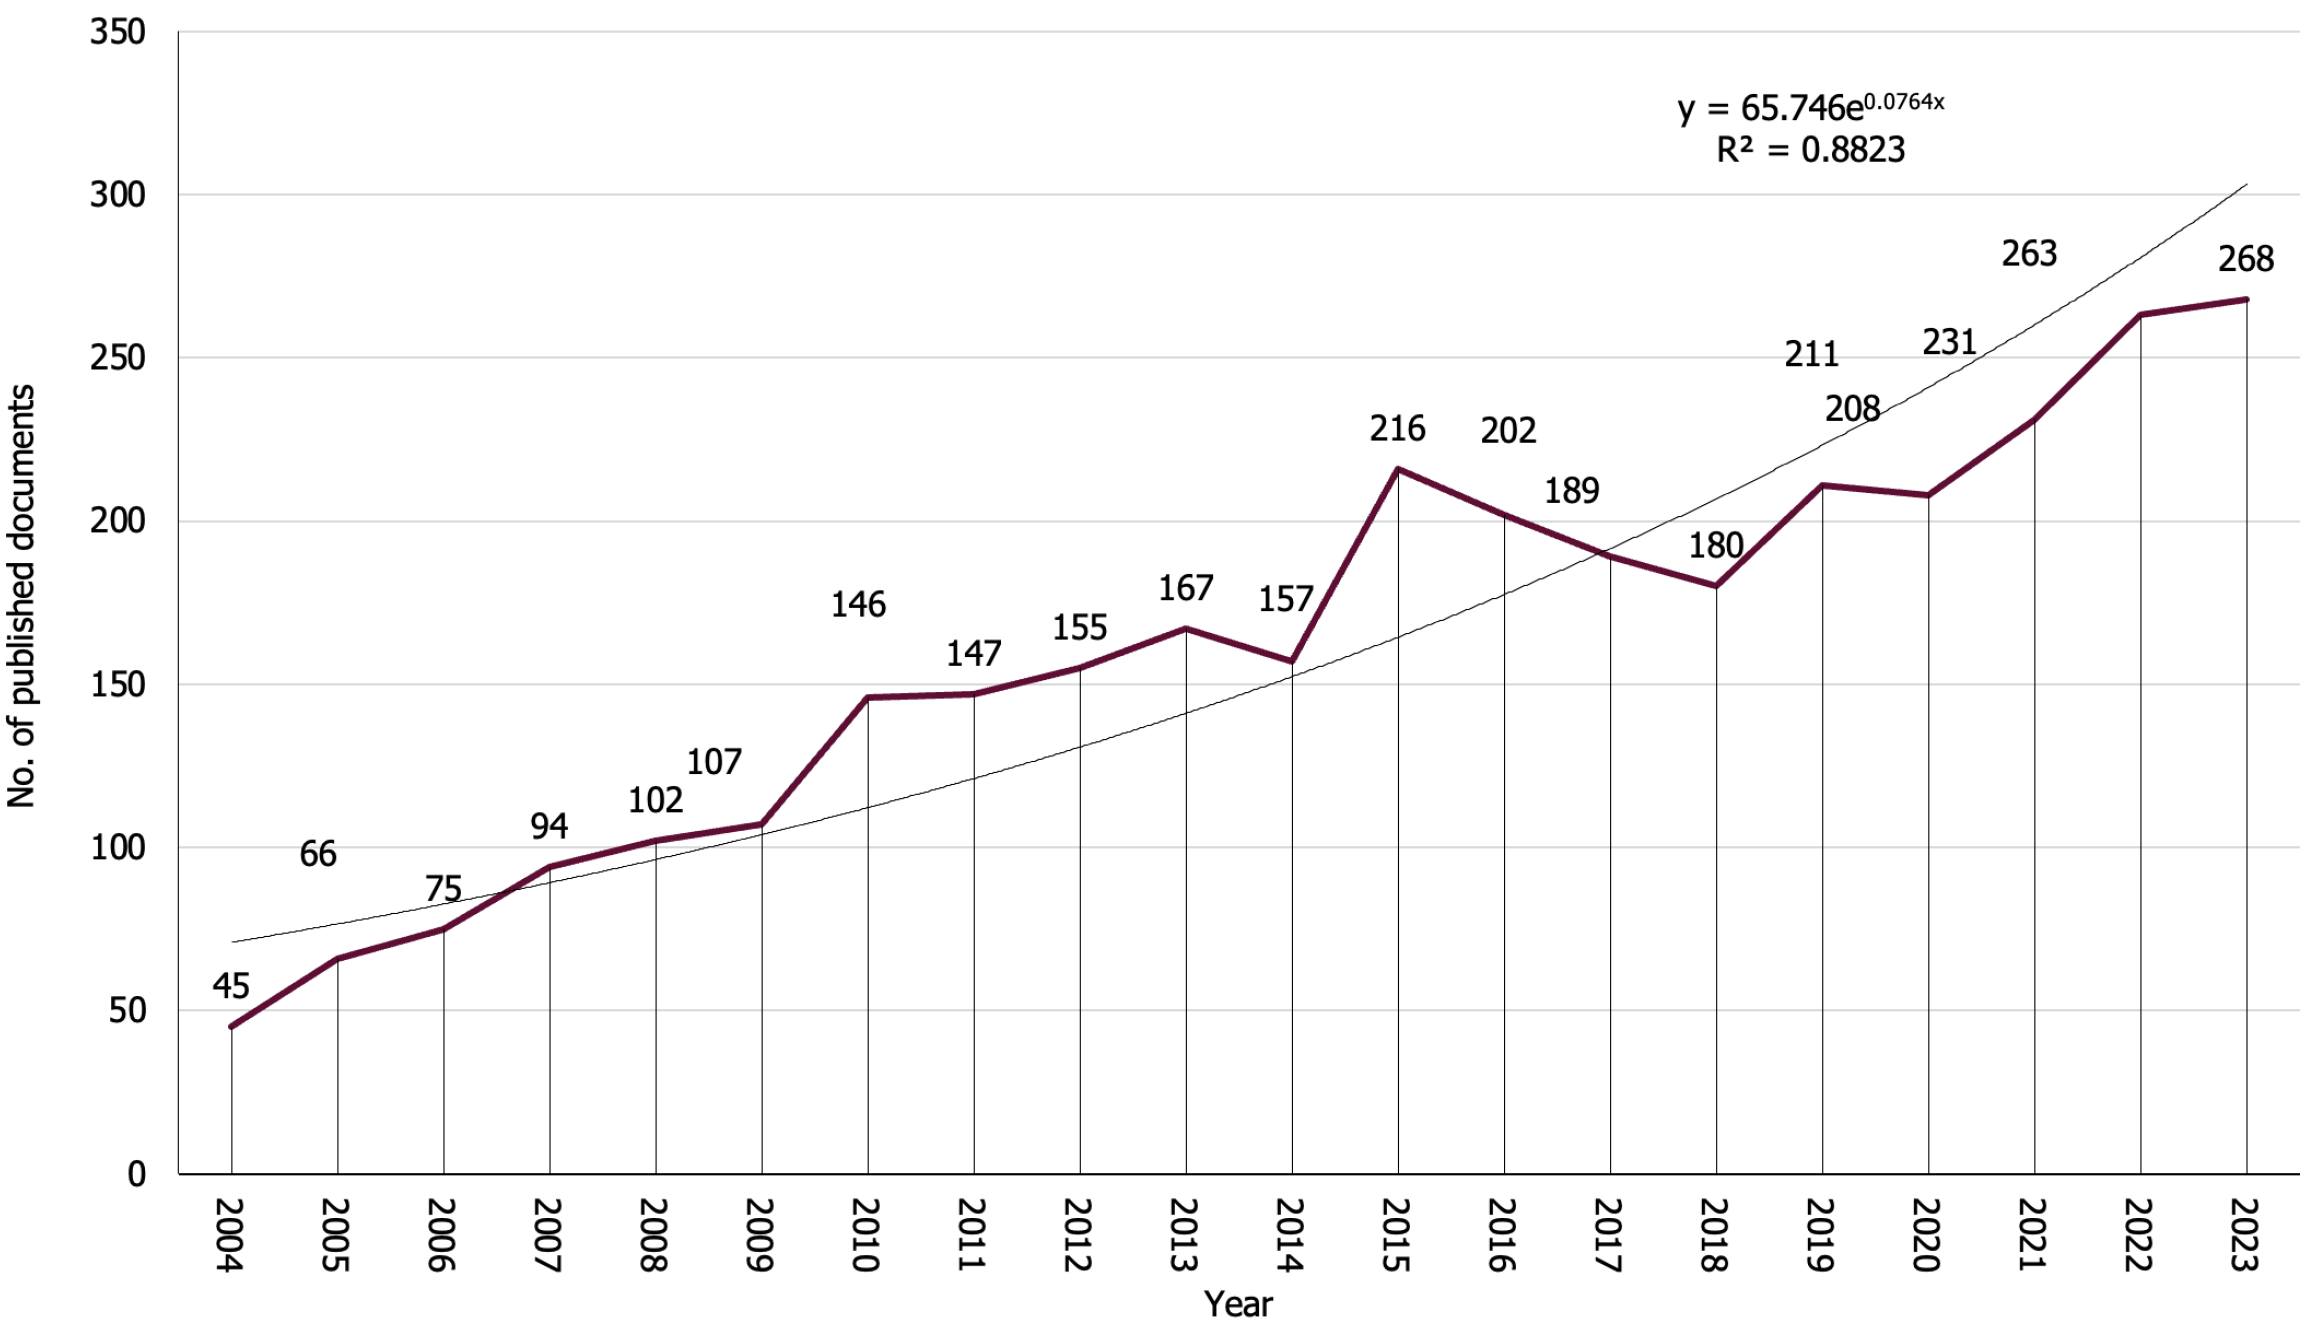
Figure 1 Annual growth of publications on the link between diabetes mellitus and depression.
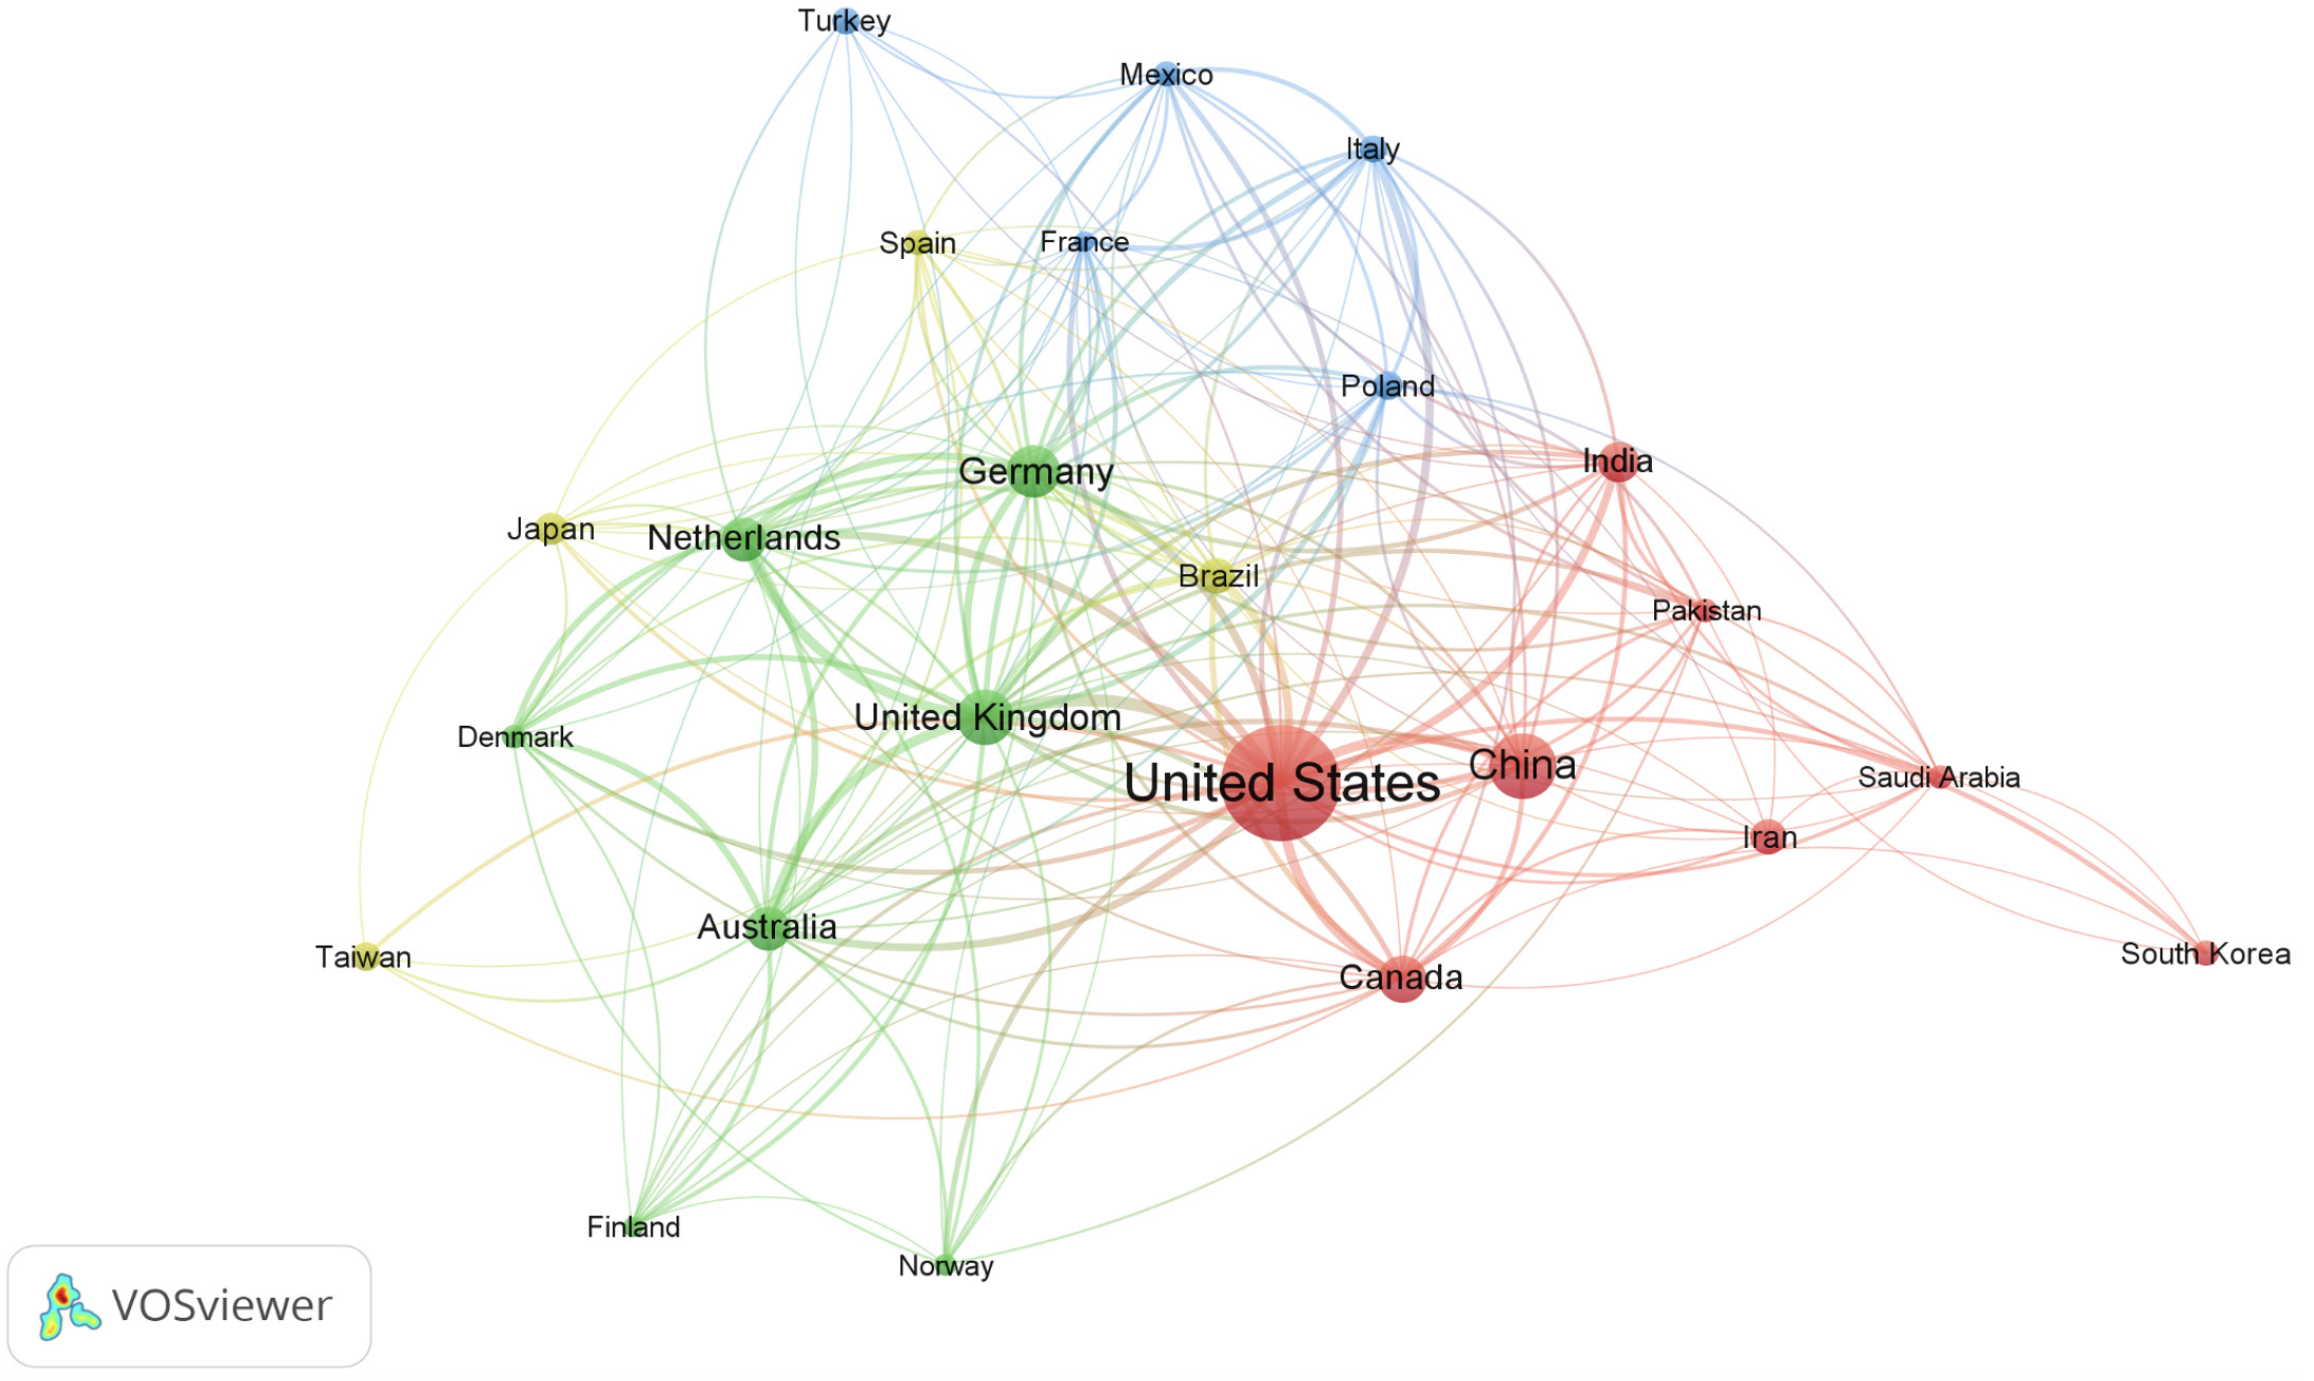
Figure 2 Mapping of international research collaborations on diabetes mellitus and depression from 2004 to 2023.
Connections are highlighted with a minimum of 30 publications per country. Out of 160 active countries, 24 exceeded this threshold, with the node size reflecting the number of publications. The data were visualized using VOSviewer software version 1.6.20.
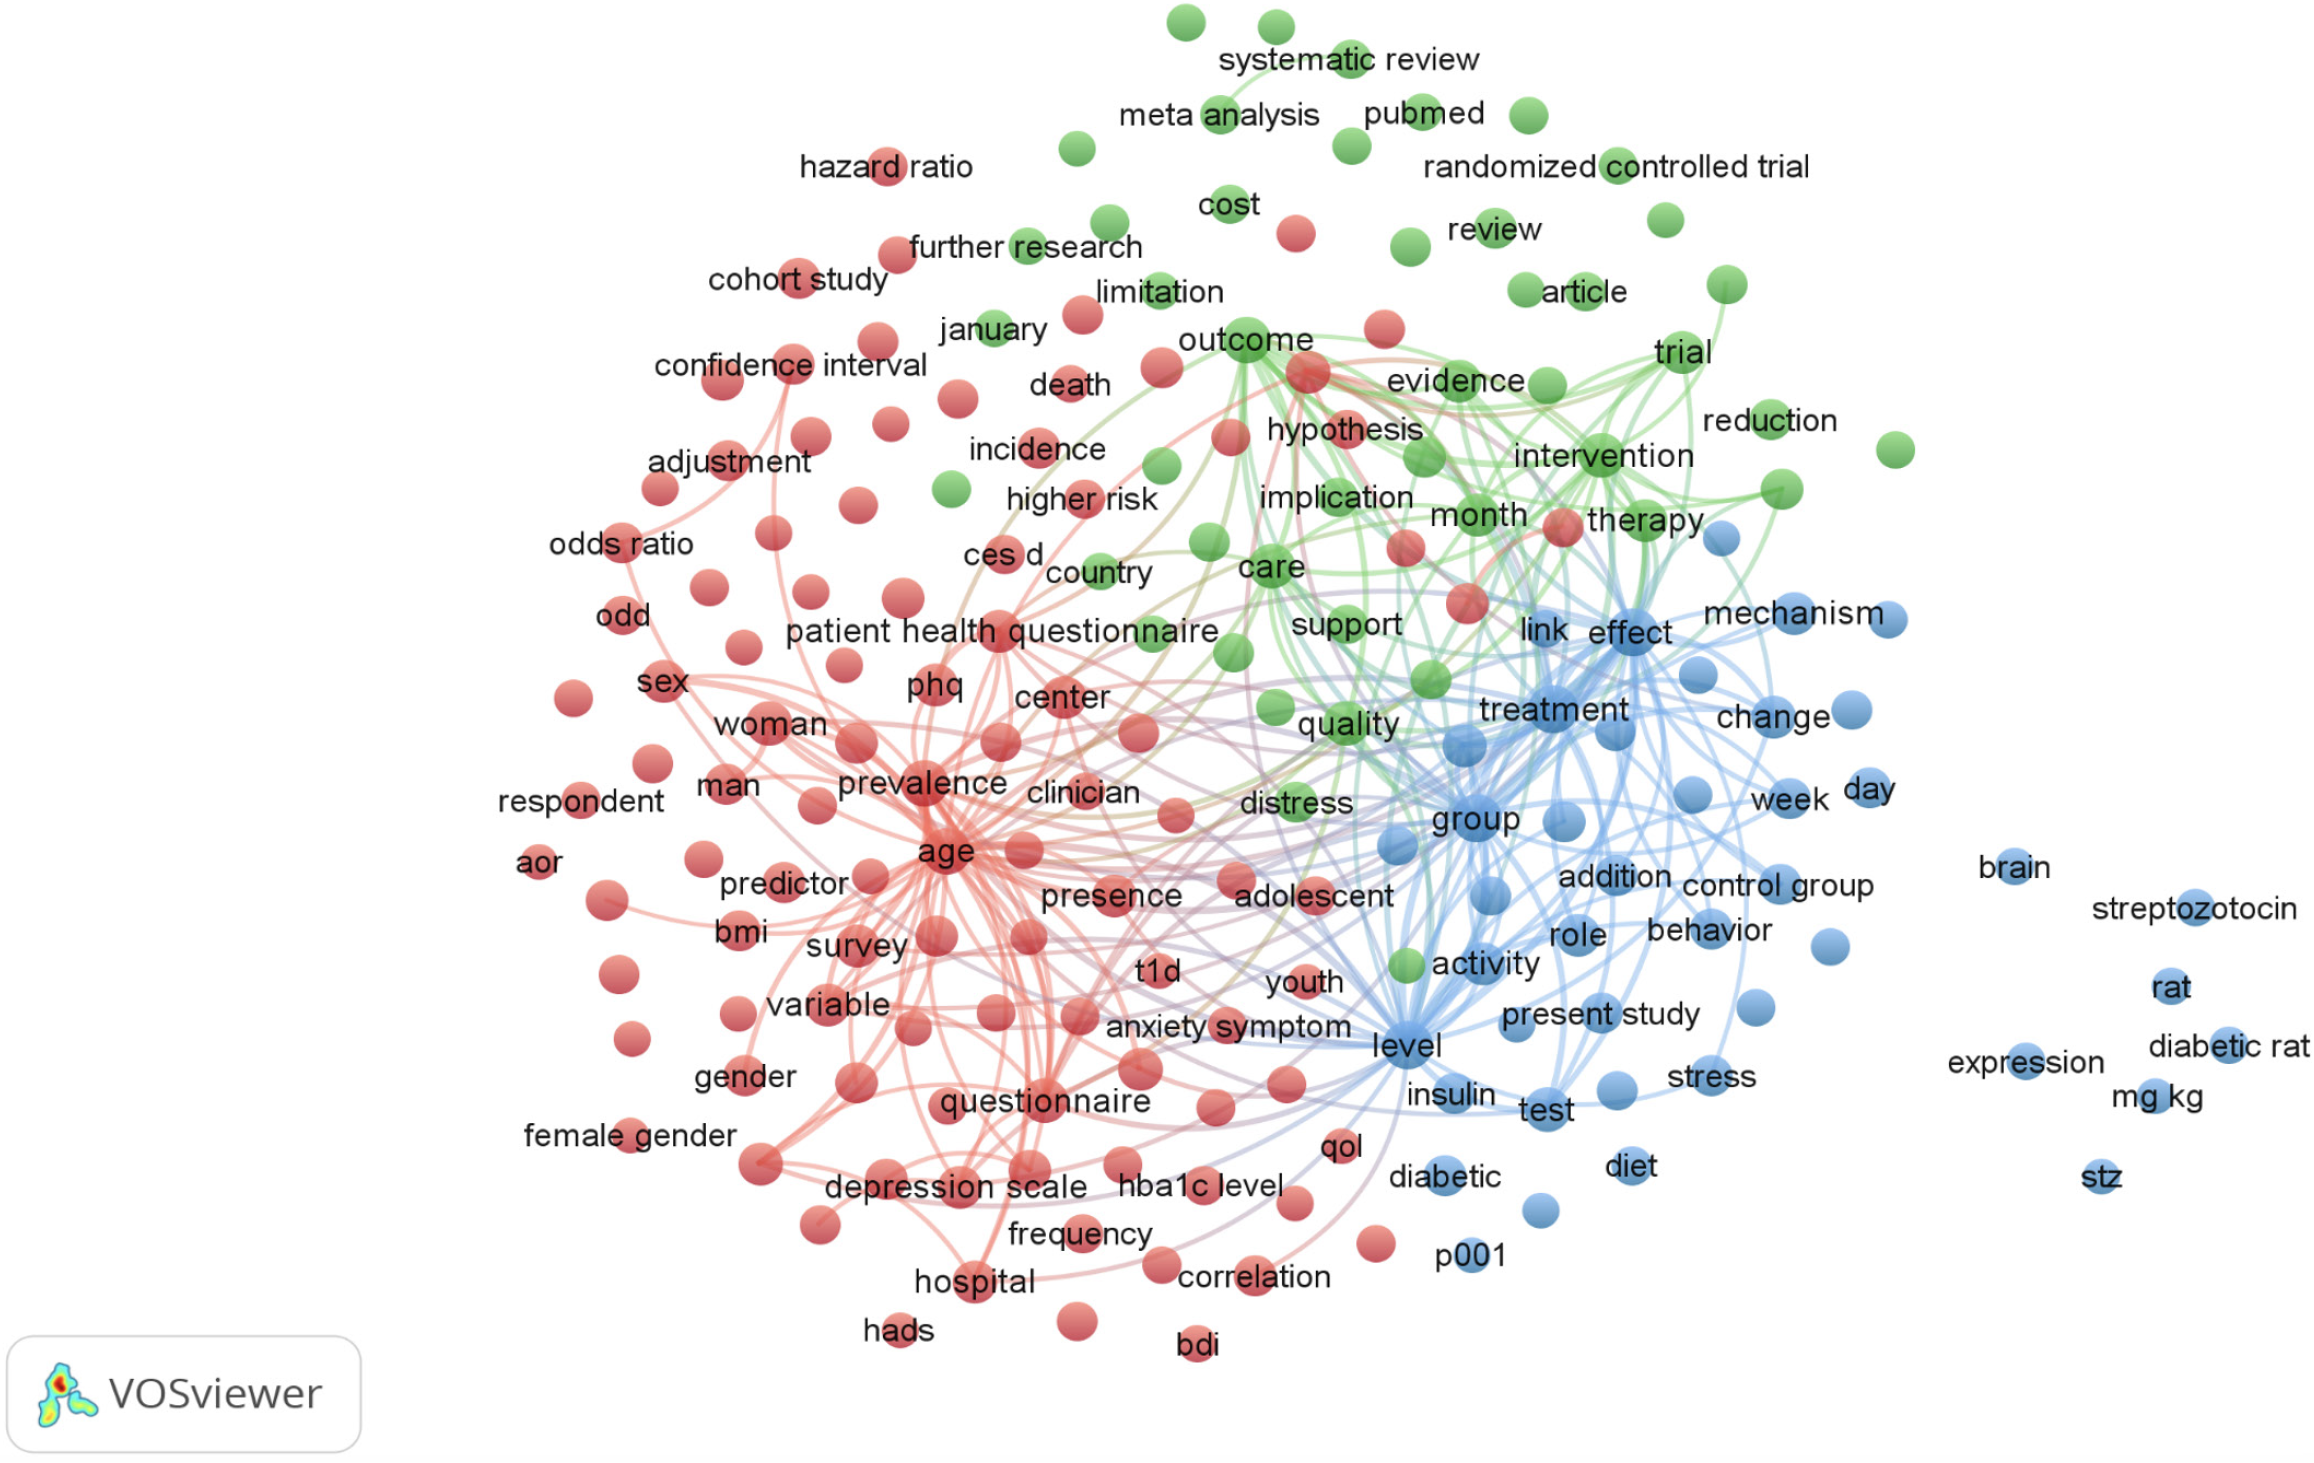
Figure 3 Mapping frequent terms in titles and abstracts to identify research themes in the field of diabetes mellitus and depression.
Generated using VOSviewer software version 1.6.20, the map highlights 311 terms identified with a minimum-term occurrence threshold of 50 out of a total of 40 626 terms in the diabetes mellitus and depression domain. The terms are organized into three distinct clusters, each represented by a unique color, and the node size reflects the frequency of term usage across various publications.
- Citation: Al-Jabi SW. Emerging global interest: Unraveling the link between diabetes mellitus and depression. World J Psychiatry 2024; 14(7): 1127-1139
- URL: https://www.wjgnet.com/2220-3206/full/v14/i7/1127.htm
- DOI: https://dx.doi.org/10.5498/wjp.v14.i7.1127


