Copyright
©The Author(s) 2024.
World J Psychiatry. Jul 19, 2024; 14(7): 1080-1086
Published online Jul 19, 2024. doi: 10.5498/wjp.v14.i7.1080
Published online Jul 19, 2024. doi: 10.5498/wjp.v14.i7.1080
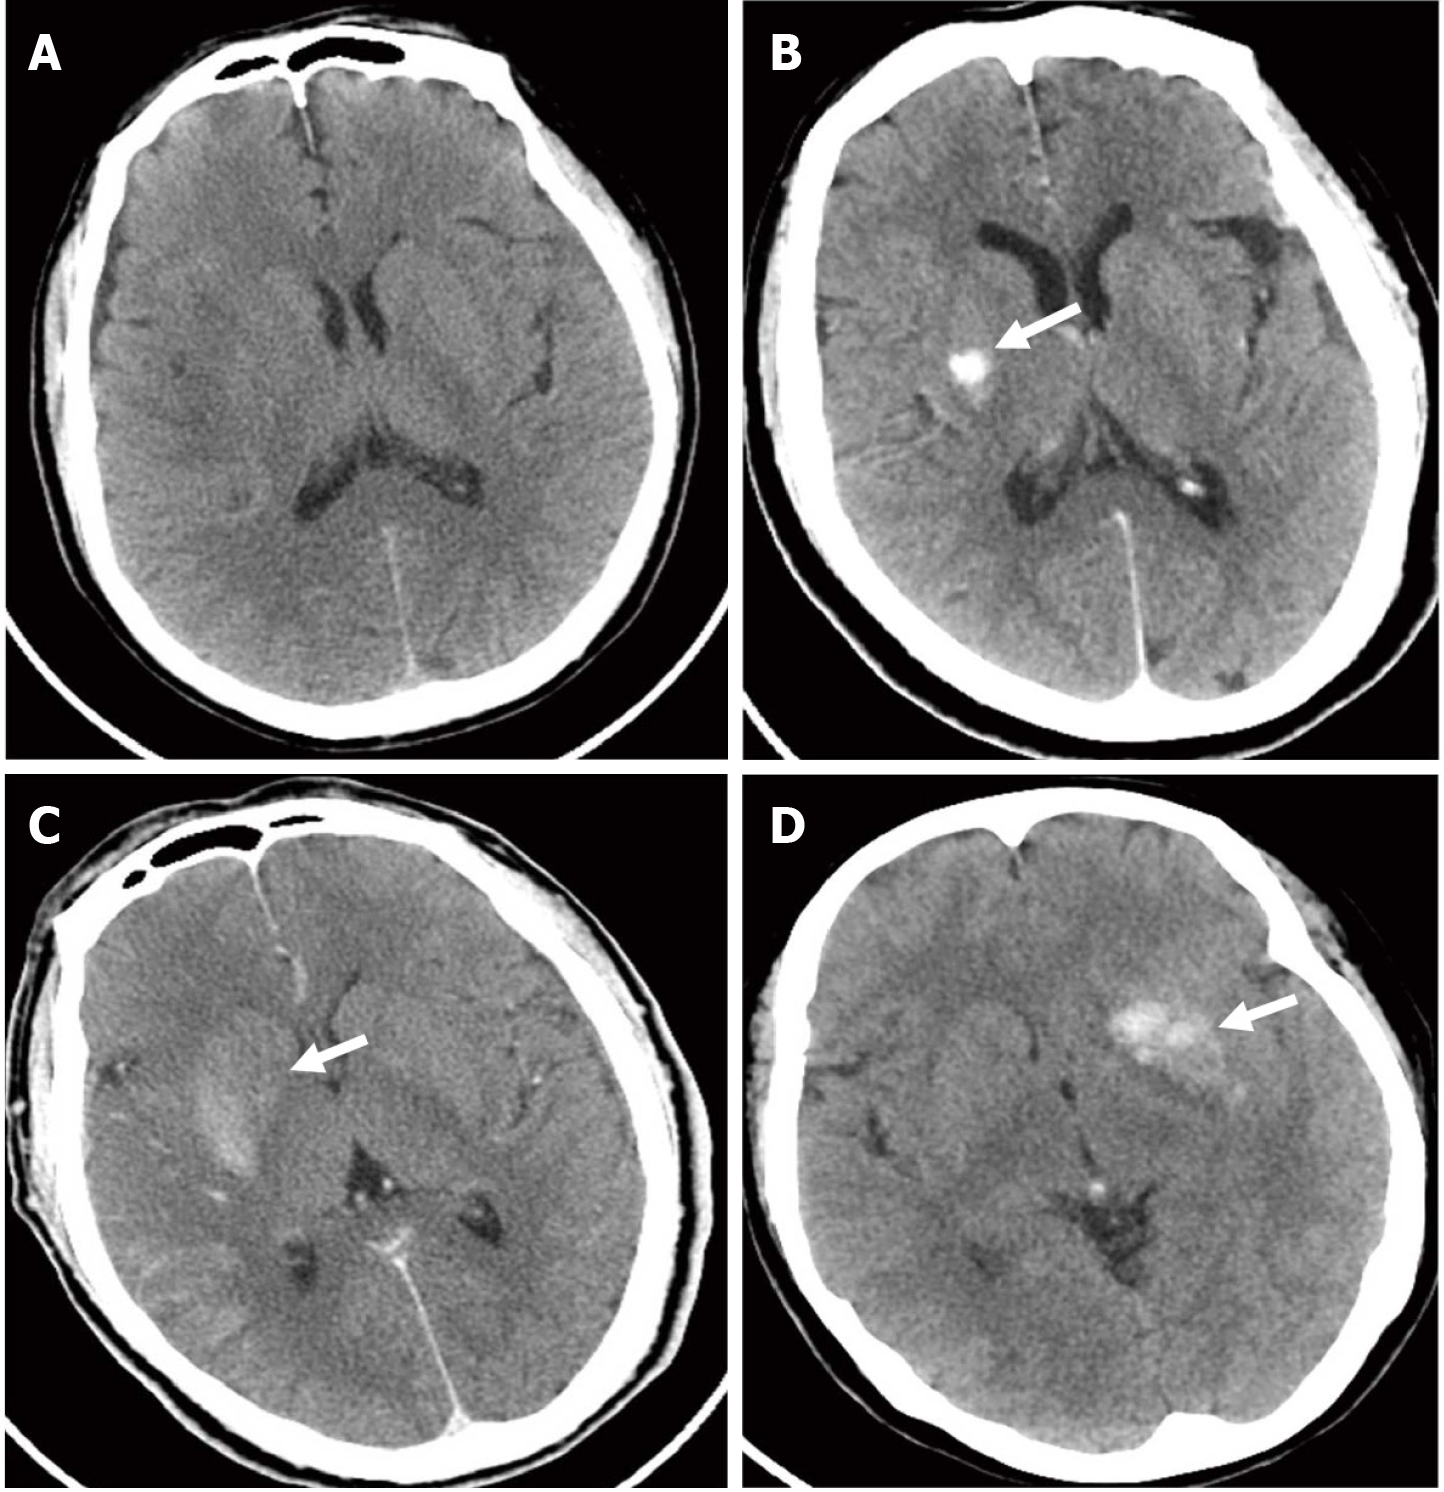
Figure 1 Computed tomography images of non-intracranial high-density areas and high-density areas.
A: Computed tomography (CT) image post-endovascular mechanical thrombectomy (EMT) shows no high-density areas (HDAs) in a patient with an admission National Institutes of Health Stroke Scale (NIHSS) of 15 and 3 month modified Rankin Scale (mRS) of 0; B: CT image post-EMT shows right basilar ganglia HDA in a patient with an admission NIHSS of 16 and 3 month mRS of 0; C: CT image post-EMT shows right basilar ganglia and cortical HDAs in a patient with an admission NIHSS of 24 and 3 month mRS of 6; D: CT image post-EMT shows left basilar ganglia HDA in a patient with an admission NIHSS of 25 and 3 month mRS of 6.
- Citation: Lu ZJ, Lai JX, Huang JR, Xie SH, Lai ZH. Predictive value of intracranial high-density areas in neurological function. World J Psychiatry 2024; 14(7): 1080-1086
- URL: https://www.wjgnet.com/2220-3206/full/v14/i7/1080.htm
- DOI: https://dx.doi.org/10.5498/wjp.v14.i7.1080


