Copyright
©The Author(s) 2024.
World J Psychiatry. May 19, 2024; 14(5): 742-759
Published online May 19, 2024. doi: 10.5498/wjp.v14.i5.742
Published online May 19, 2024. doi: 10.5498/wjp.v14.i5.742
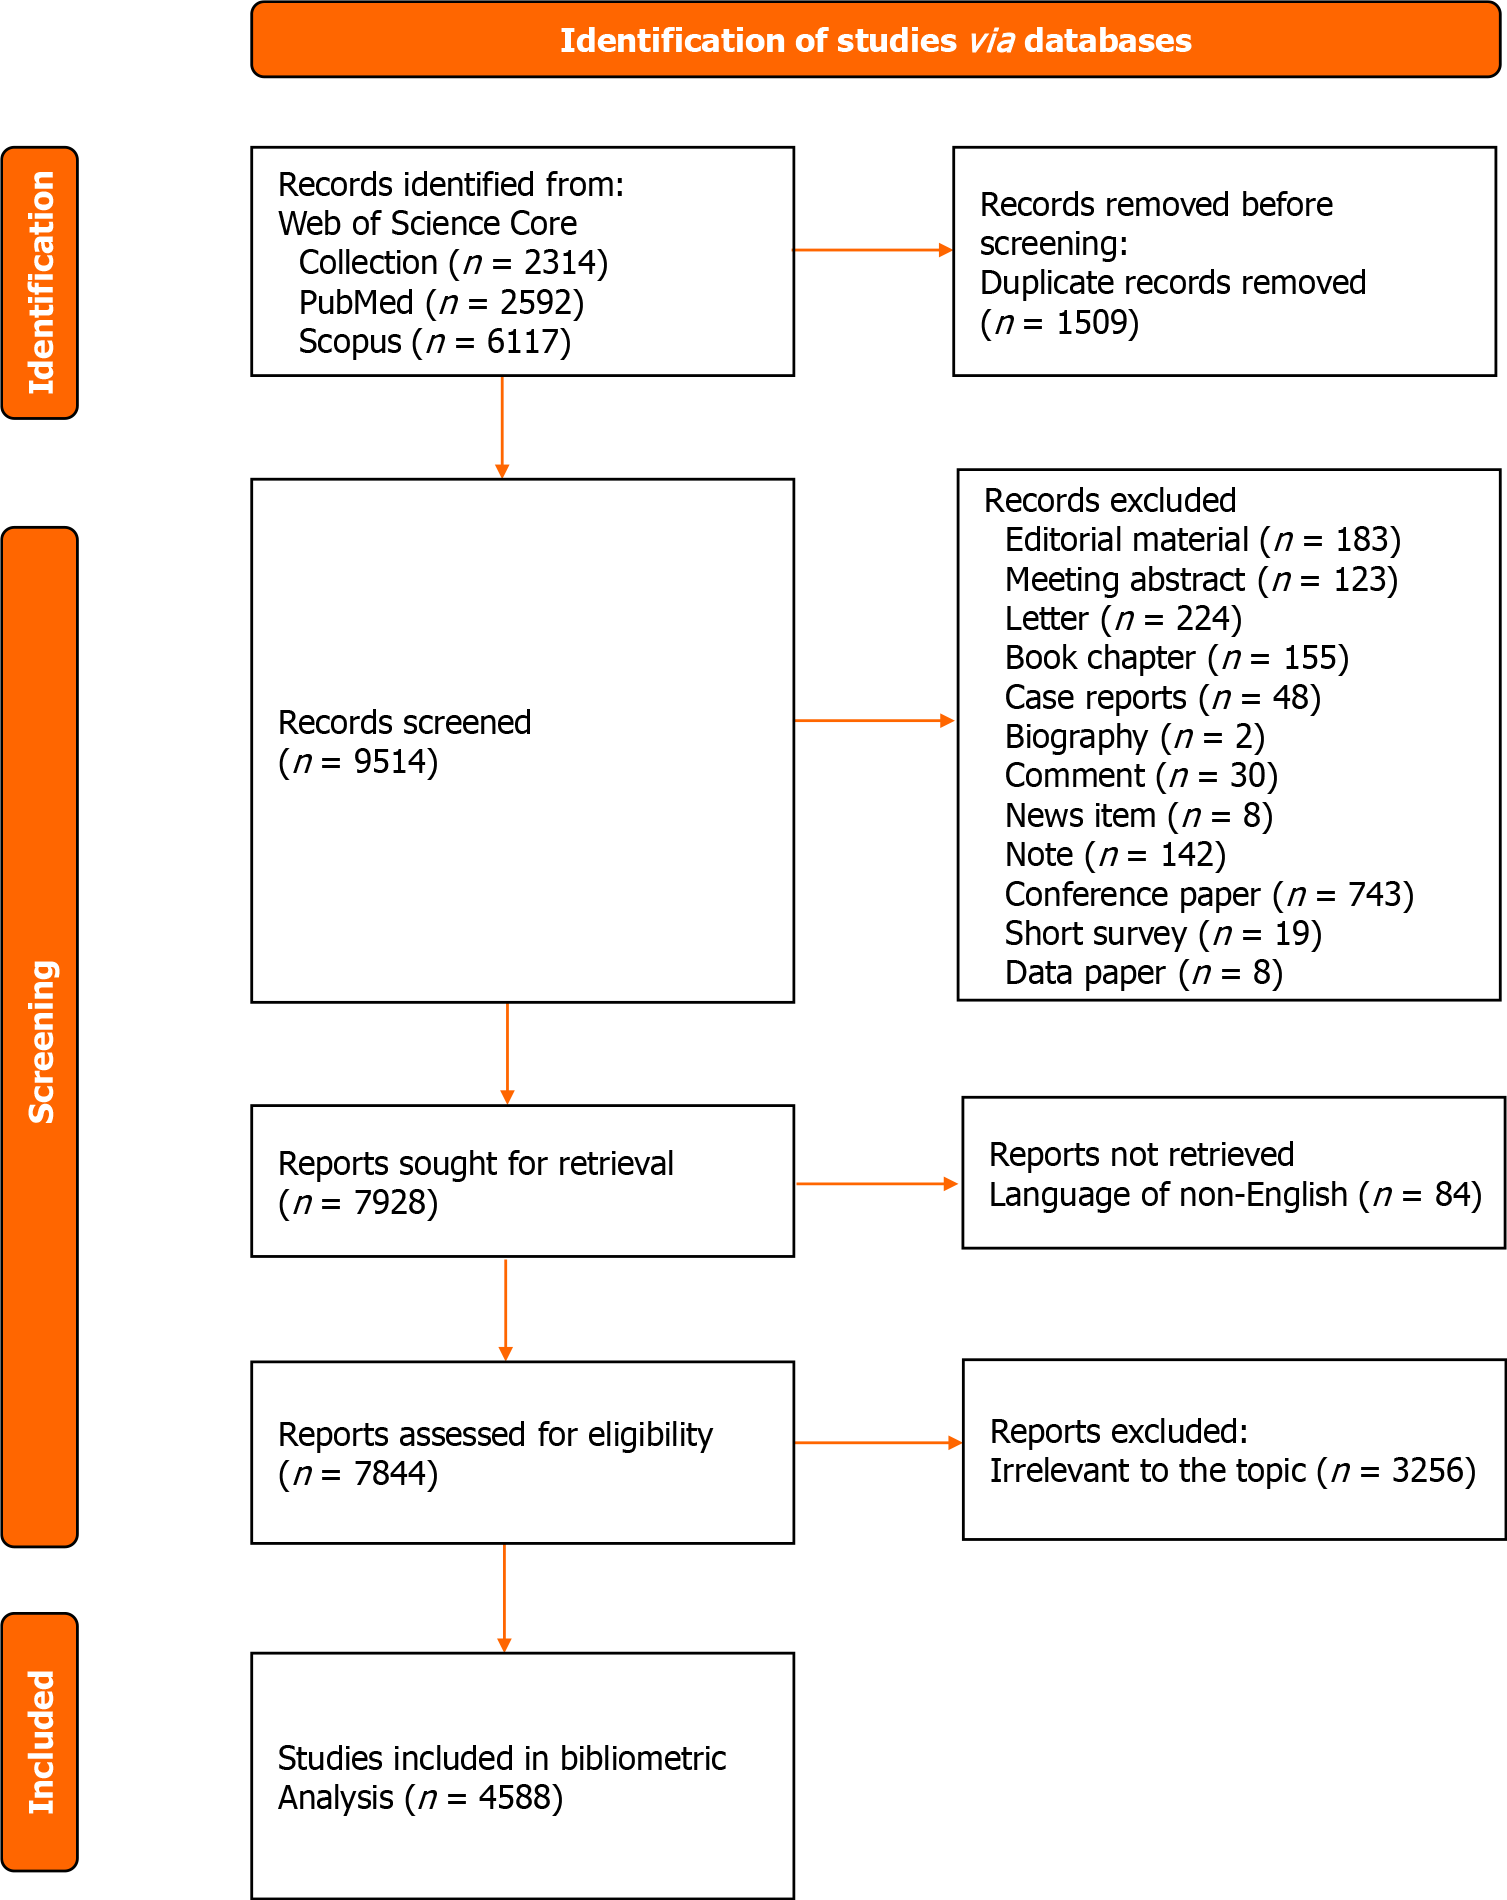
Figure 1 PRISMA flowchart of the data analysis for the current study.
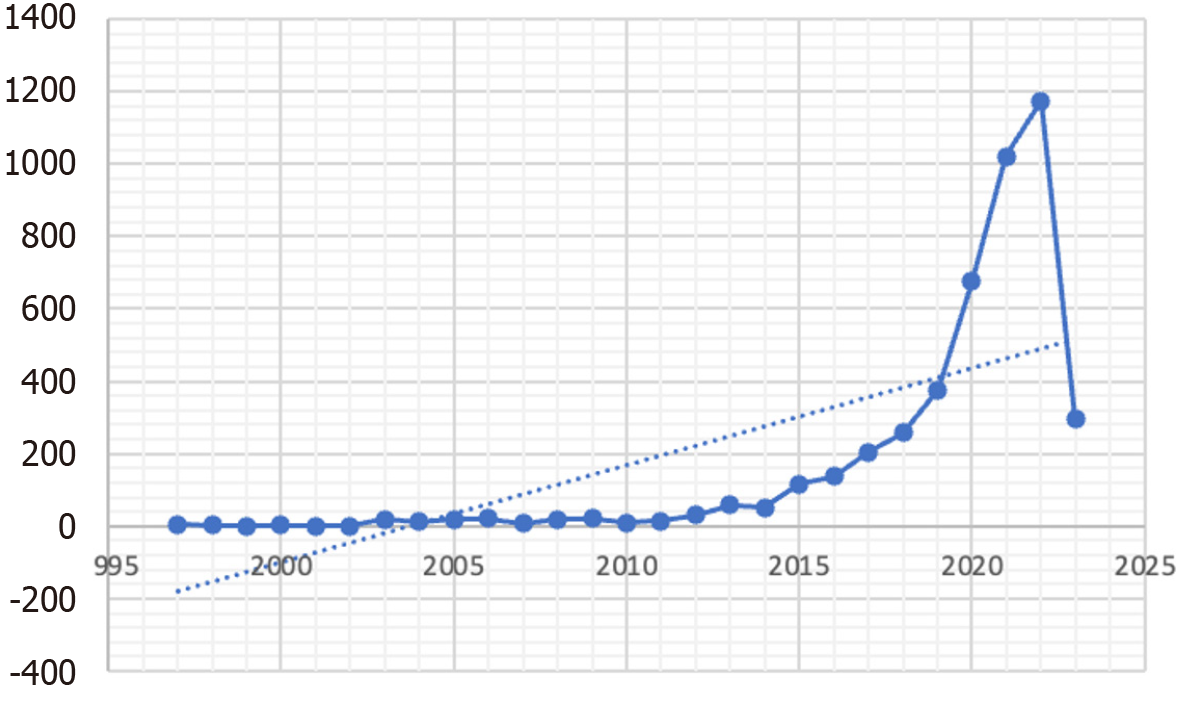
Figure 2 Global scientific research on psychopathology and social media use.
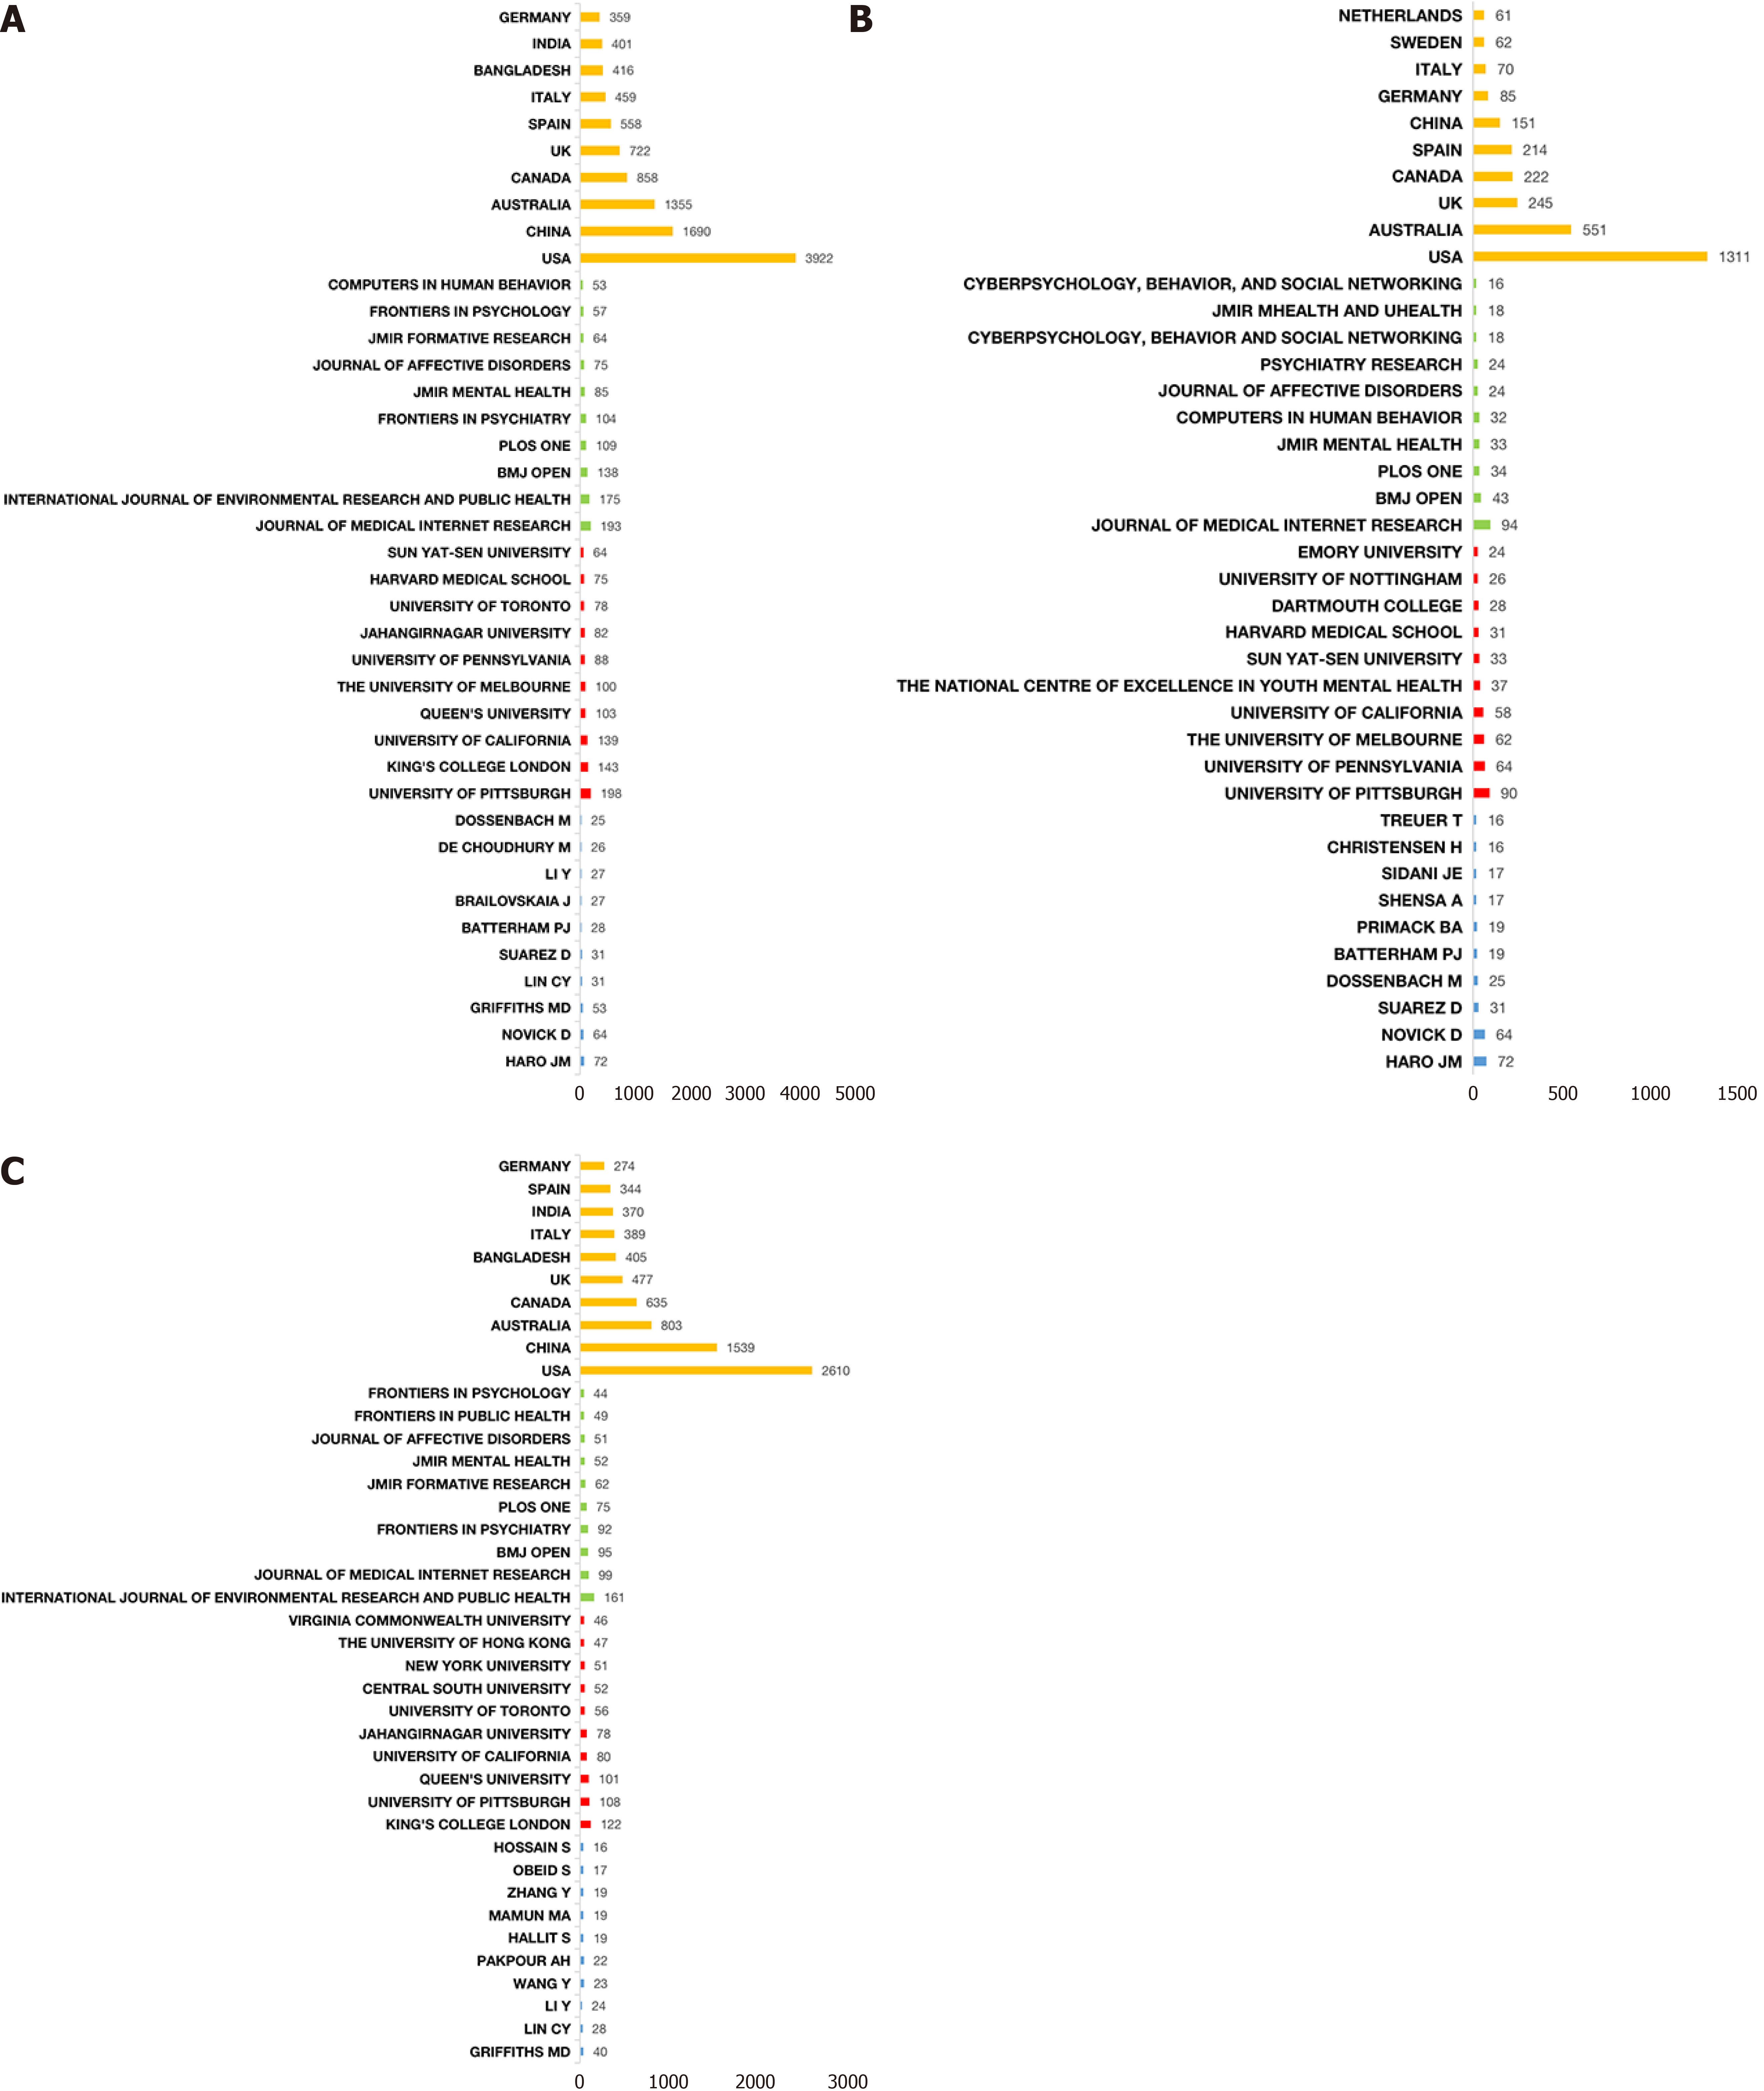
Figure 3 Ranking of high-yielding countries, journals, institutions, and authors.
A: Outline of all the included studies; B: Studies before coronavirus disease 2019 (COVID-19) (1997-2019); C: Studies after COVID-19 (2019-2023).
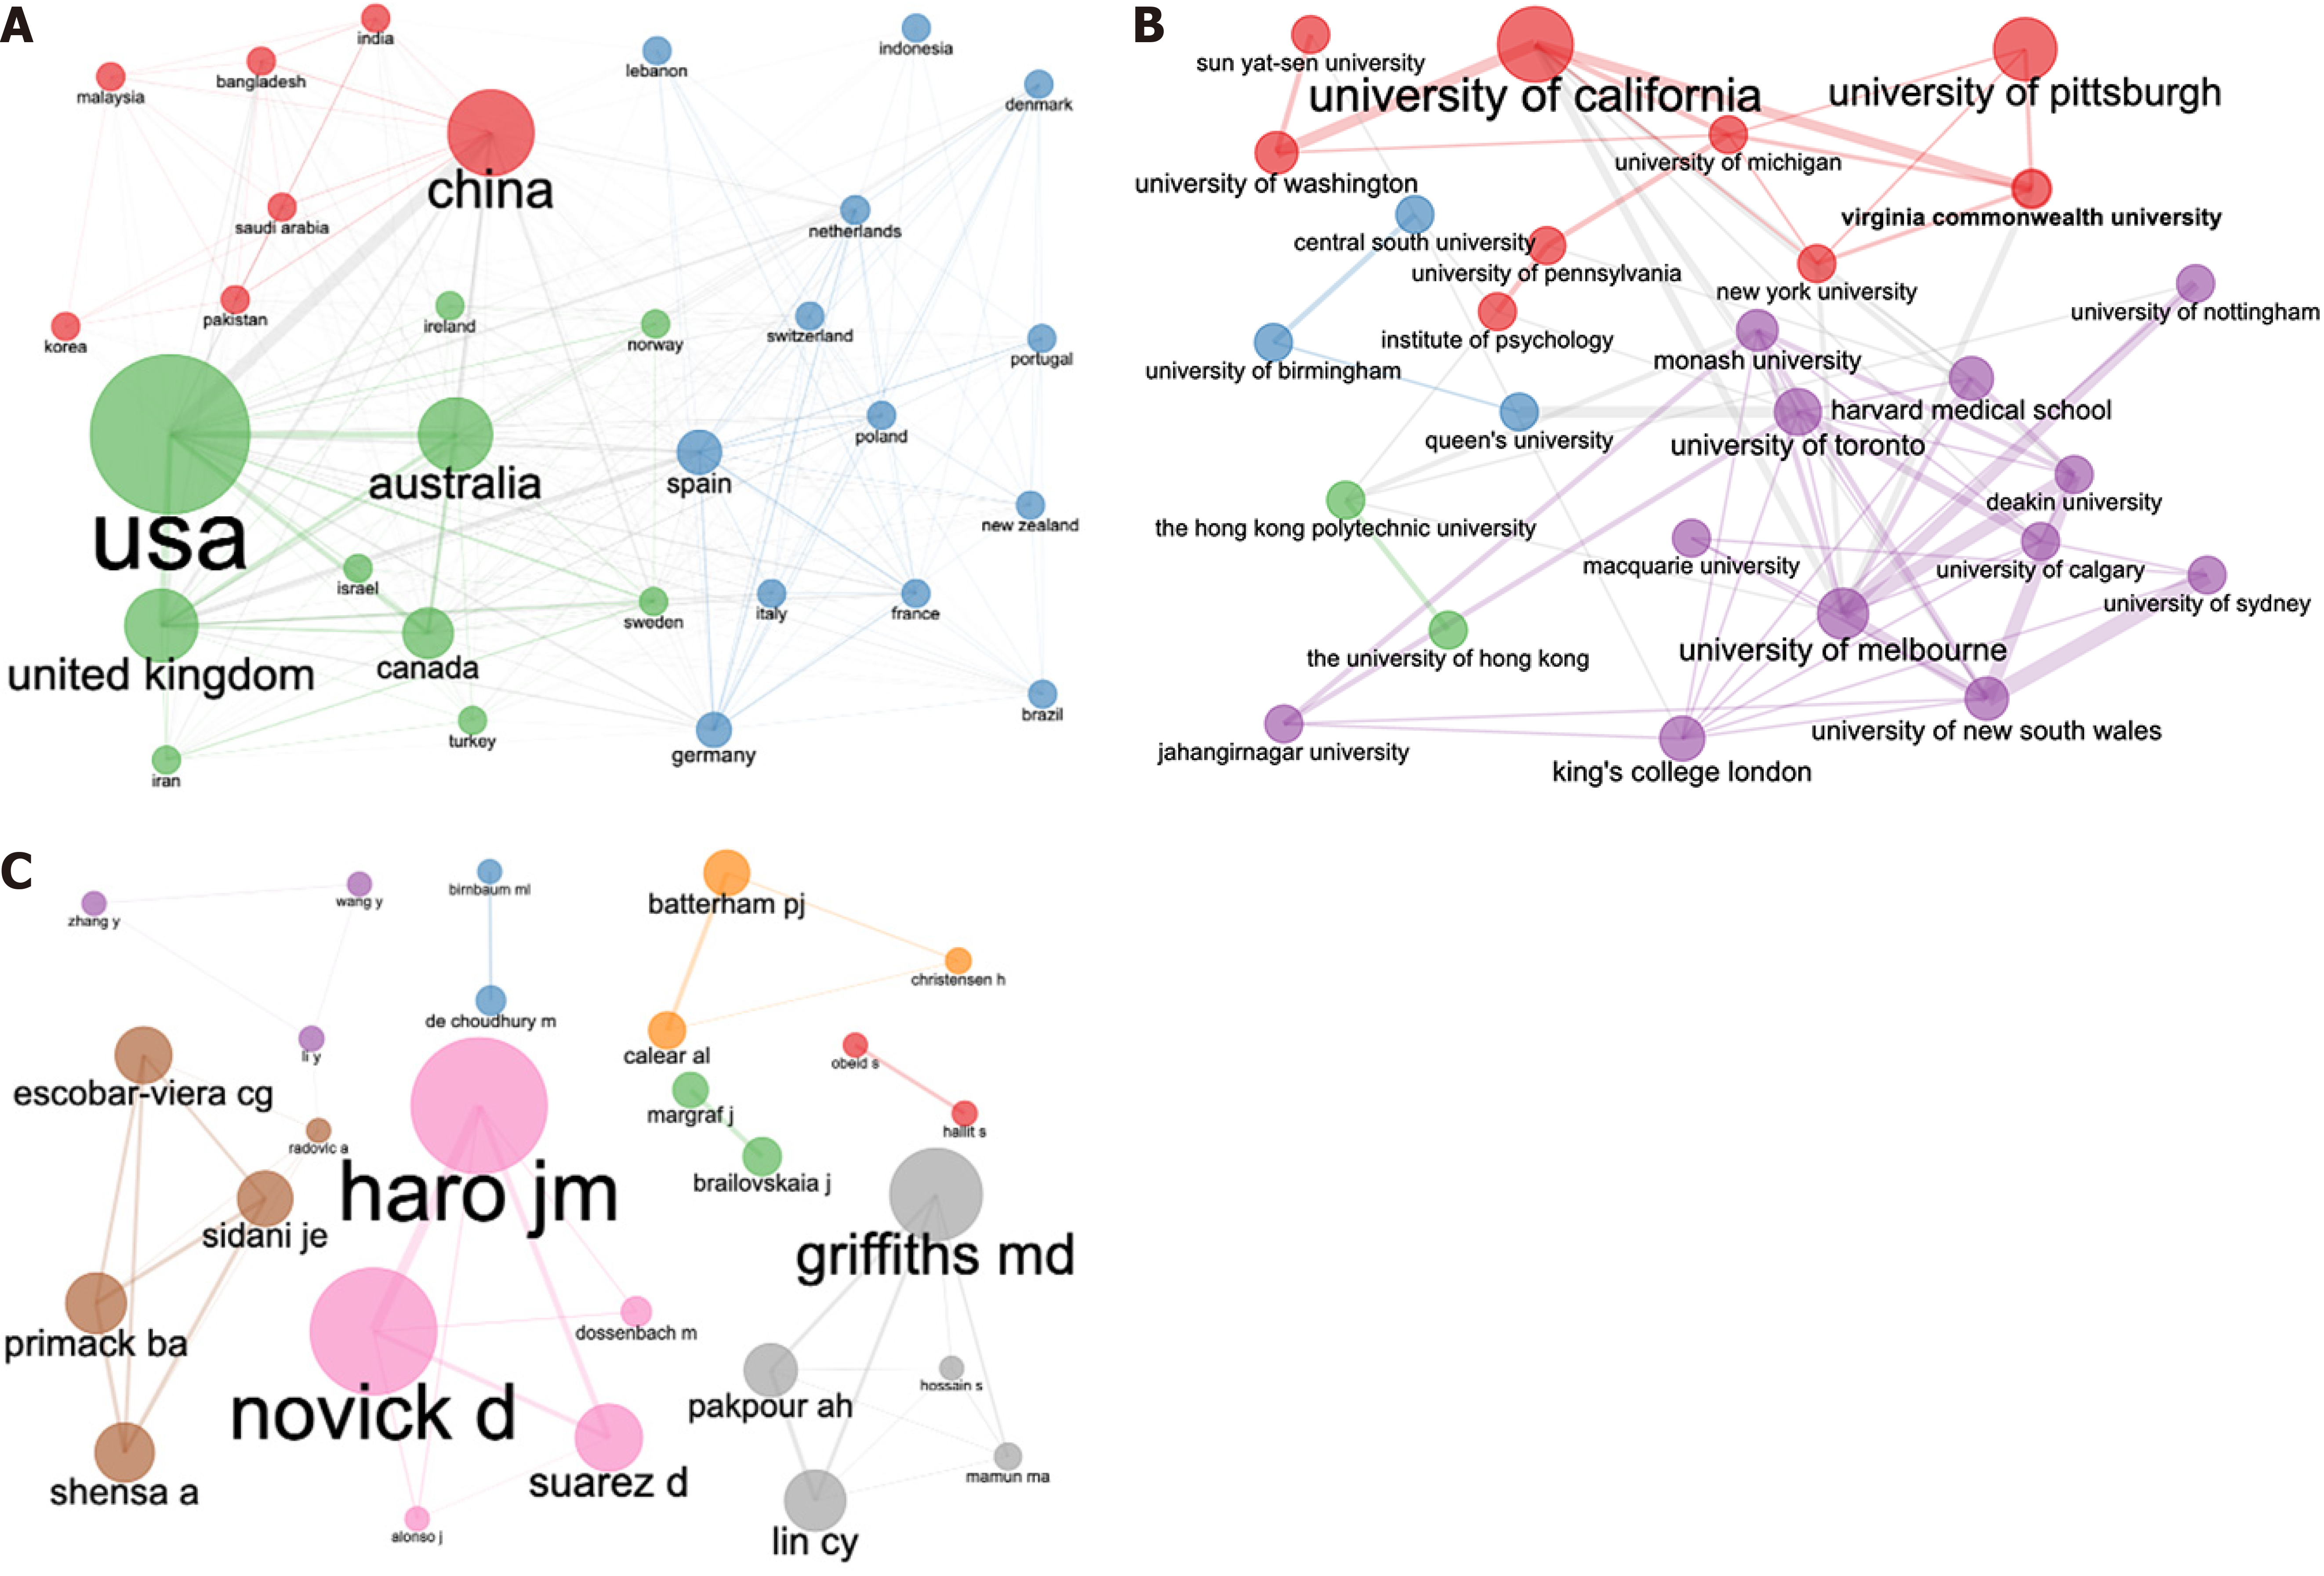
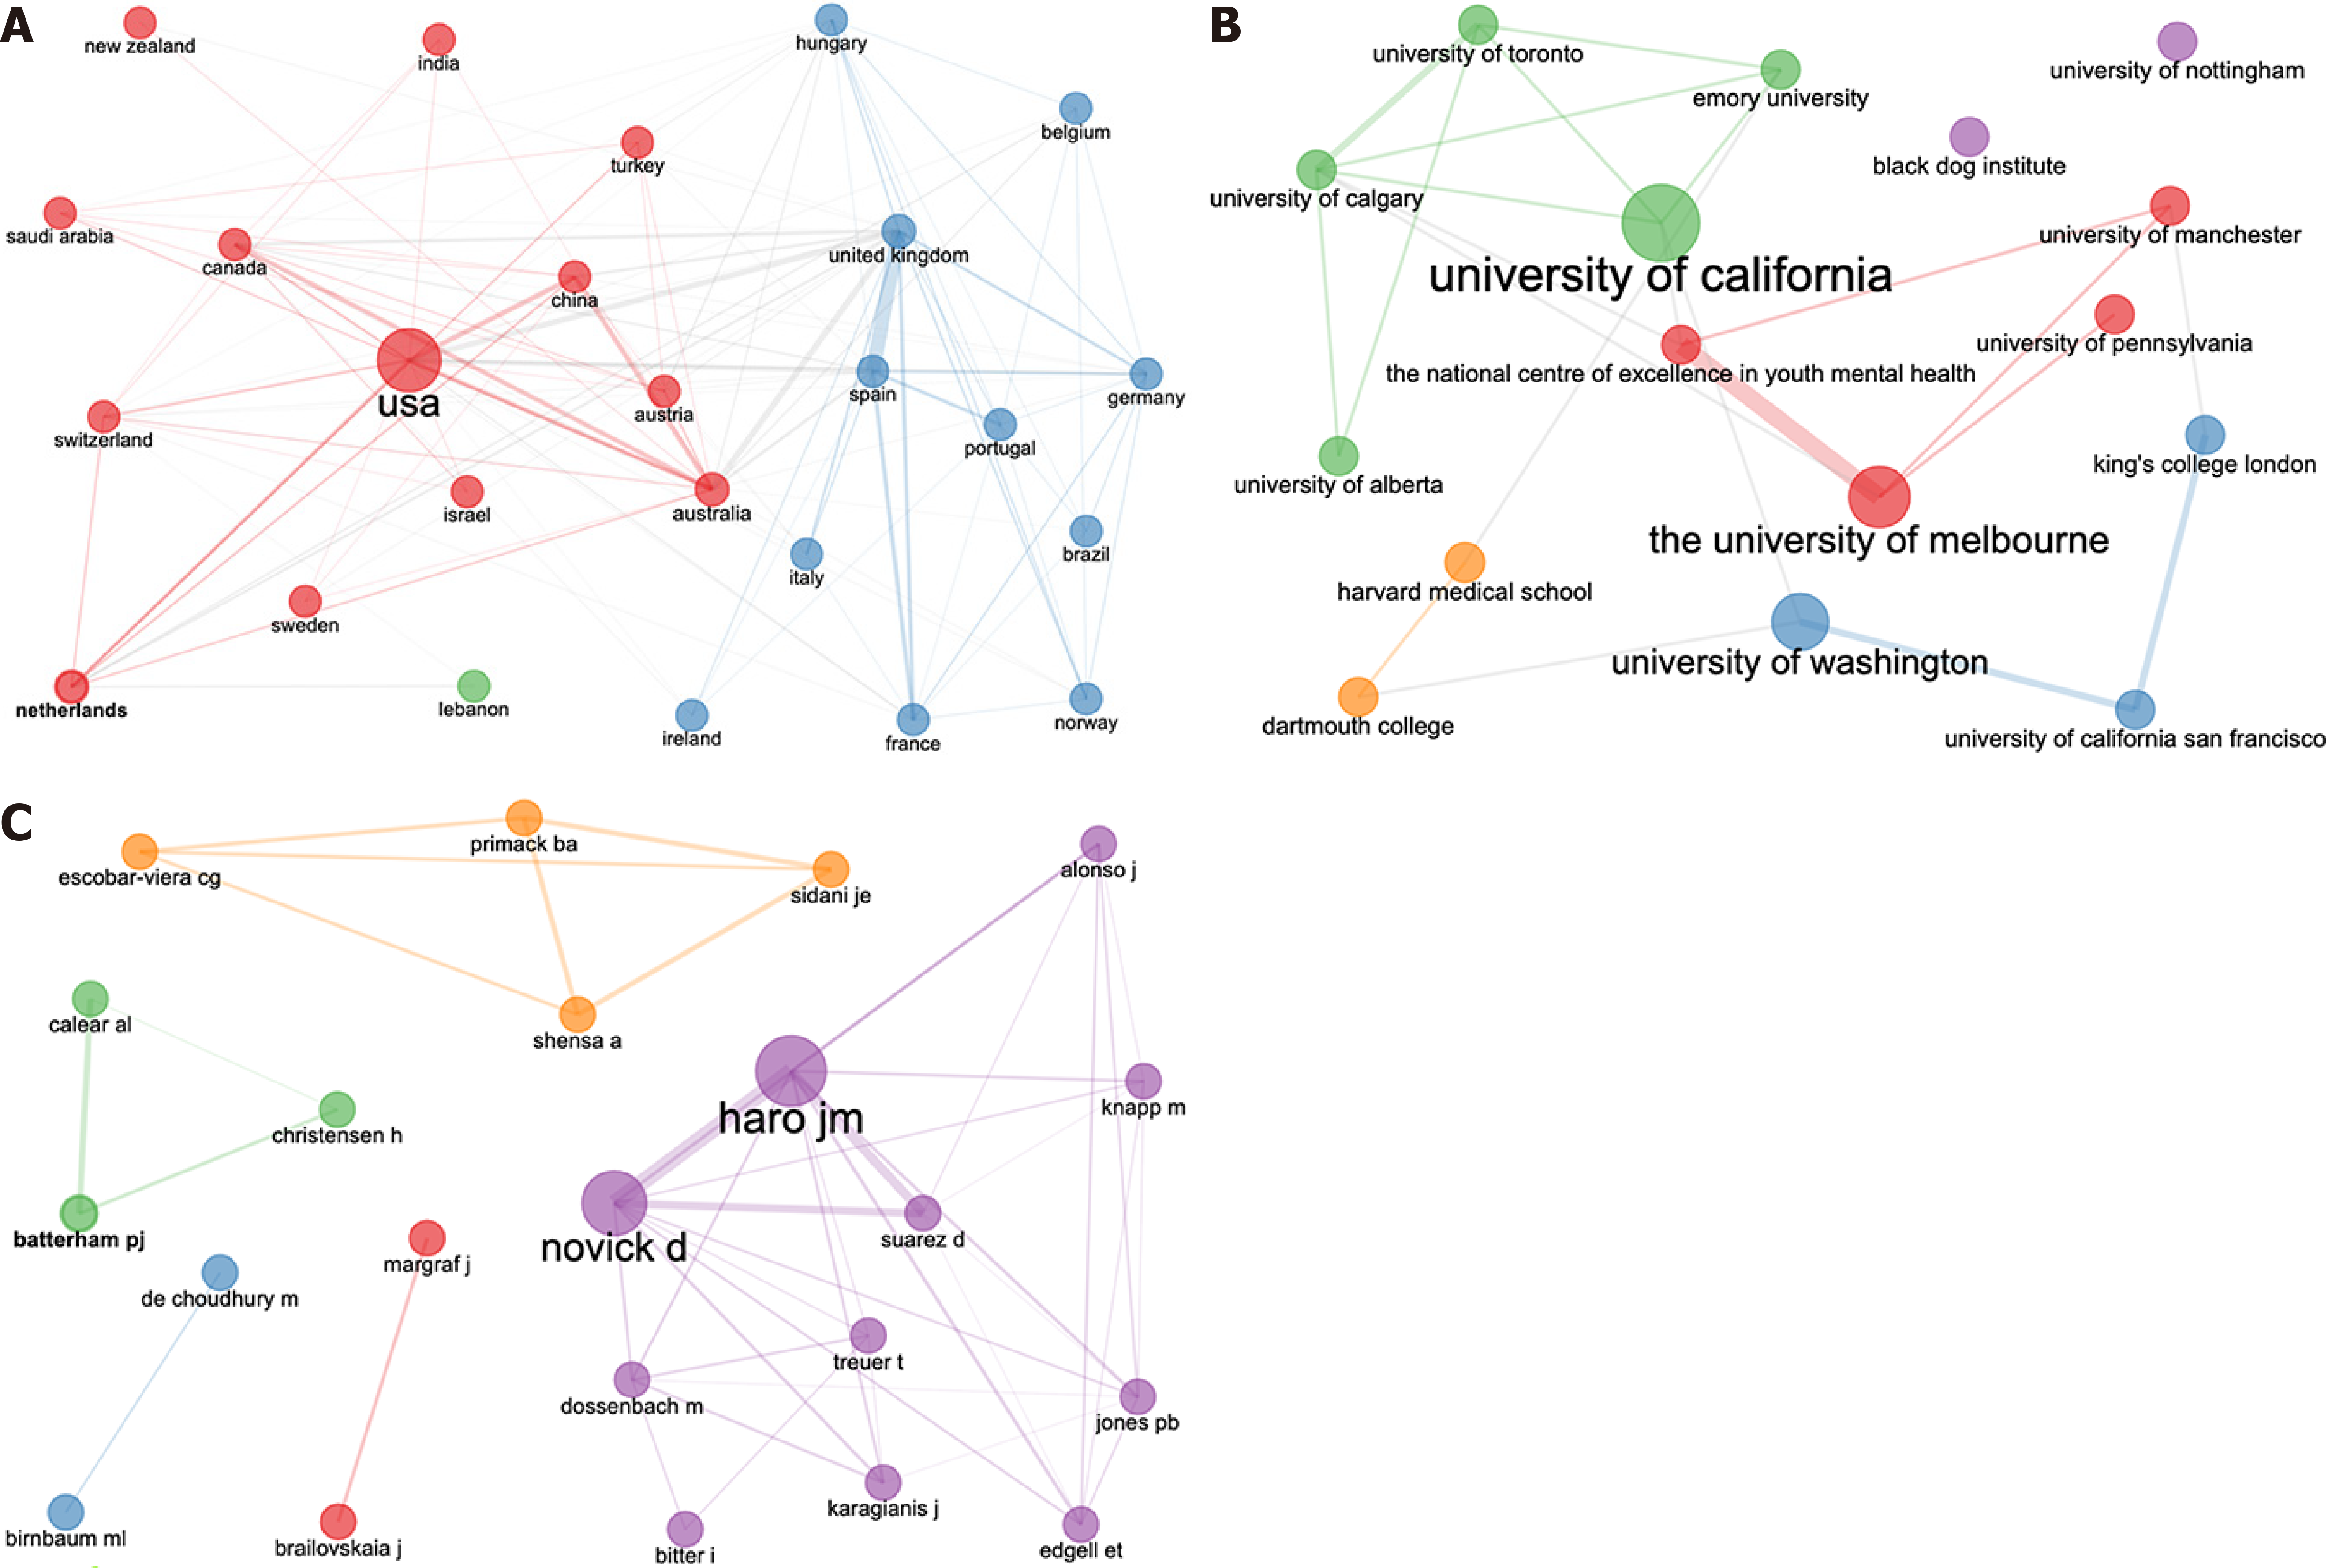
Figure 4 Outline of the entire global collaboration analysis.
A: Country collaboration; B: Institutional collaboration; C: Author collaboration.
Figure 5 Global collaboration before coronavirus disease 2019 (1997-2019).
A: Country collaboration; B: Institutional collaboration; C: Author collaboration.
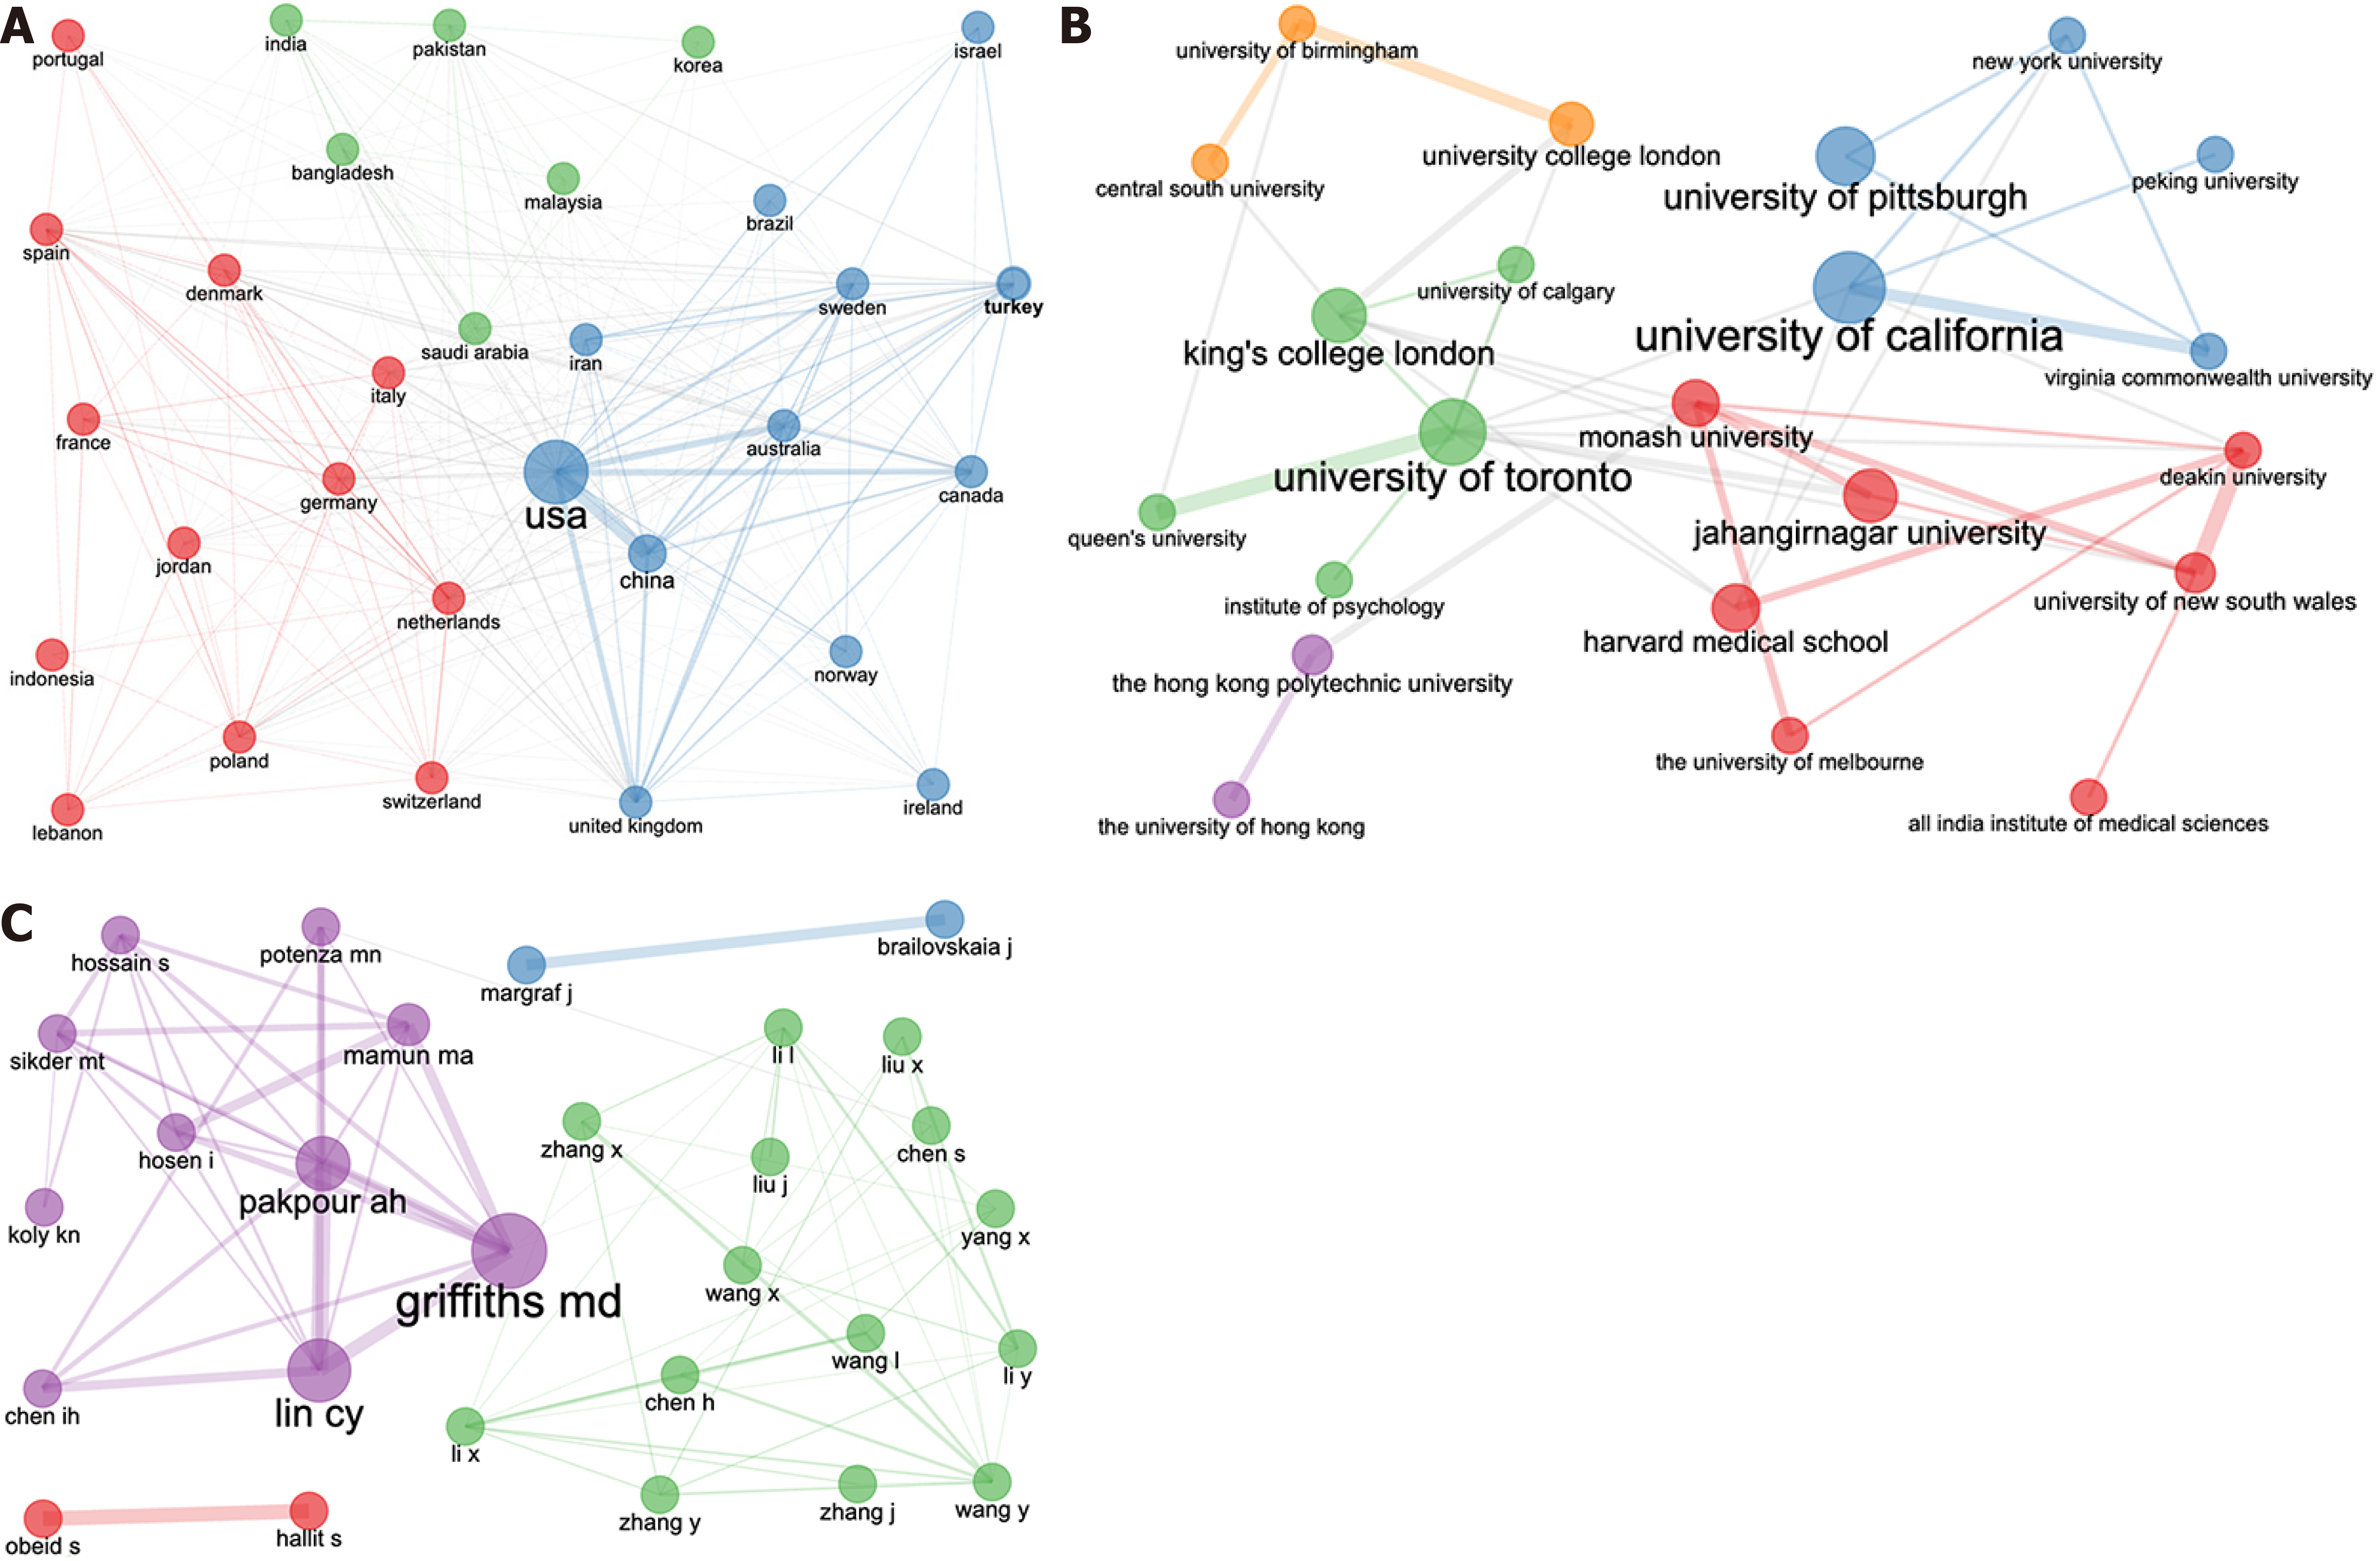
Figure 6 Global collaboration after coronavirus disease 2019 (2019-2023).
A: Country collaboration; B: Institutional collaboration; C: Author collaboration.
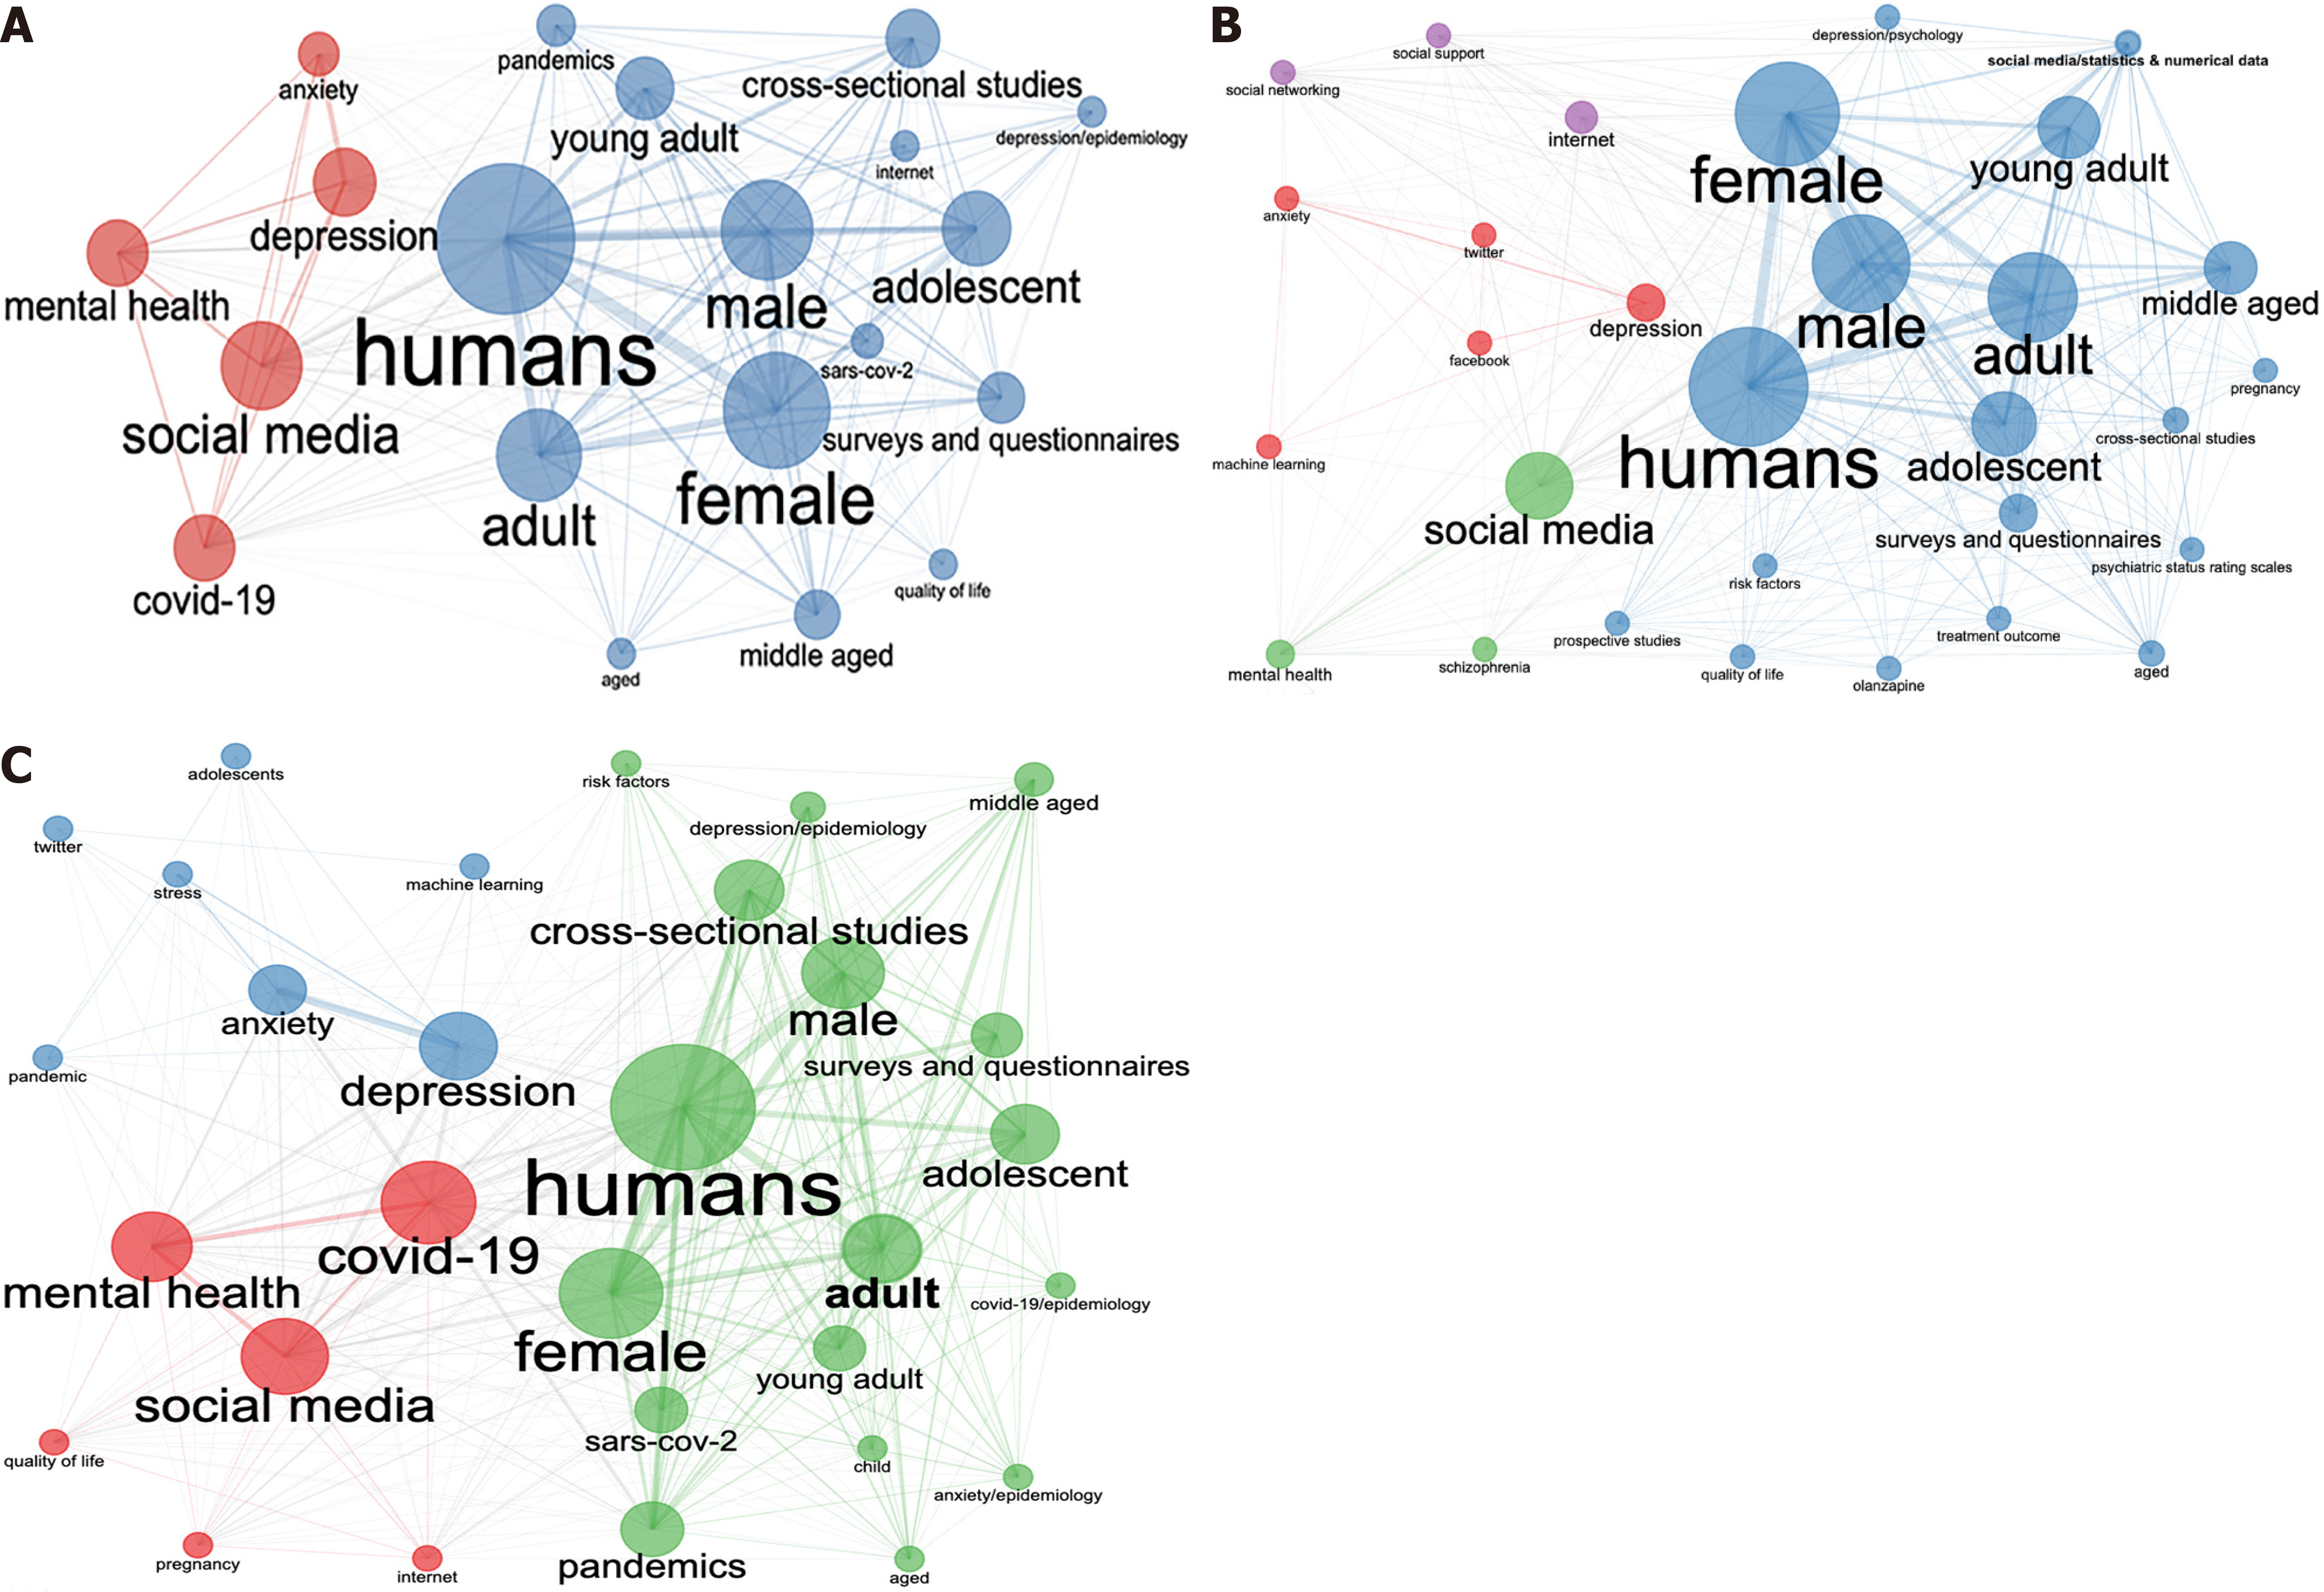
Figure 7 Co-occurrence of keywords.
A: Overall co-occurrence of keywords; B: Co-occurrence of keywords before coronavirus disease 2019 (COVID-19) (1997-2019); C: Co-occurrence of keywords after COVID-19 (2019-2023).
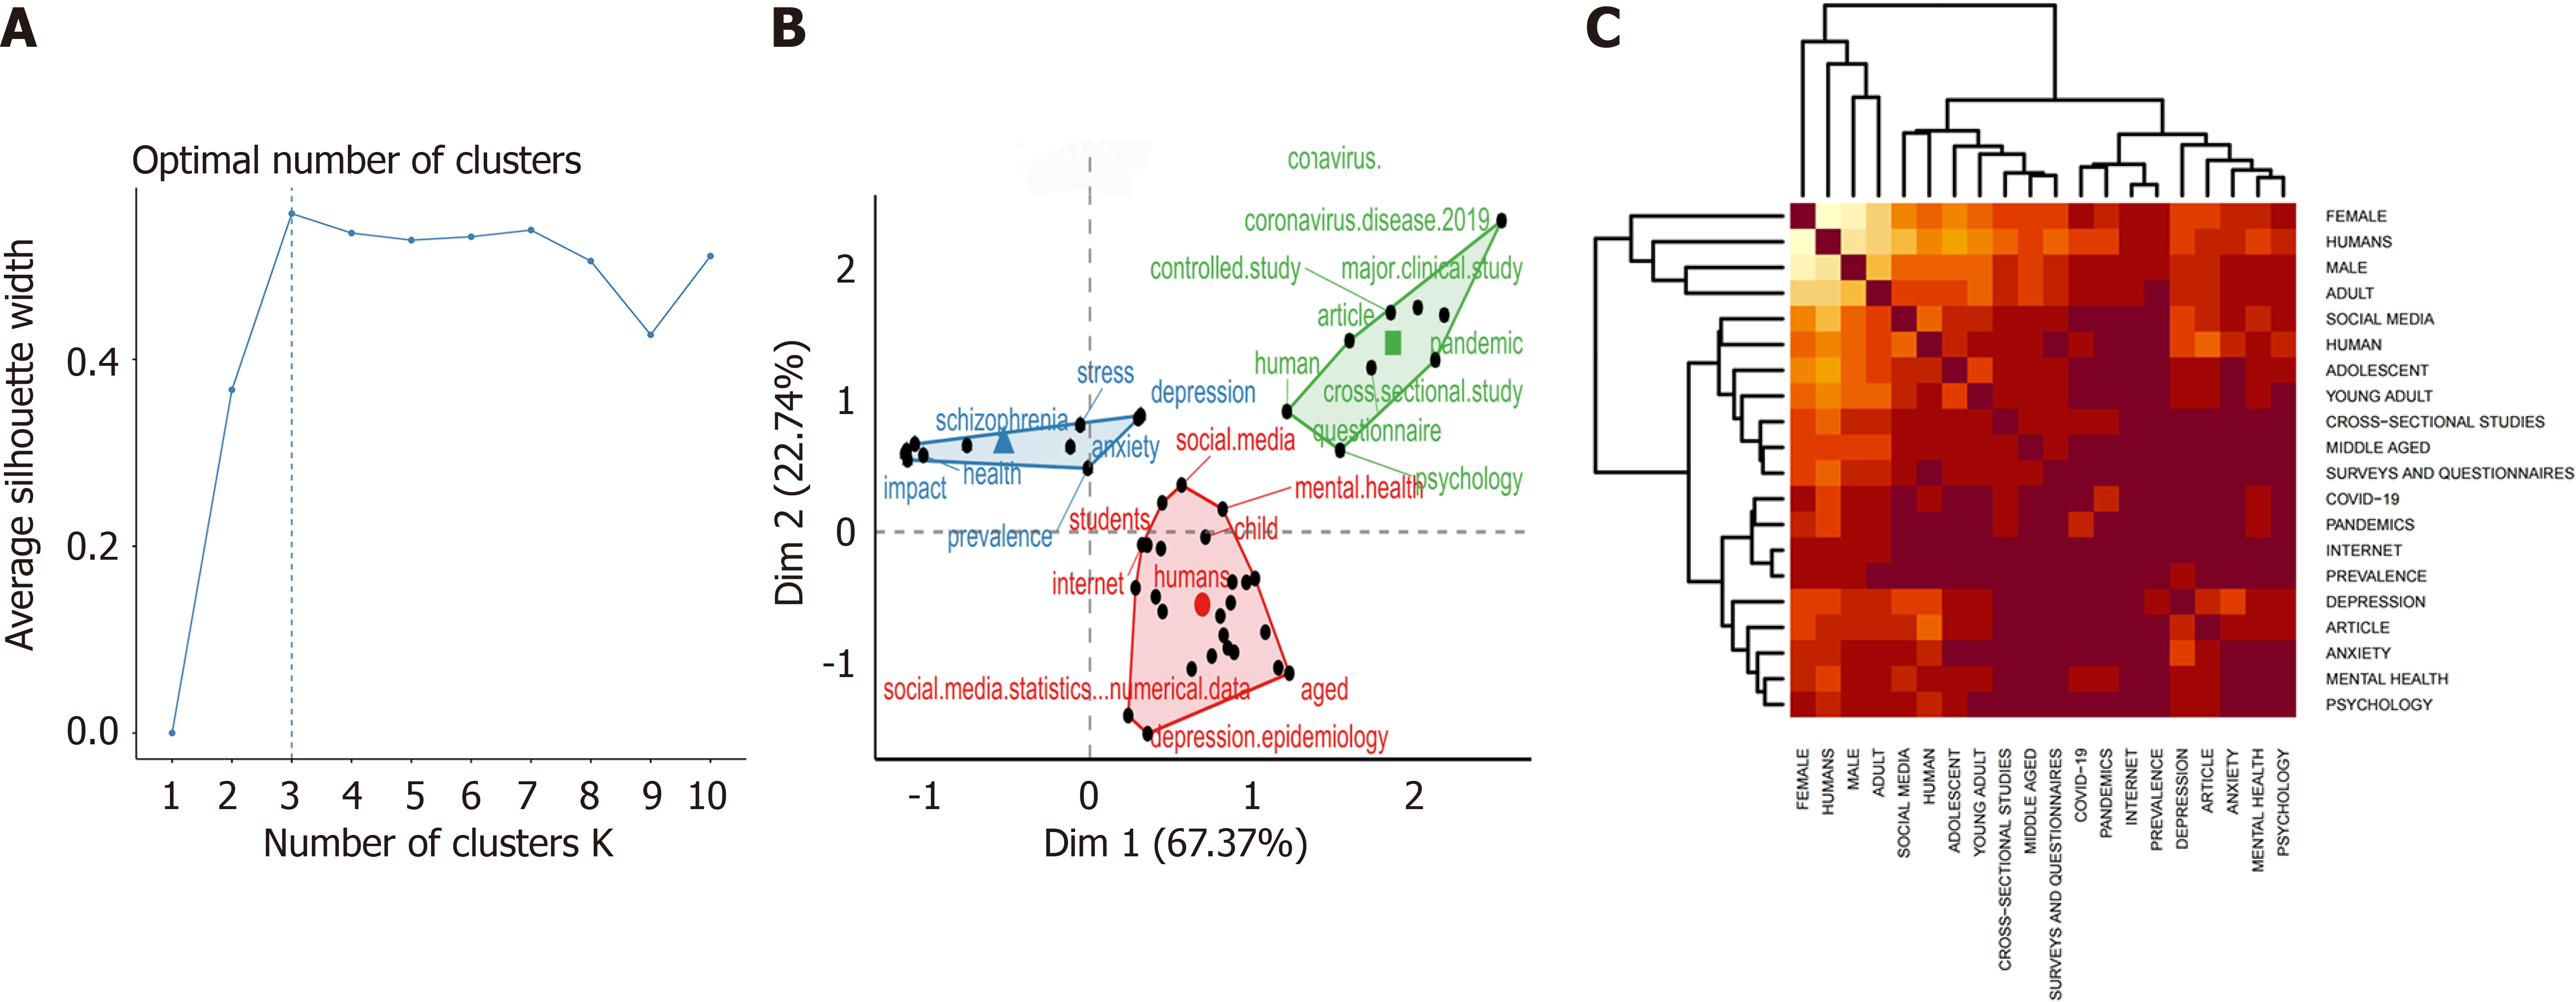
Figure 8 Outline of the complete keyword cluster and heat map analysis based on the topics of research on psychopathology and social media use.
A: Optimal clustering number identified; B: Three clusters identified; C: A heat map used to assess the association strength of the keywords.
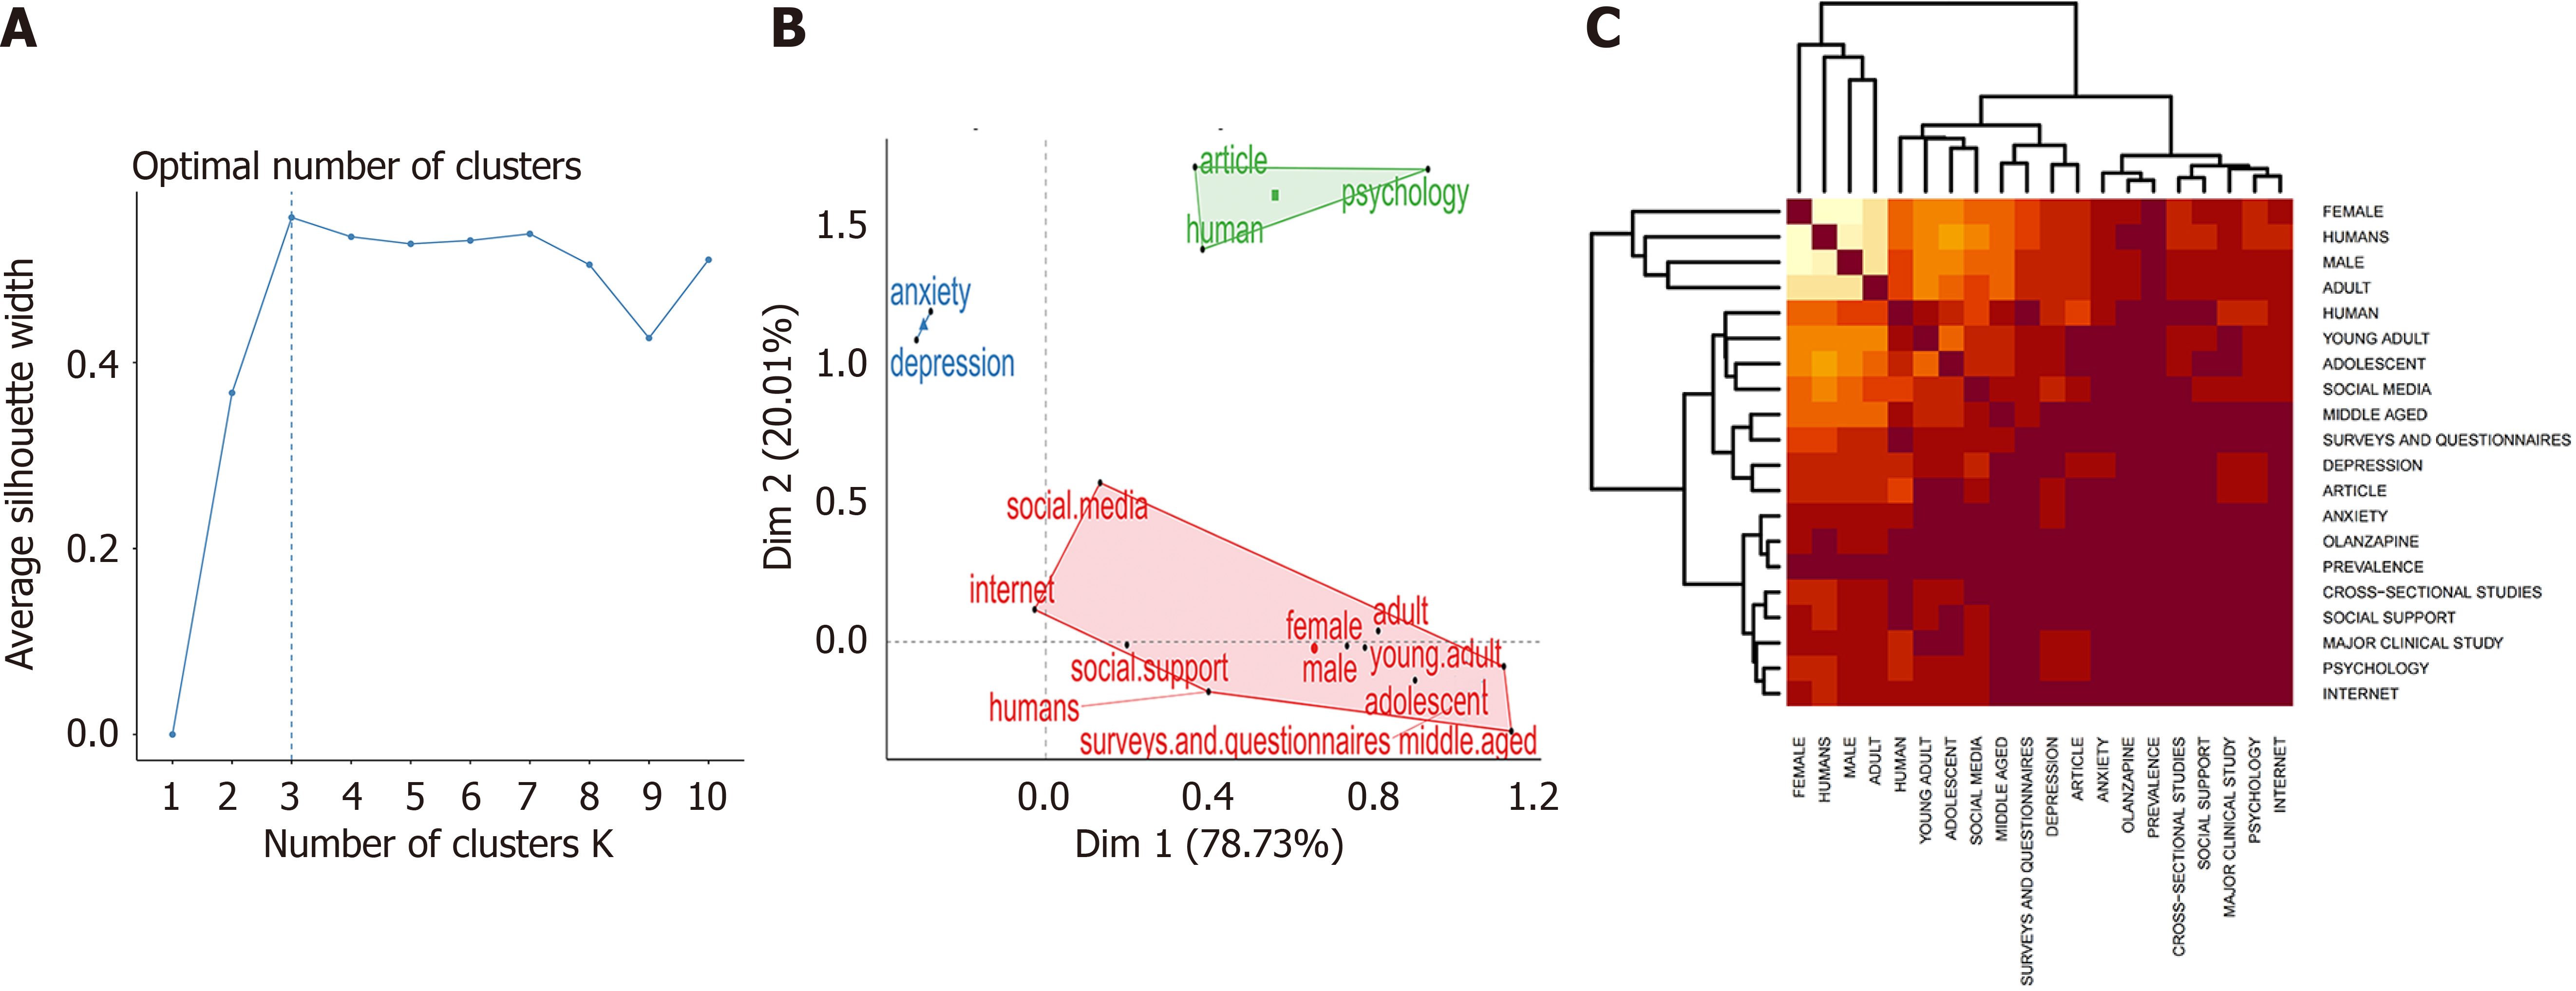
Figure 9 Keyword cluster and heatmap analysis based on the topic of research on psychopathology and social media use before coronavirus disease 2019 (1997-2019).
A: Optimal clustering number identified; B: Three clusters identified; C: Heat map used to assess the association strength of the keywords.
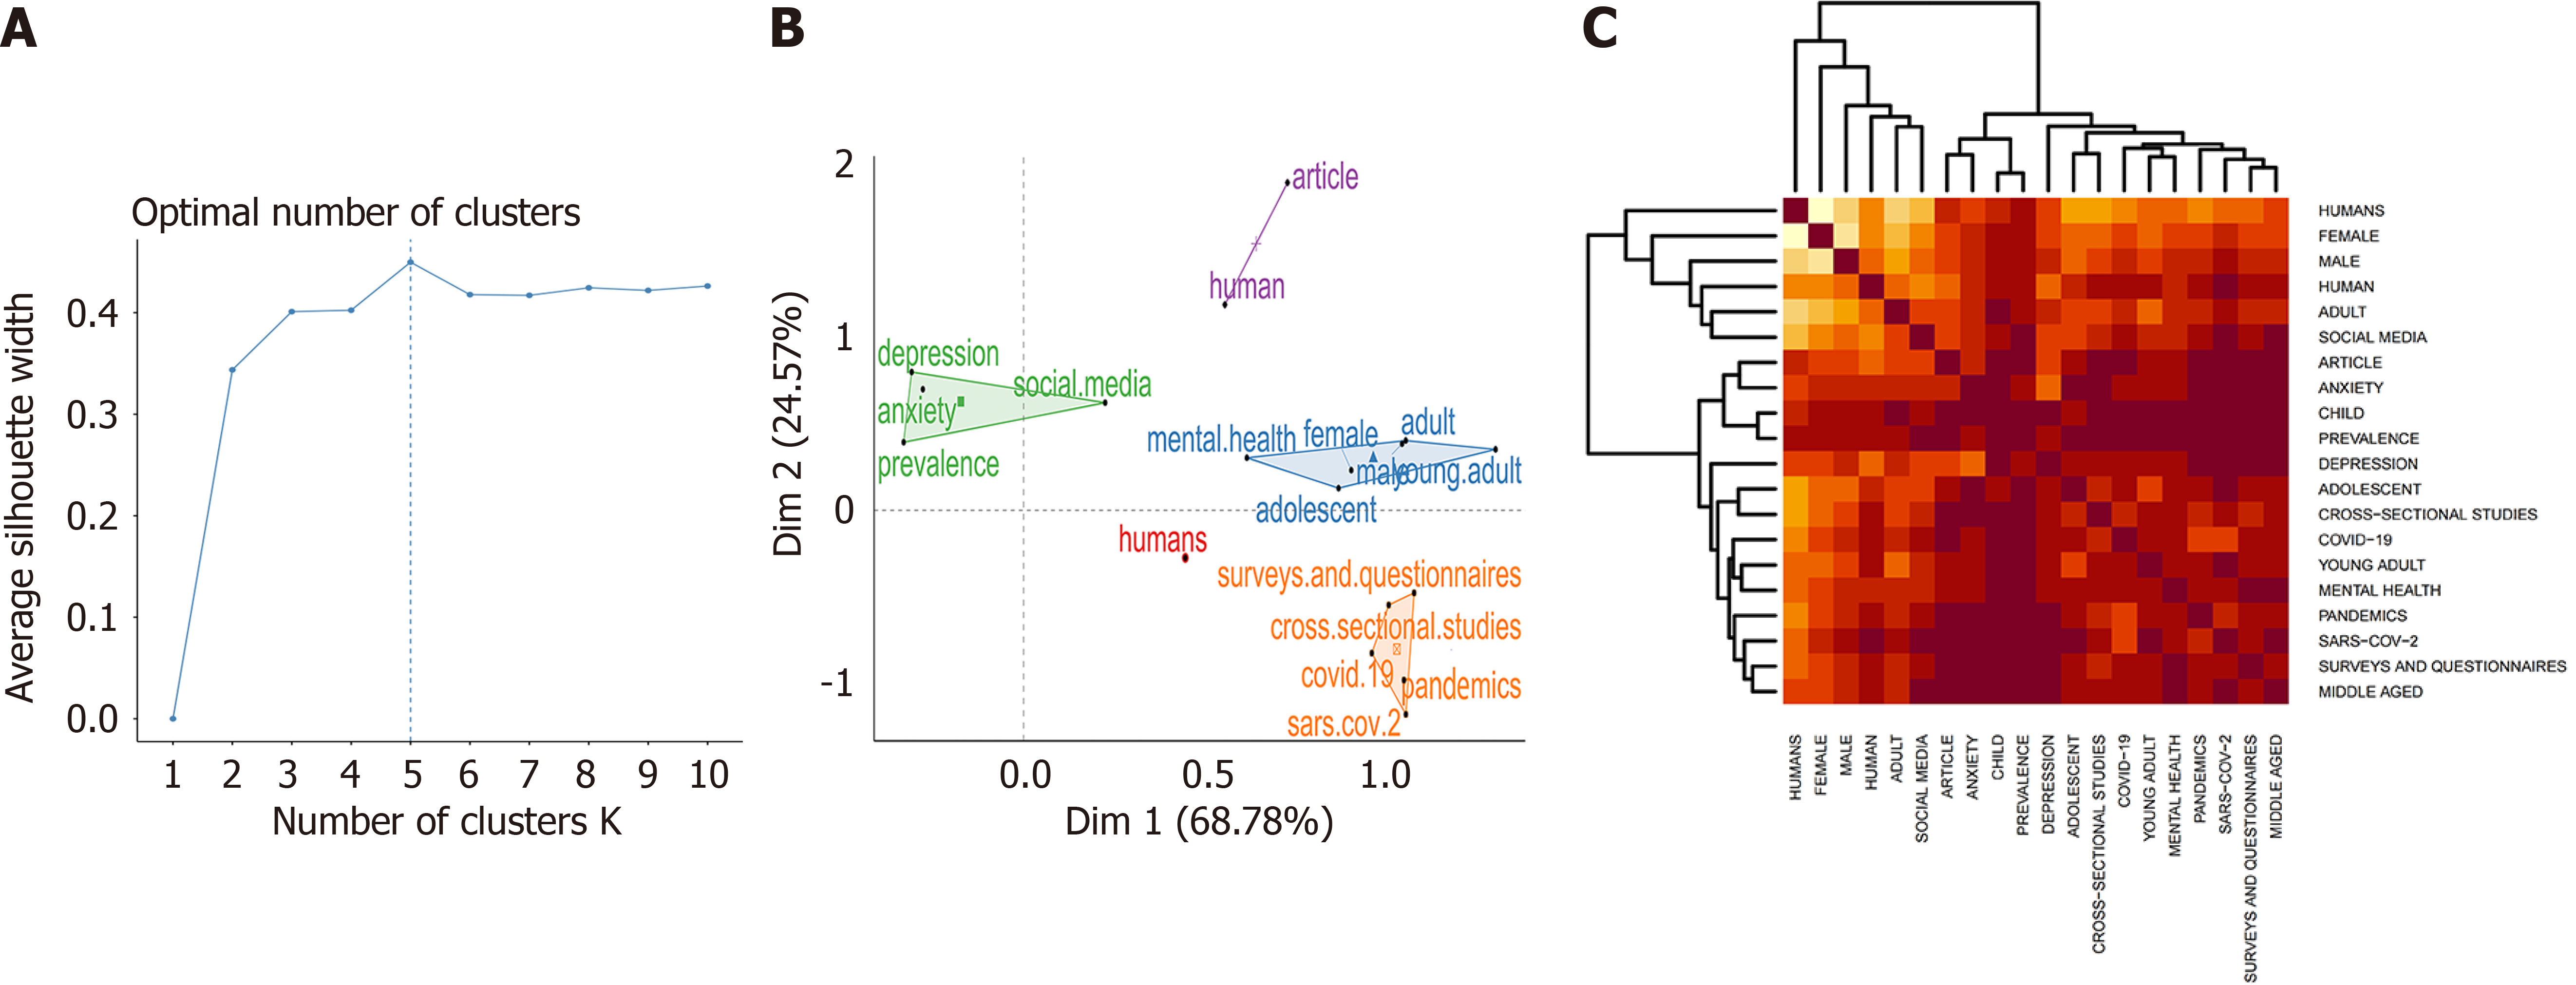
Figure 10 Keyword cluster and heatmap analysis based on the topic of research on psychopathology and social media use after coronavirus disease 2019 (2019-2023).
A: Optimal clustering number identified; B: Five clusters identified; C: Heat map used to assess the association strength of the keywords.
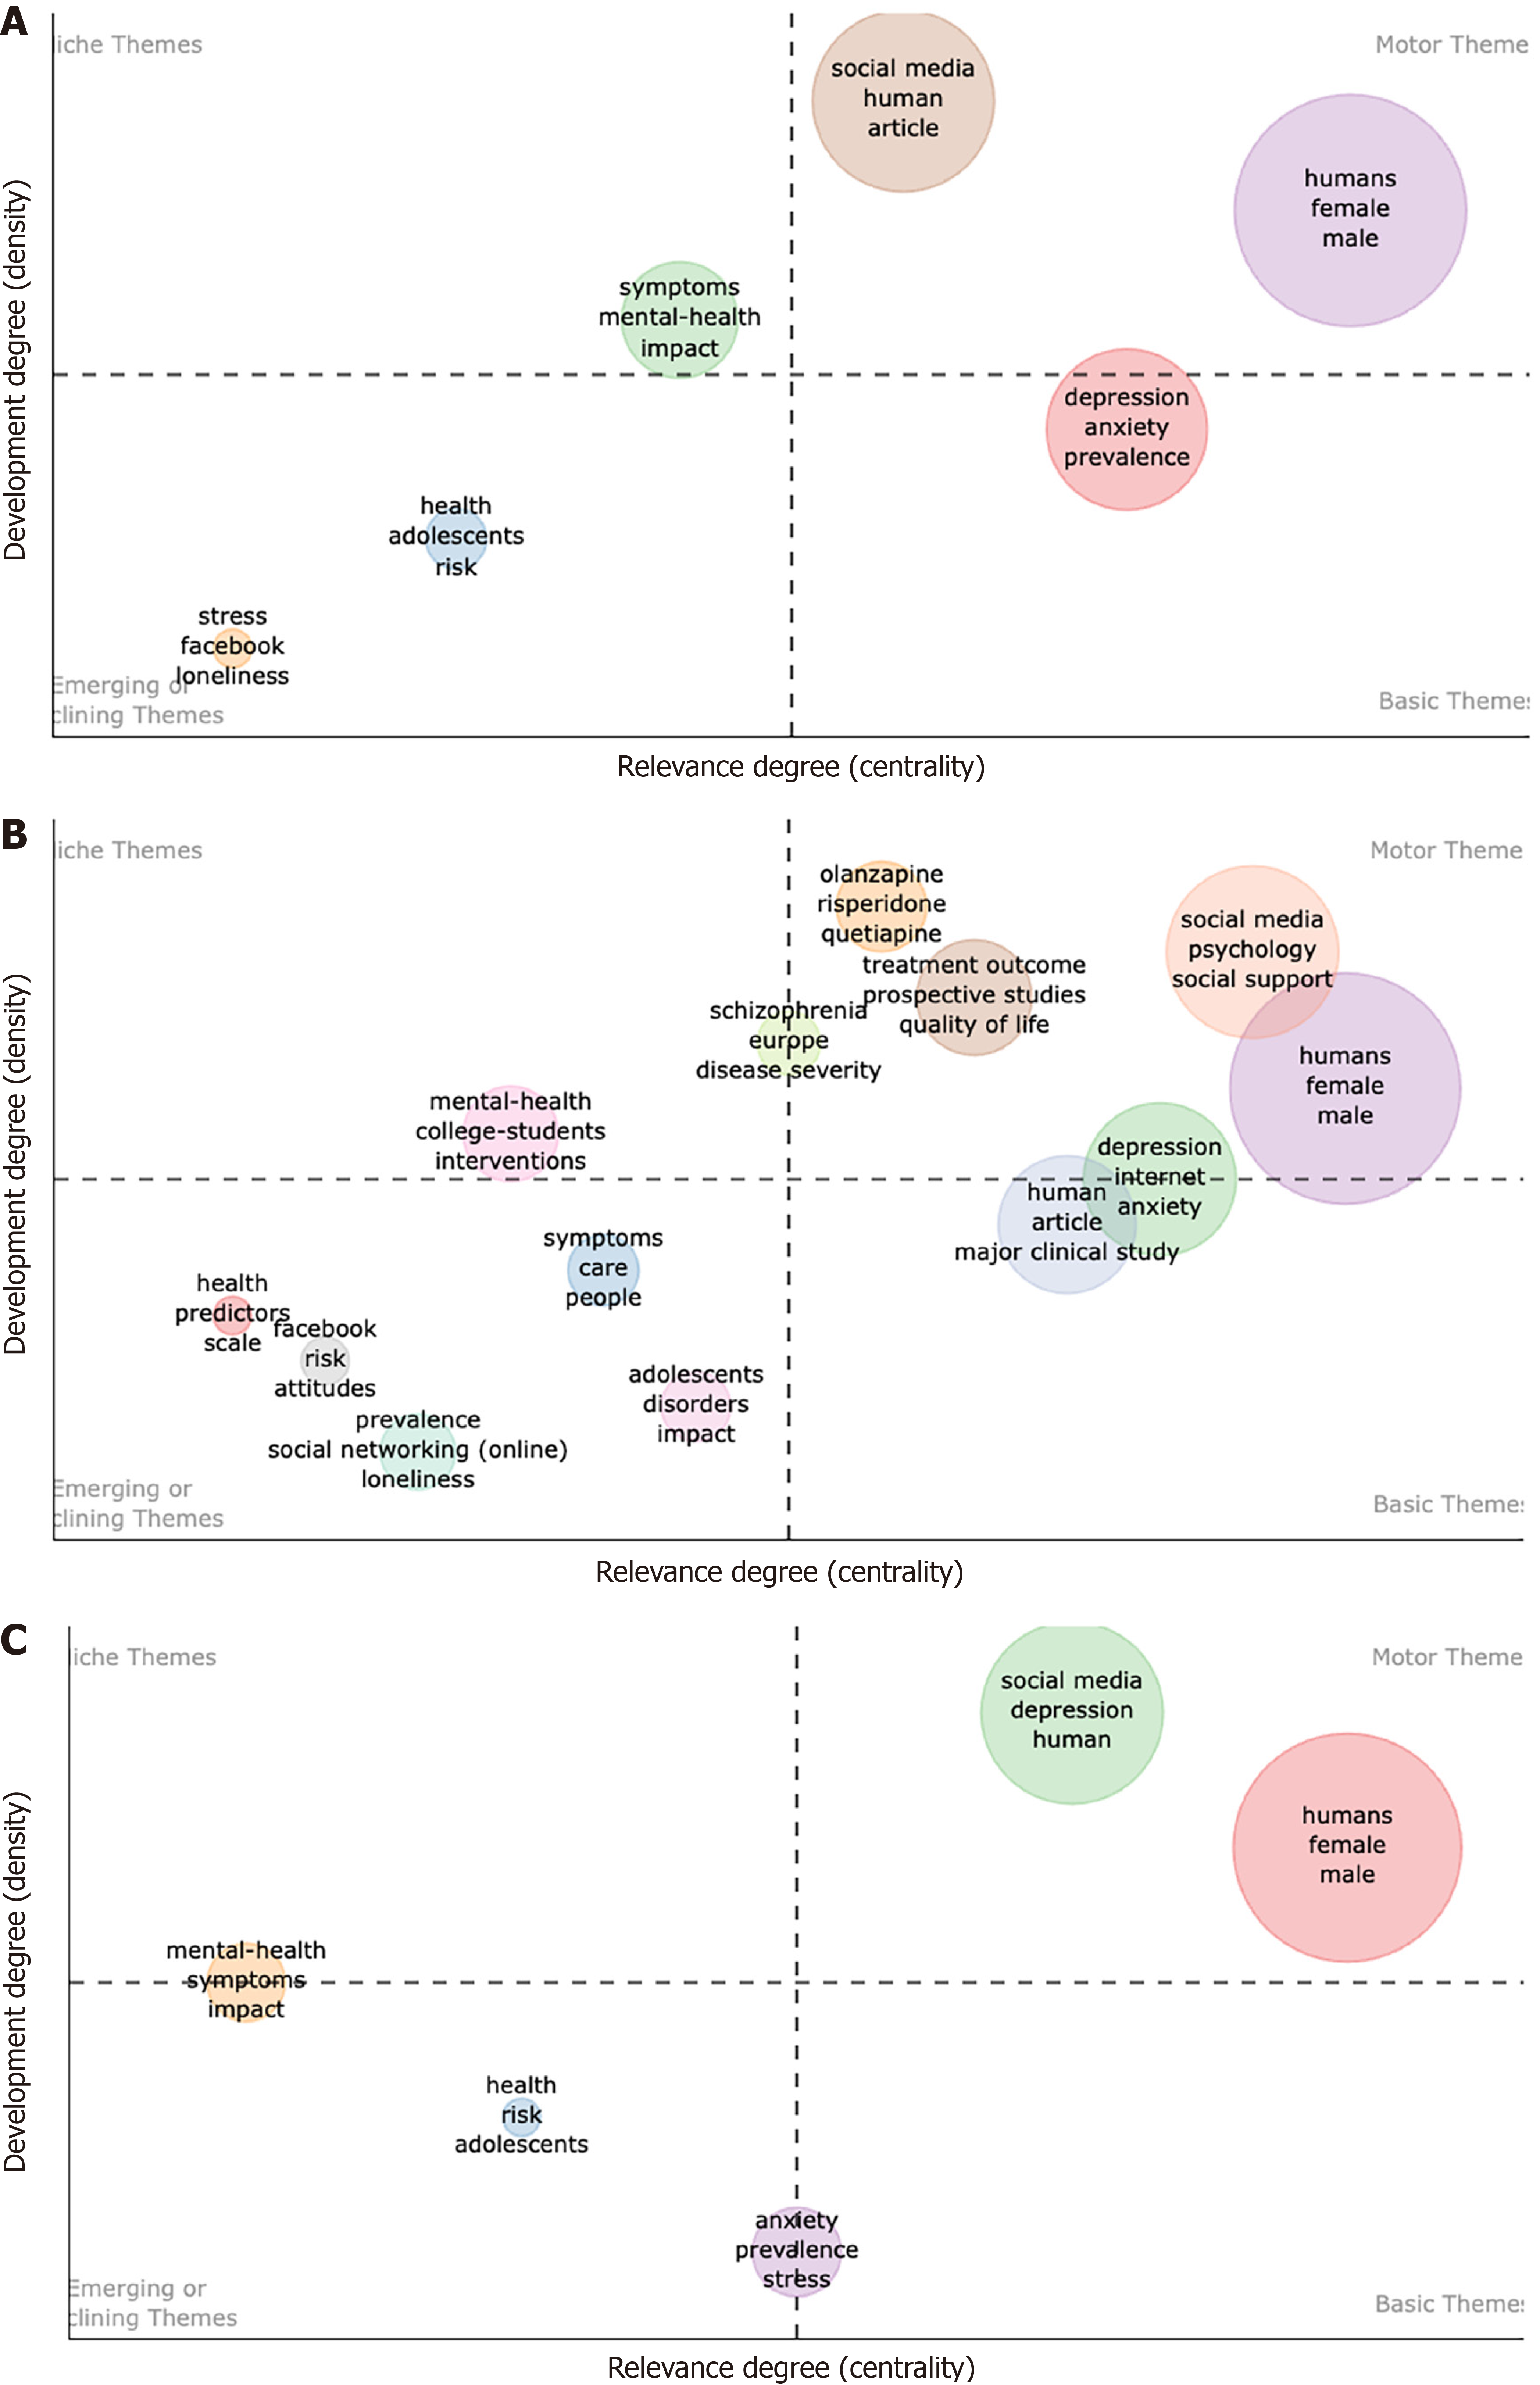
Figure 11 Thematic maps.
A: Overall thematic map; B: Thematic map before coronavirus disease 2019 (1997-2019); C: Thematic map after COVID-19 (2019-2023).
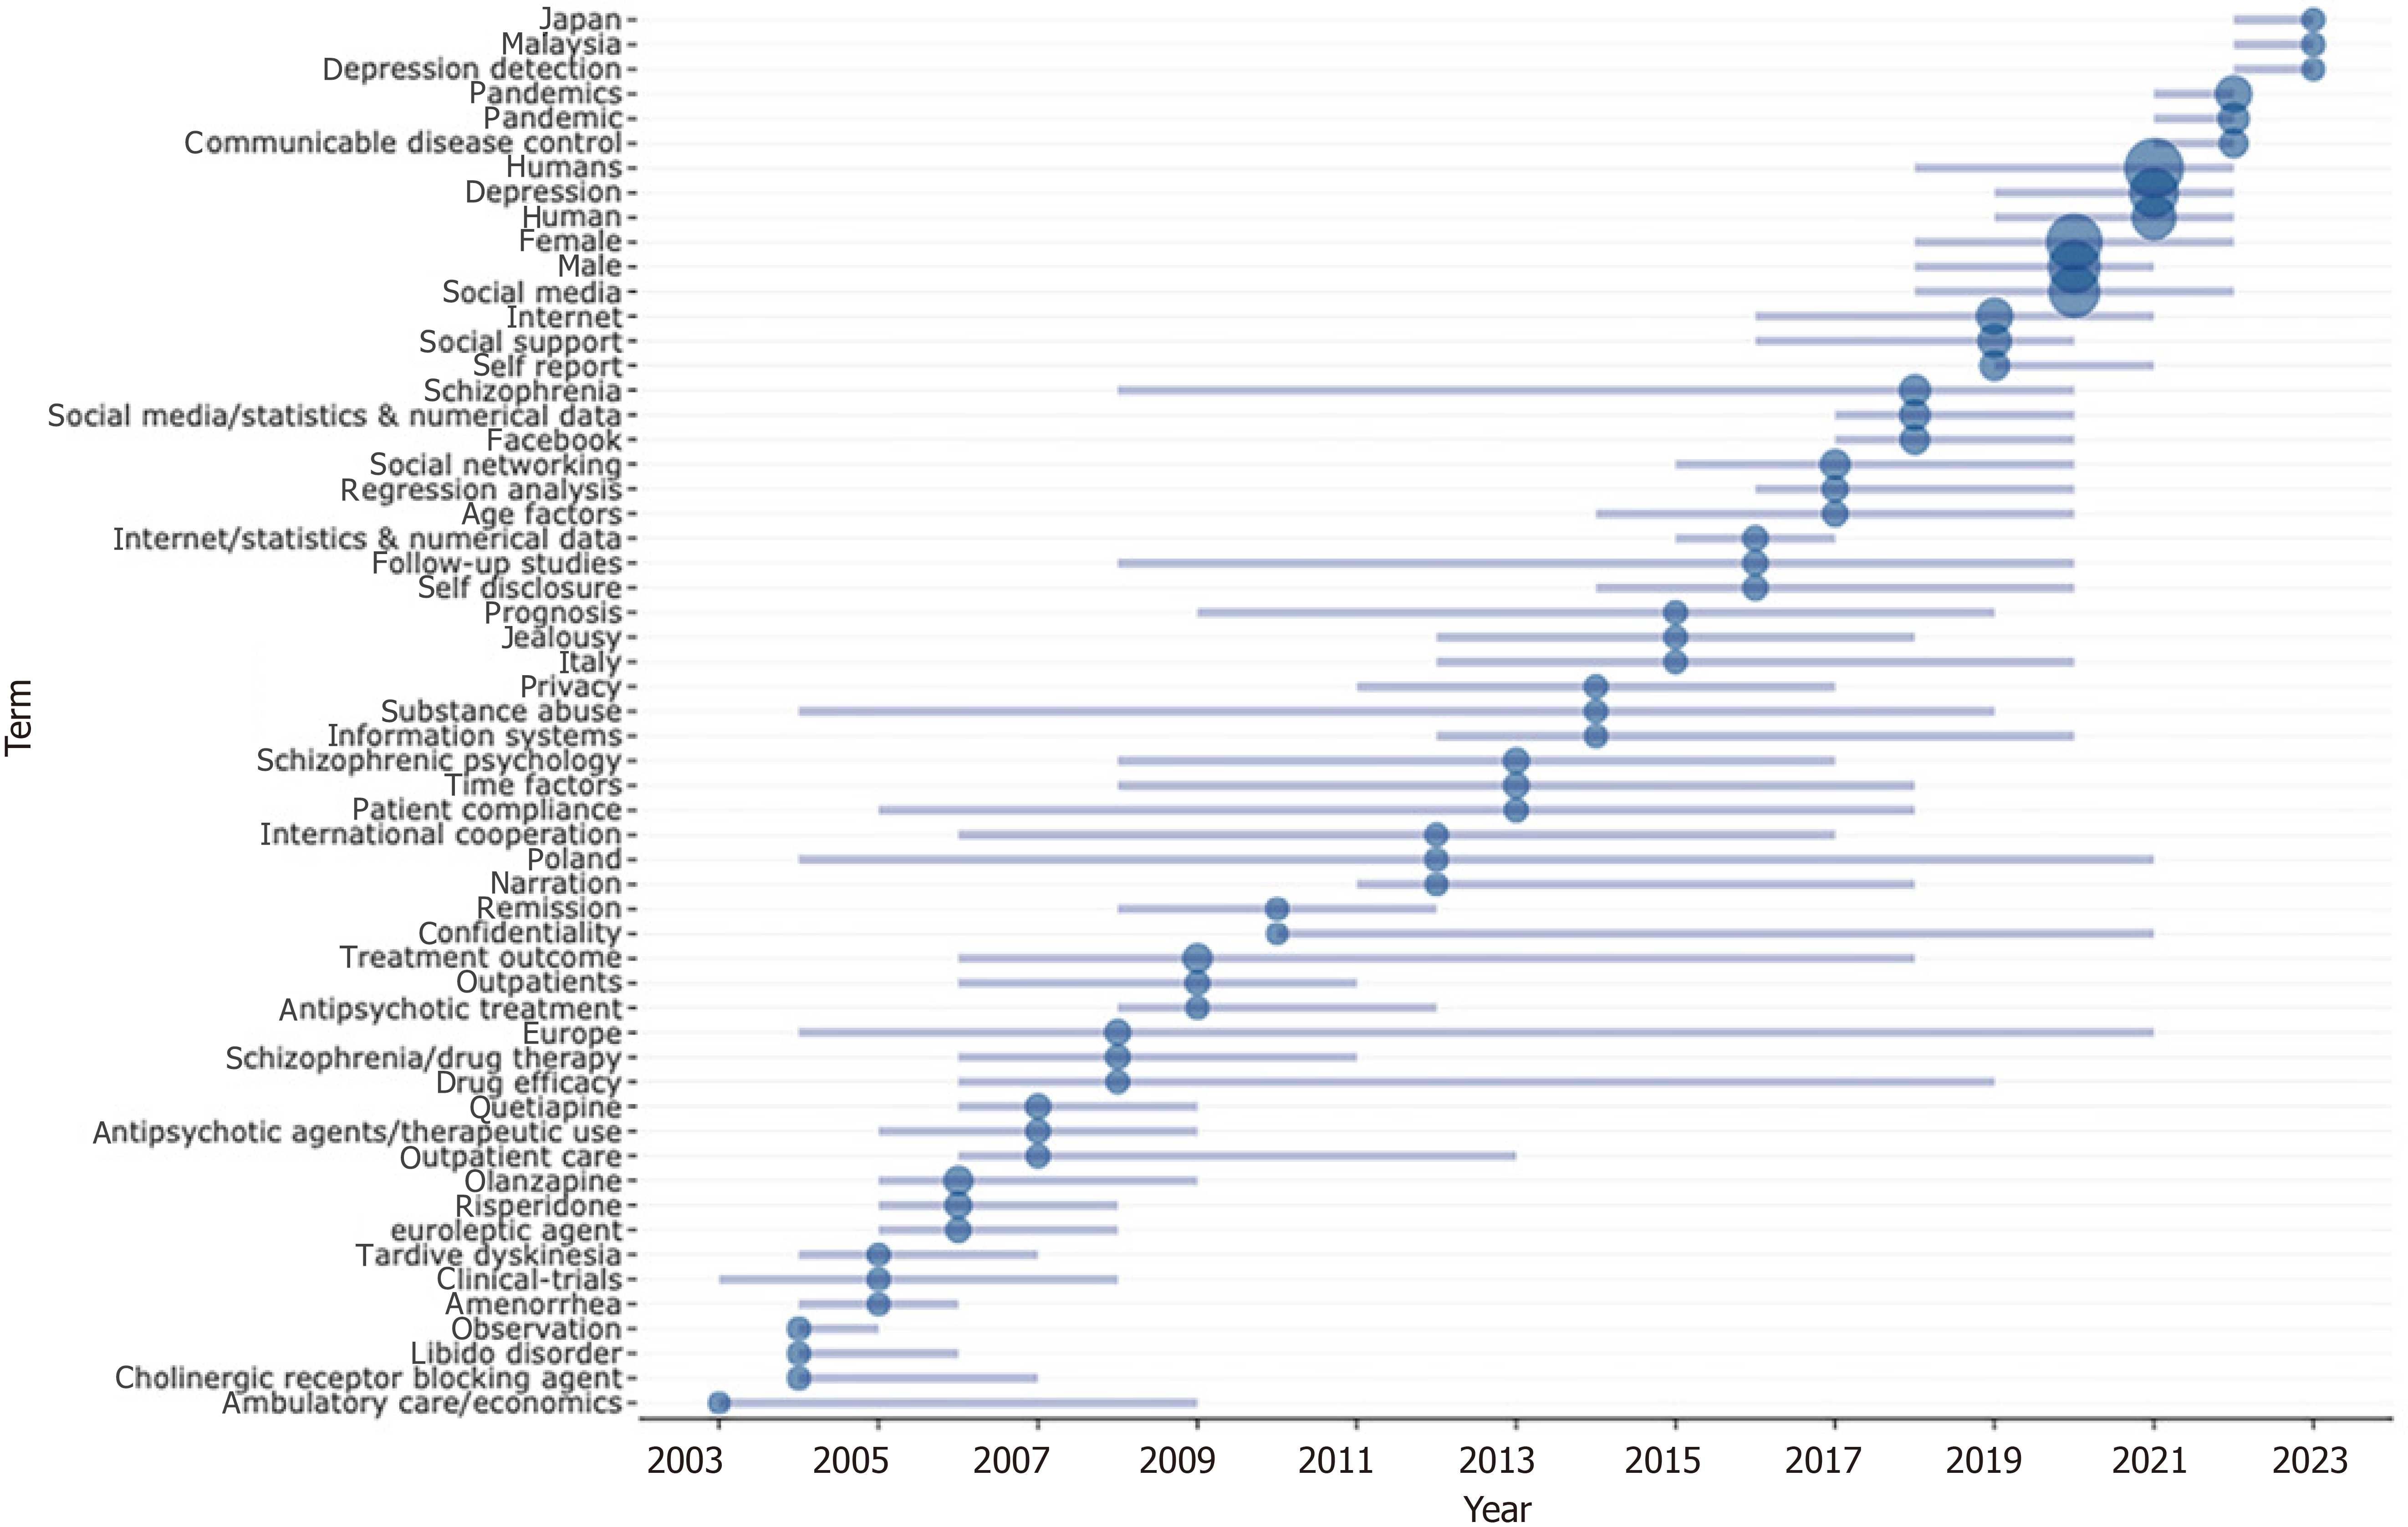
Figure 12 Trends in research on psychopathology and social media use.
- Citation: Zhang MD, He RQ, Luo JY, Huang WY, Wei JY, Dai J, Huang H, Yang Z, Kong JL, Chen G. Explosion of research on psychopathology and social media use after COVID-19: A scientometric study. World J Psychiatry 2024; 14(5): 742-759
- URL: https://www.wjgnet.com/2220-3206/full/v14/i5/742.htm
- DOI: https://dx.doi.org/10.5498/wjp.v14.i5.742


