Copyright
©The Author(s) 2024.
World J Psychiatry. May 19, 2024; 14(5): 644-652
Published online May 19, 2024. doi: 10.5498/wjp.v14.i5.644
Published online May 19, 2024. doi: 10.5498/wjp.v14.i5.644
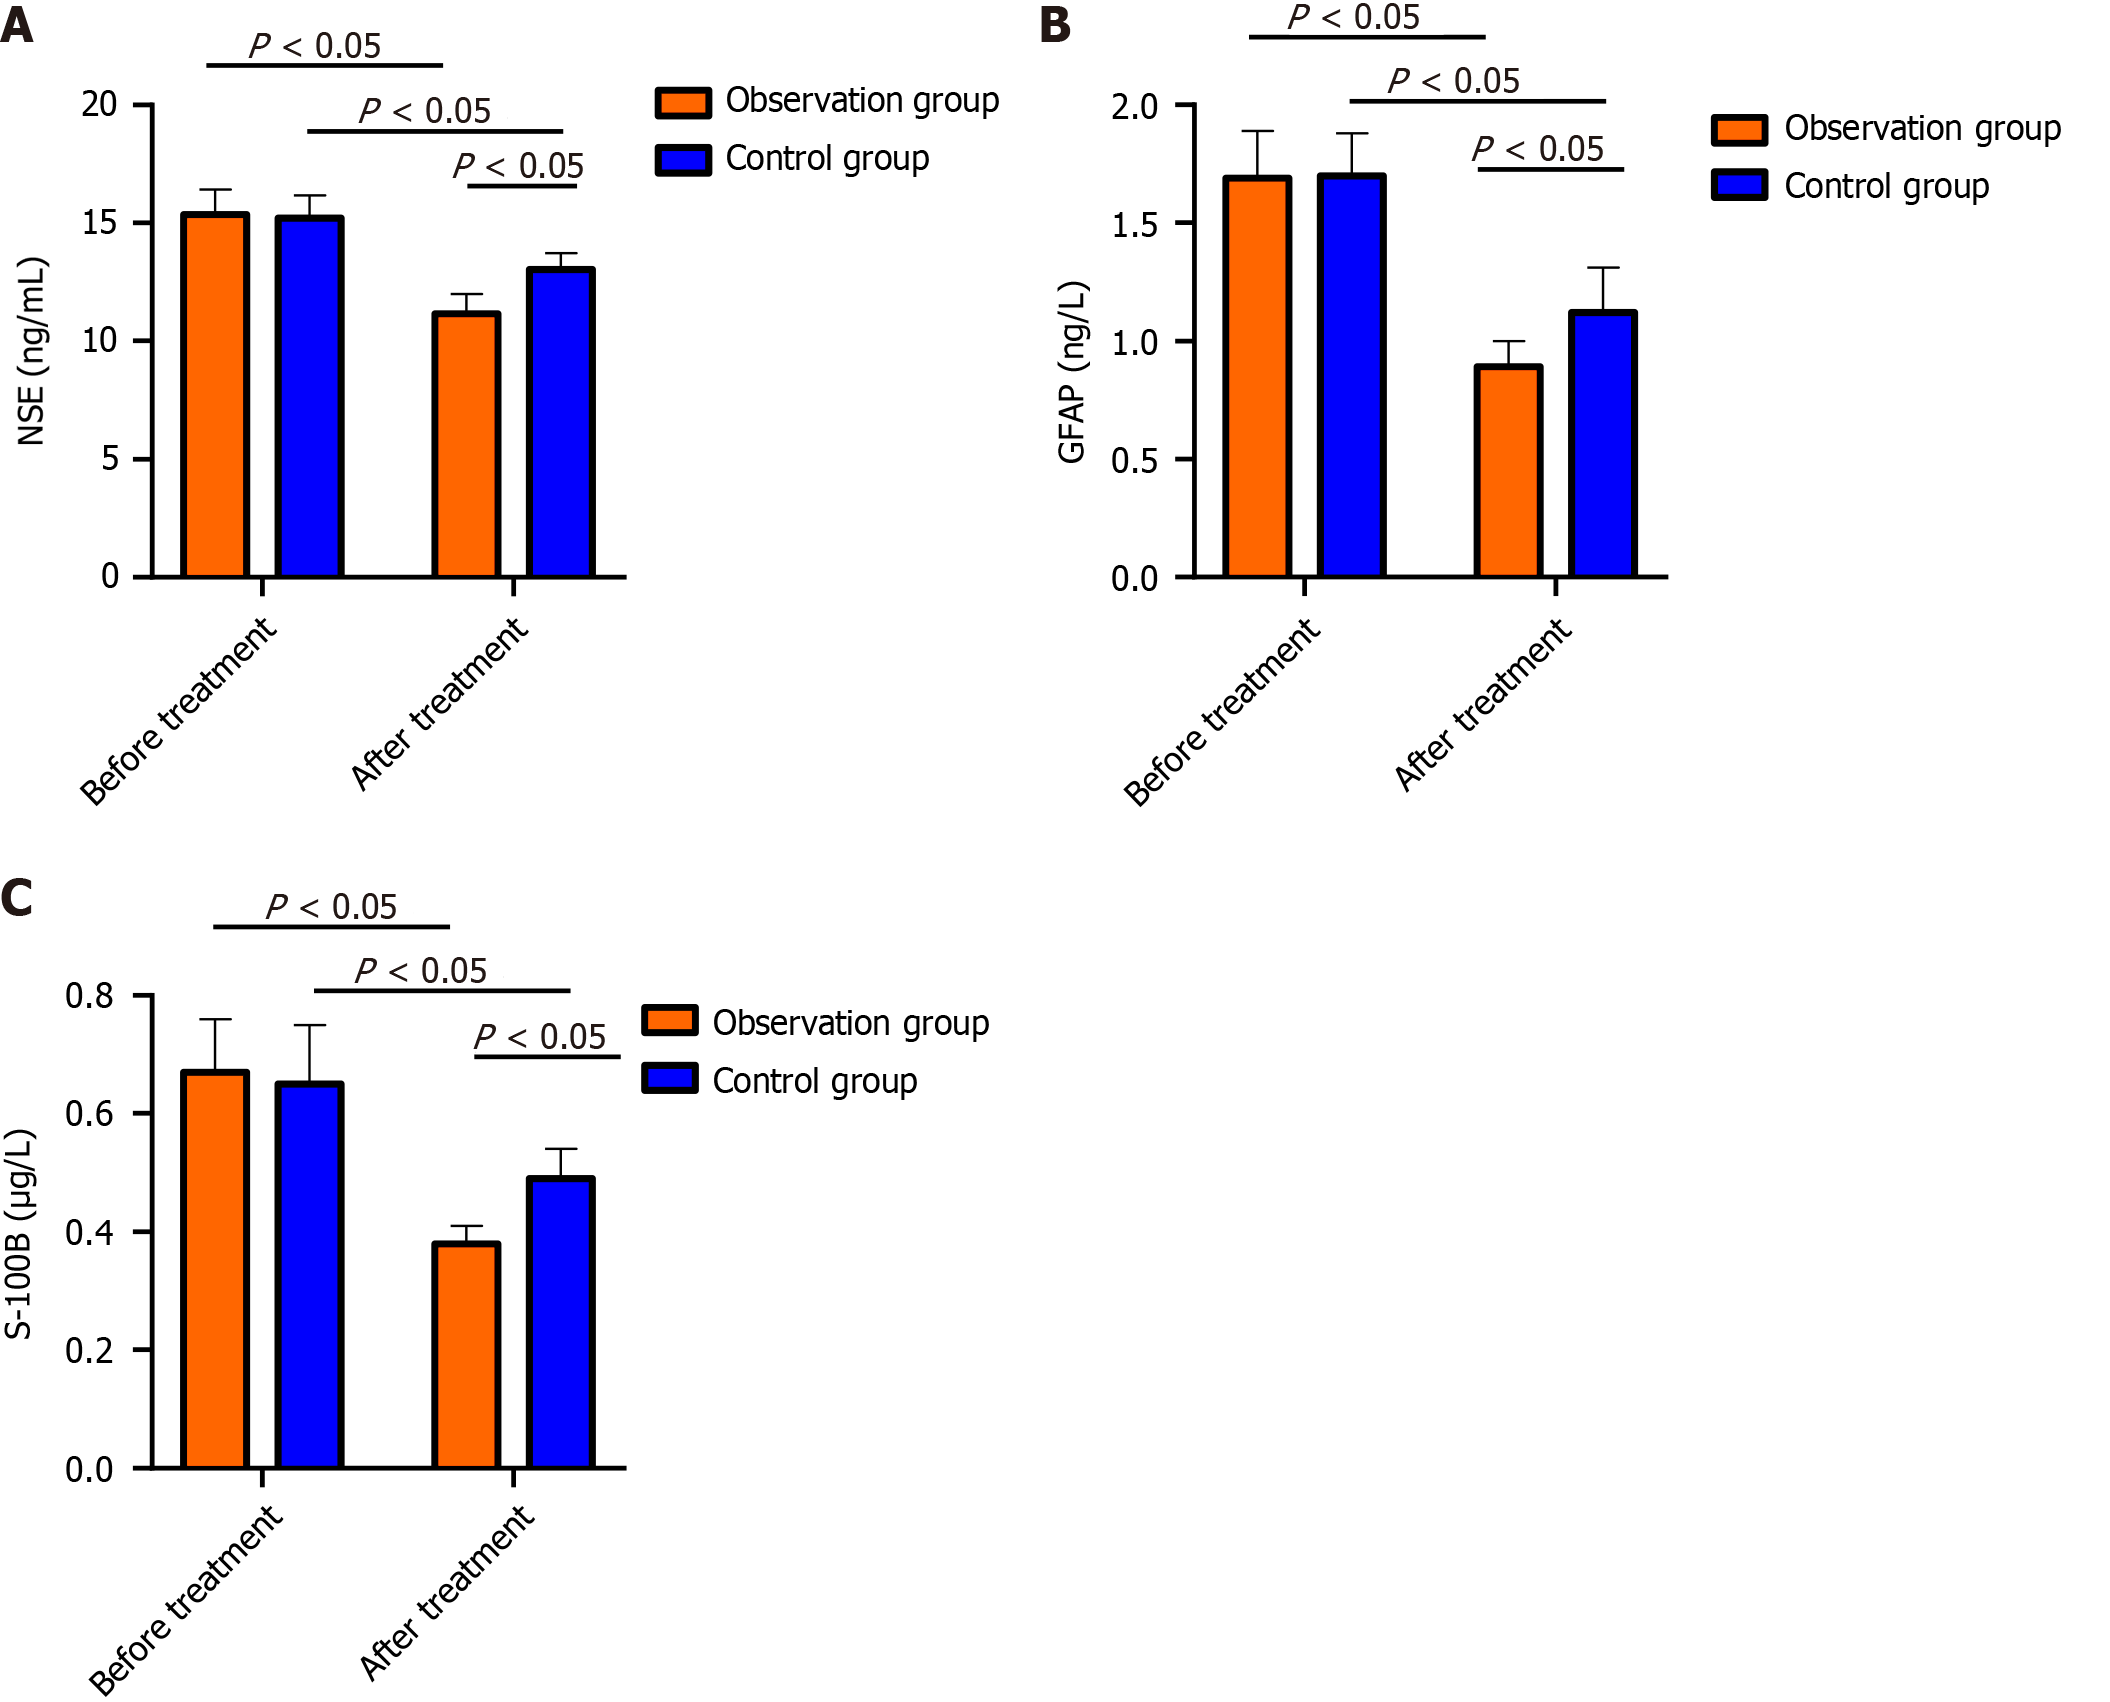
Figure 1 Comparison of neurological function factor levels.
A: Comparison of serum neuron-specific enolase; B: Comparison of serum gelatin fibrillary acidic protein; C: Comparison of serum S-100B. NSE: Neuron-specific enolase; GFAP: Gelatin fibrillary acidic protein.
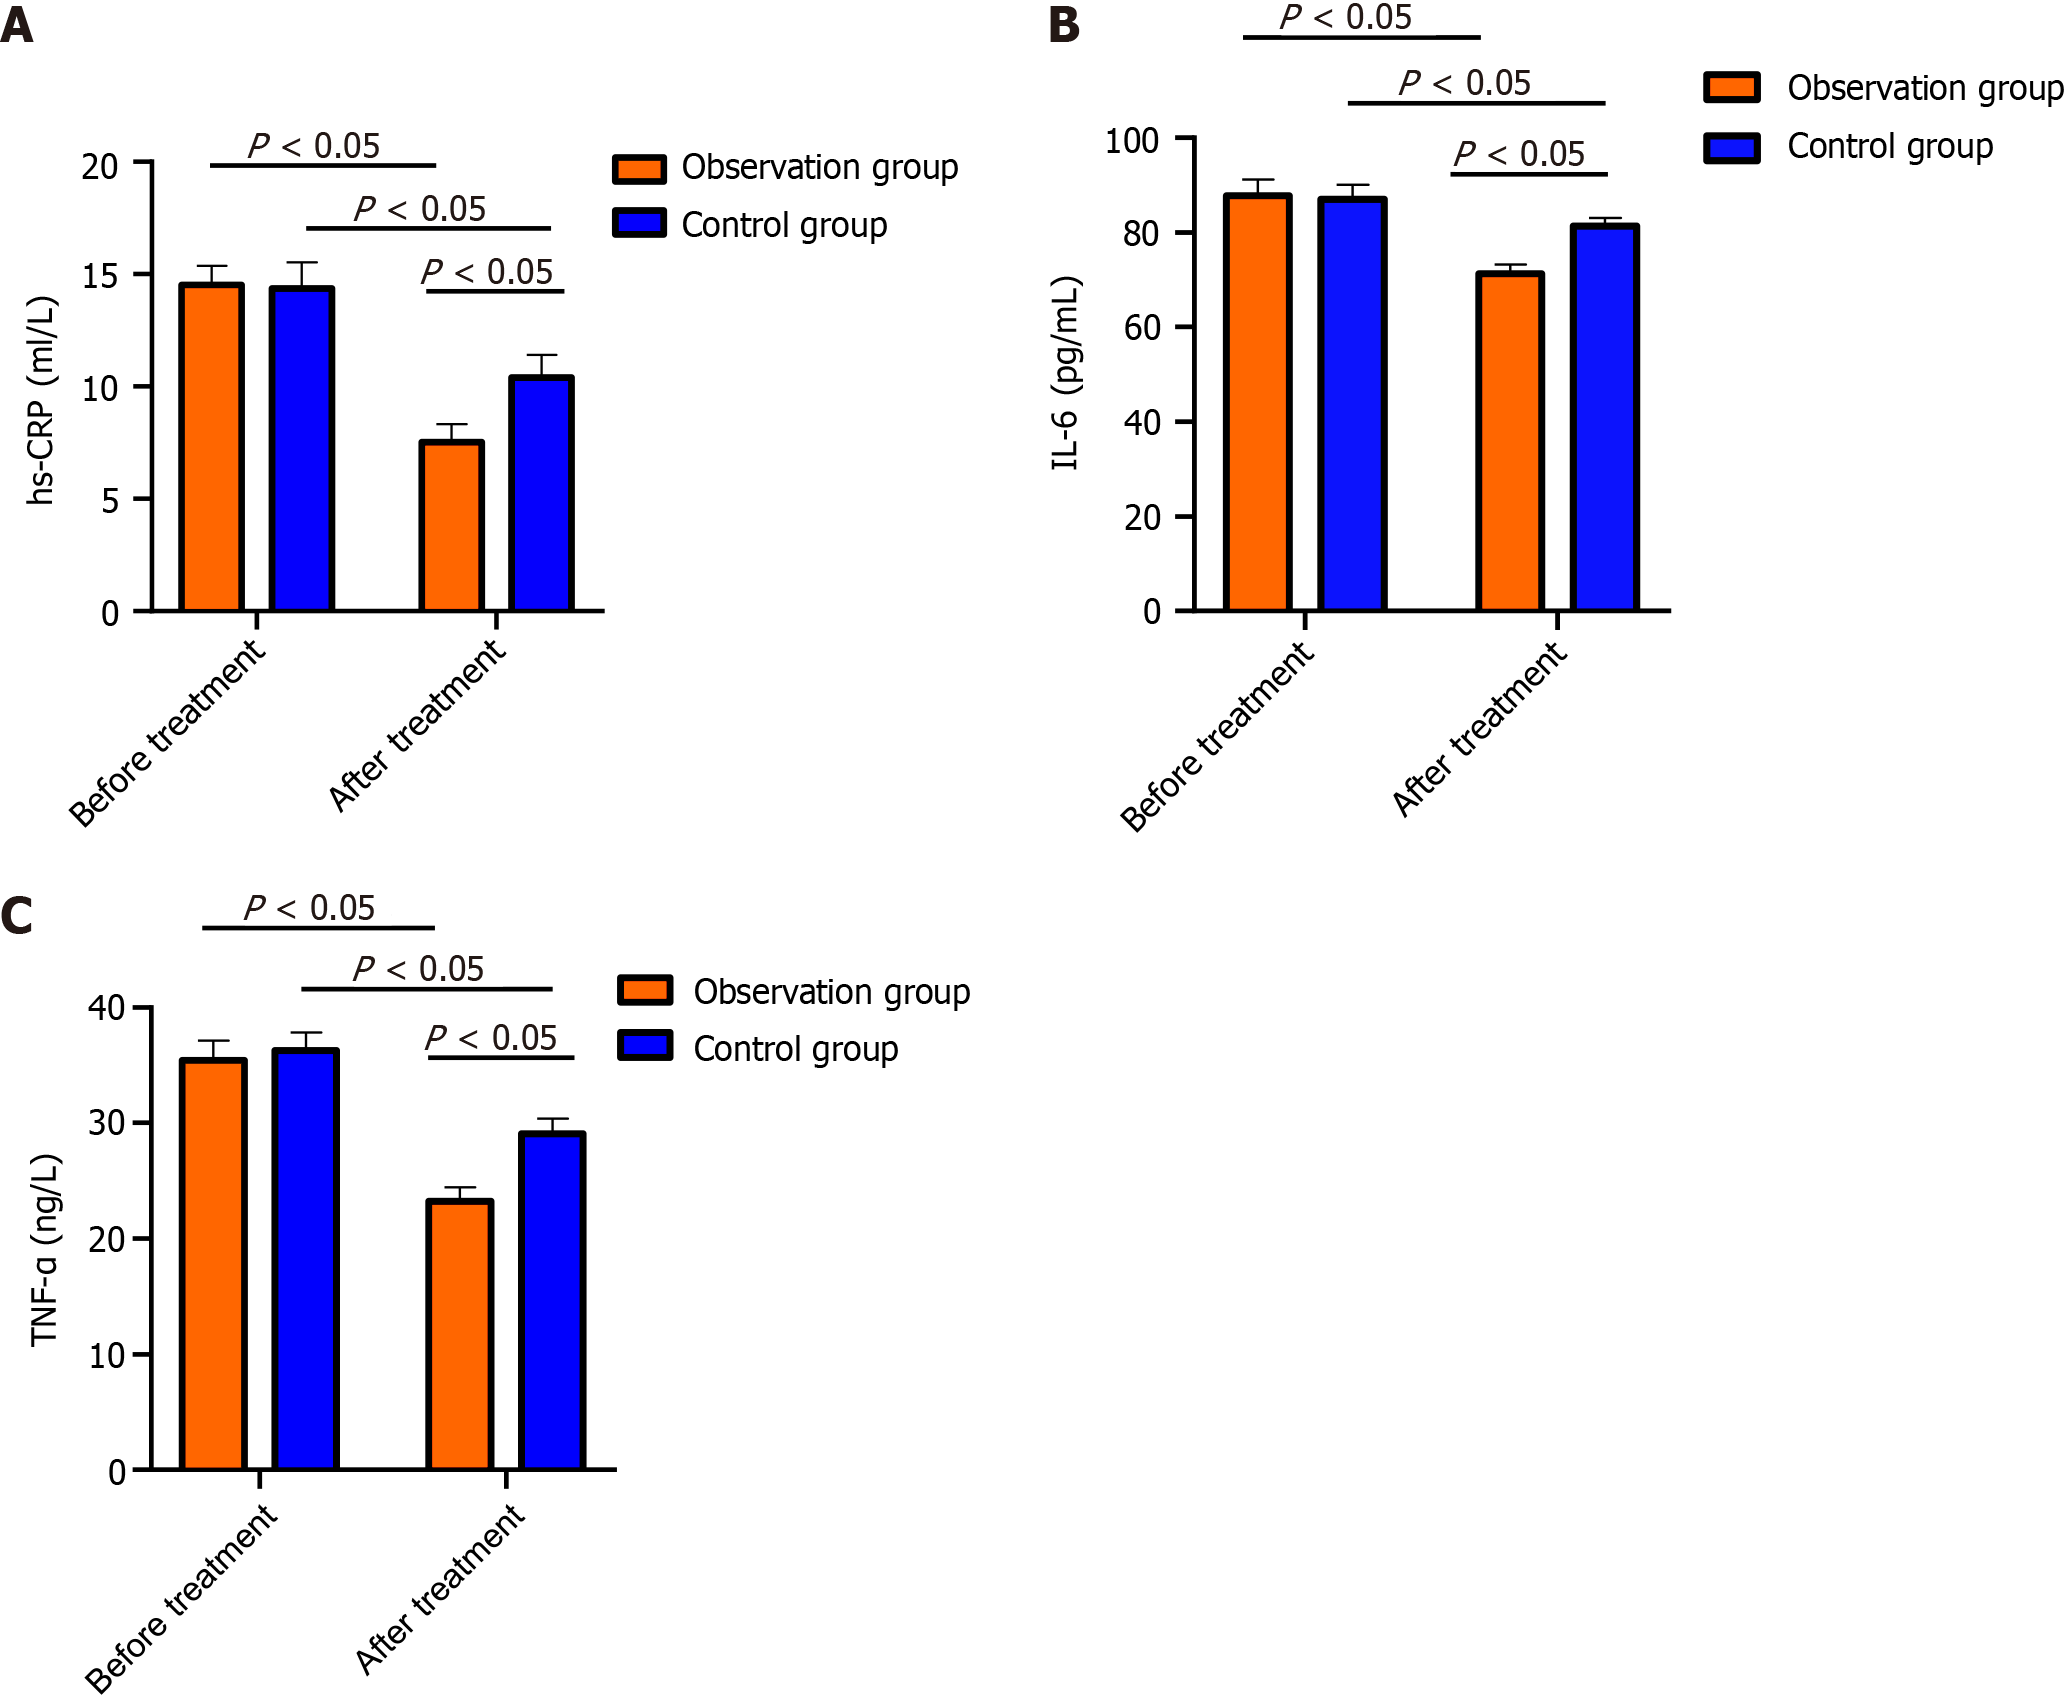
Figure 2 Comparison of serum inflammatory factors.
A: Comparison of serum high-sensitivity C-reactive protein; B: Comparison of serum interleukin 6; C: Comparison of serum tumor necrosis factor-α. hs-CRP: High-sensitivity C-reactive protein; IL-6: Interleukin 6; TNF-α: Tumor necrosis factor-α.
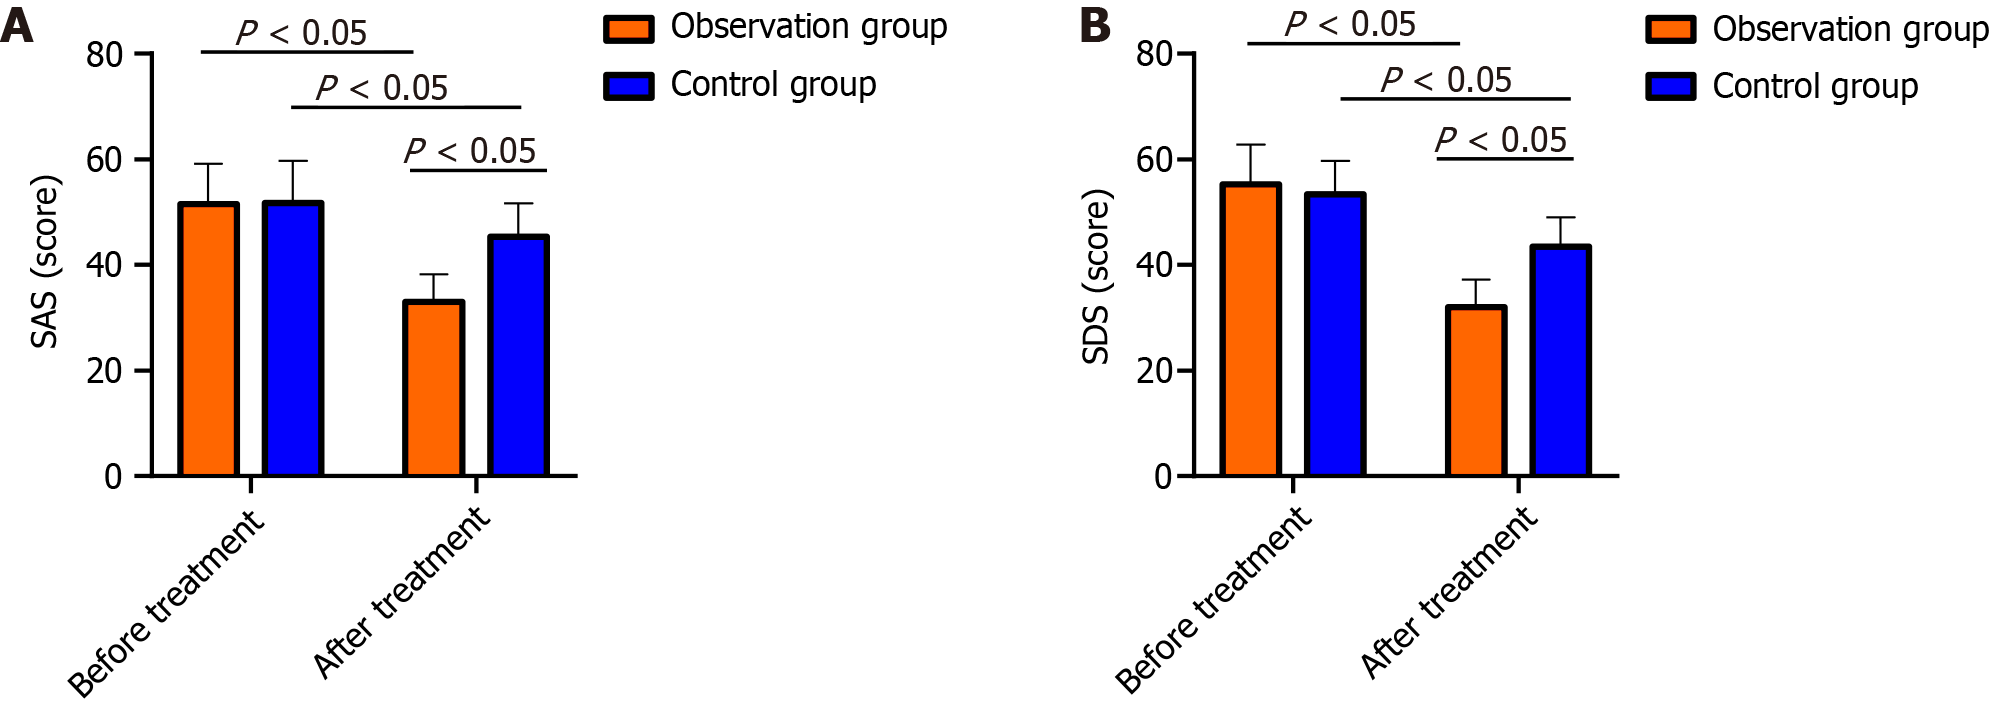
Figure 3 Comparison of anxiety and depression after treatment.
A: Comparison of Self-rating Depression Scale scores between groups; B: Comparison of Self-rating Anxiety Scale scores between groups. SAS: Self-rating Anxiety Scale; SDS: Self-rating Depression Scale.
- Citation: Wang TS, Jing LJ. Therapeutic effect and psychological impact of aspirin plus edaravone on patients with cerebral infarction. World J Psychiatry 2024; 14(5): 644-652
- URL: https://www.wjgnet.com/2220-3206/full/v14/i5/644.htm
- DOI: https://dx.doi.org/10.5498/wjp.v14.i5.644


