Copyright
©The Author(s) 2024.
World J Psychiatry. Mar 19, 2024; 14(3): 467-483
Published online Mar 19, 2024. doi: 10.5498/wjp.v14.i3.467
Published online Mar 19, 2024. doi: 10.5498/wjp.v14.i3.467
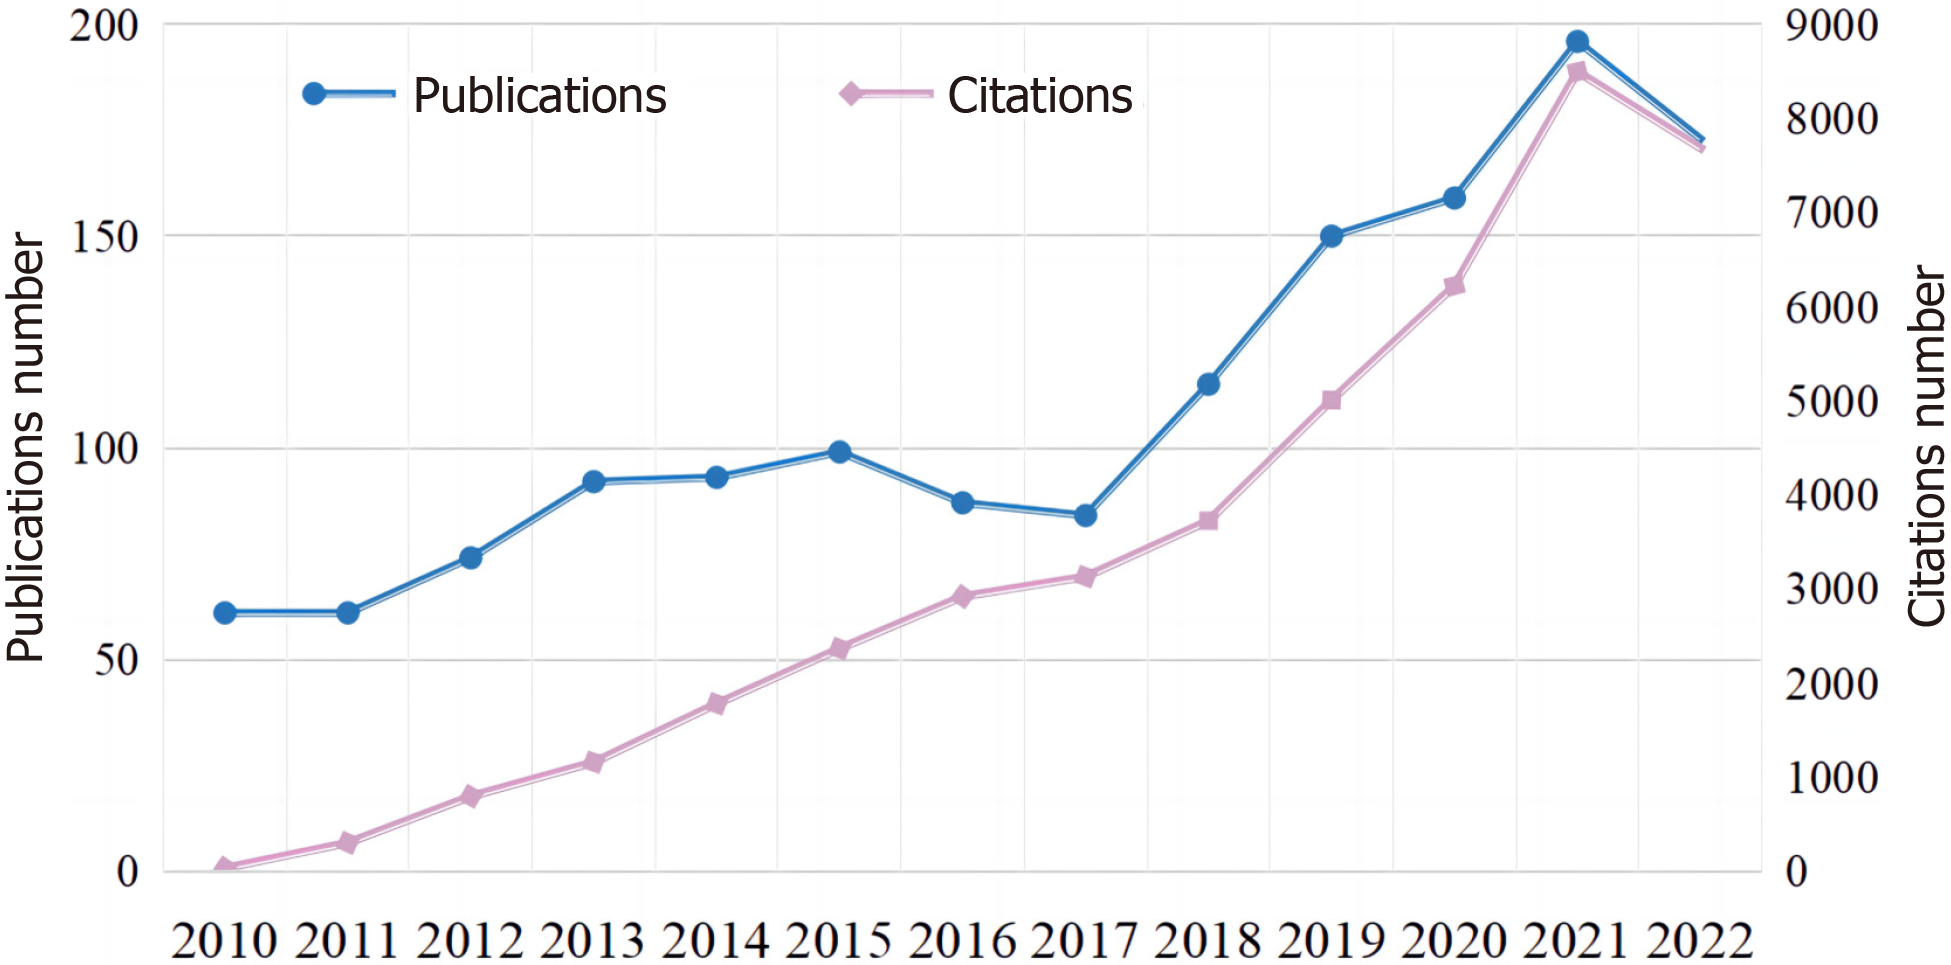
Figure 1 Annual publication outputs and citation trends regarding psychological interventions for depression in children and adolescents from 2010 to 2023.
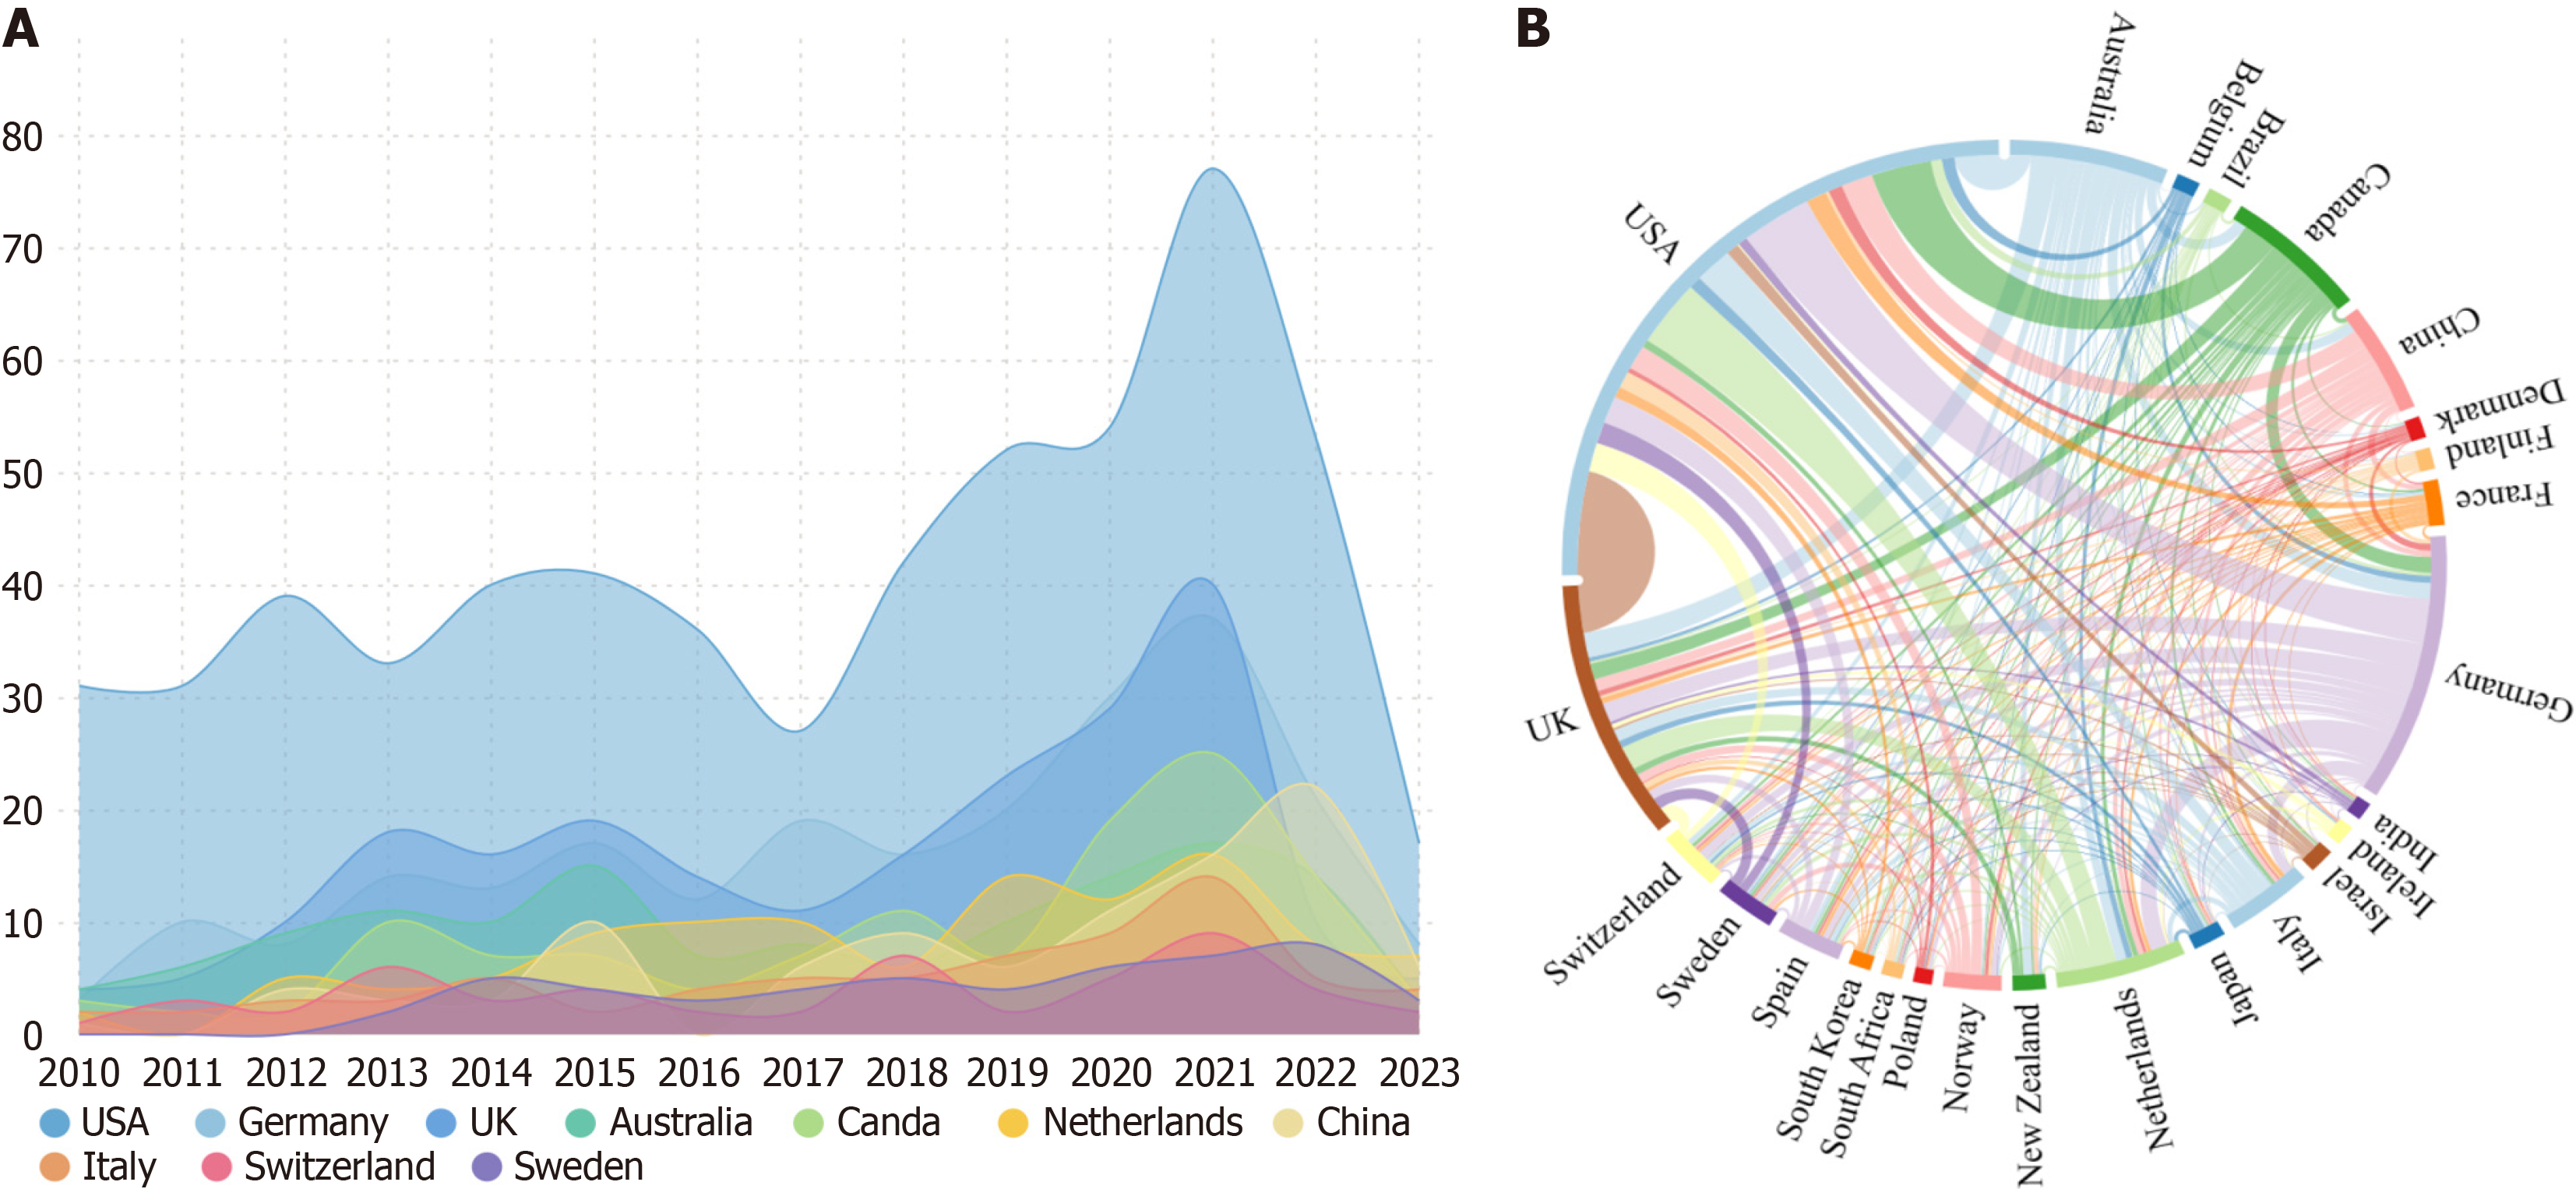
Figure 2 Visualization of country analysis.
A: Annual number of publications in the top 10 most productive countries; B: International collaboration analysis among different countries.
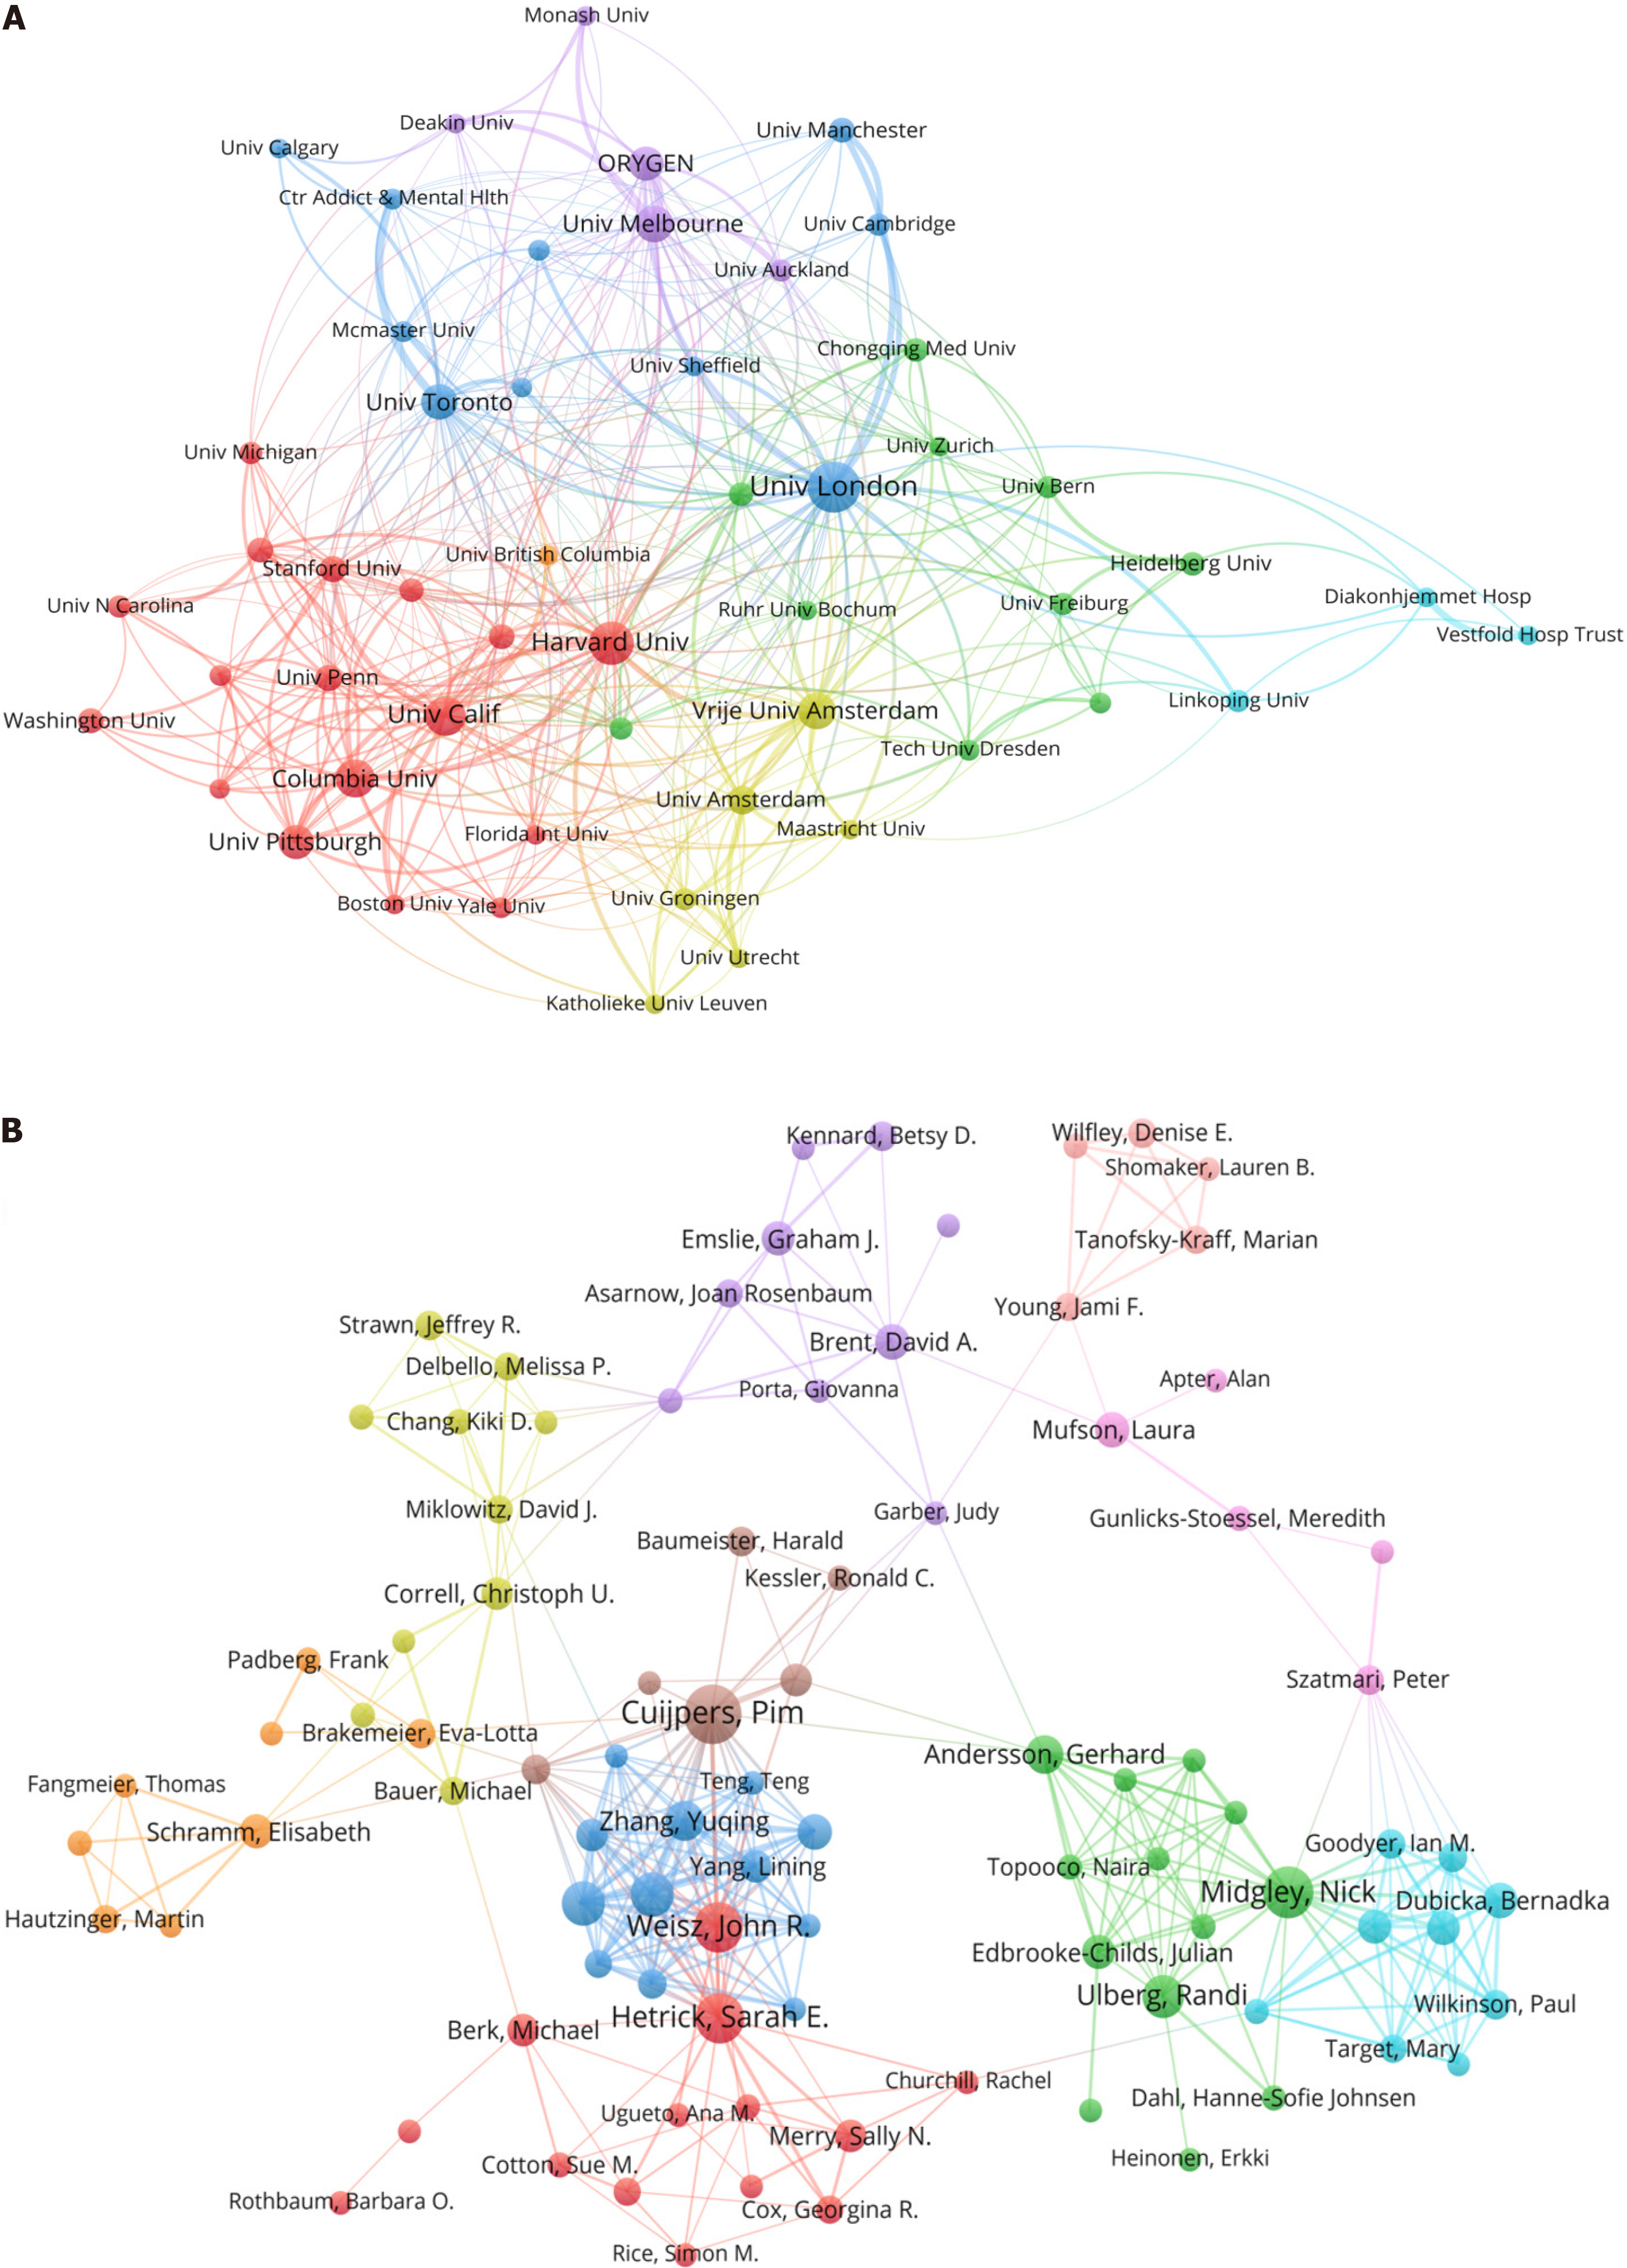
Figure 3 Visualization of institution and author analysis.
A: Network visualization map of institution collaboration analysis; B: Network visualization map of author collaboration analysis.
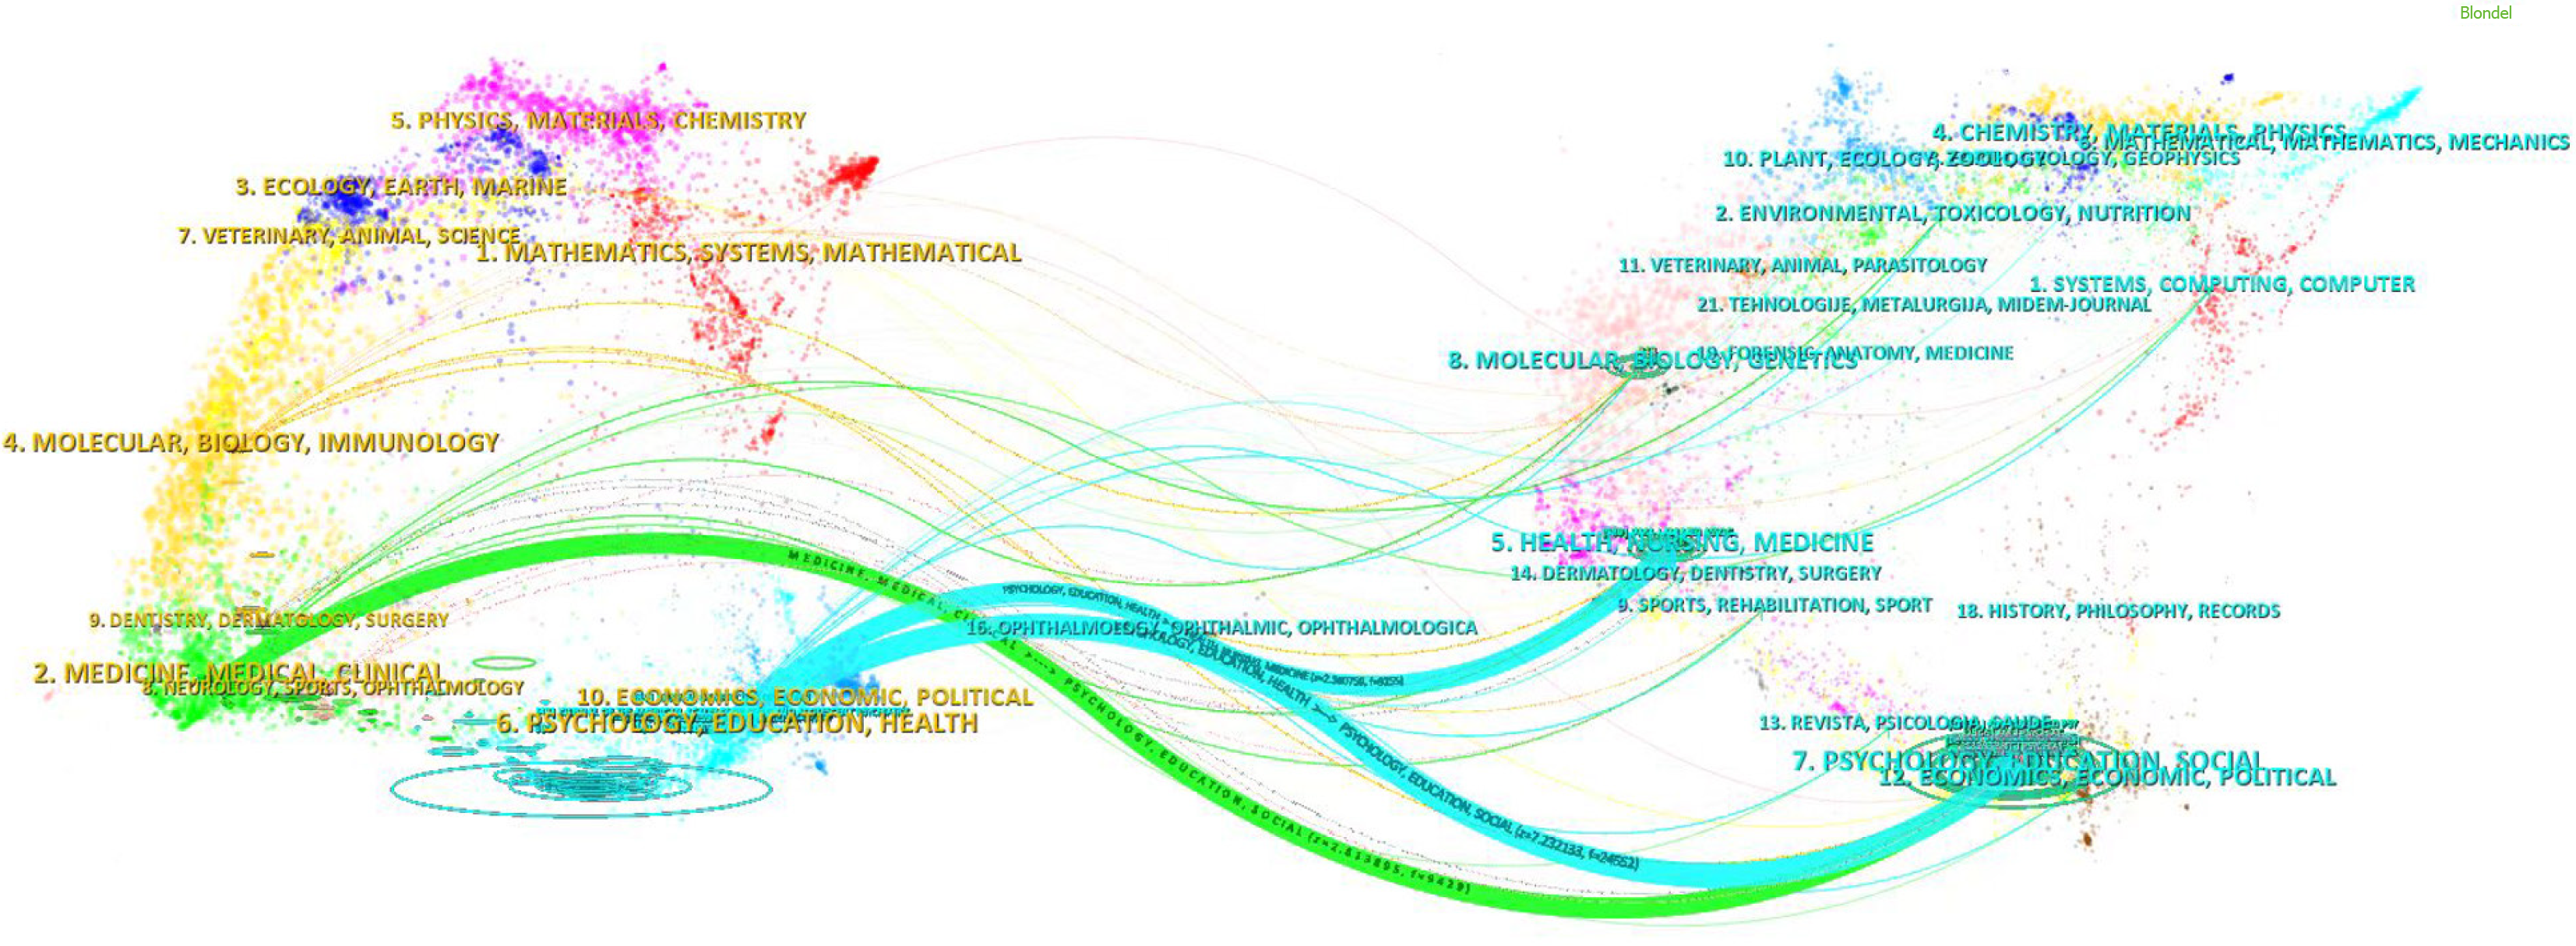
Figure 4 Dual-map overlay of academic journals.
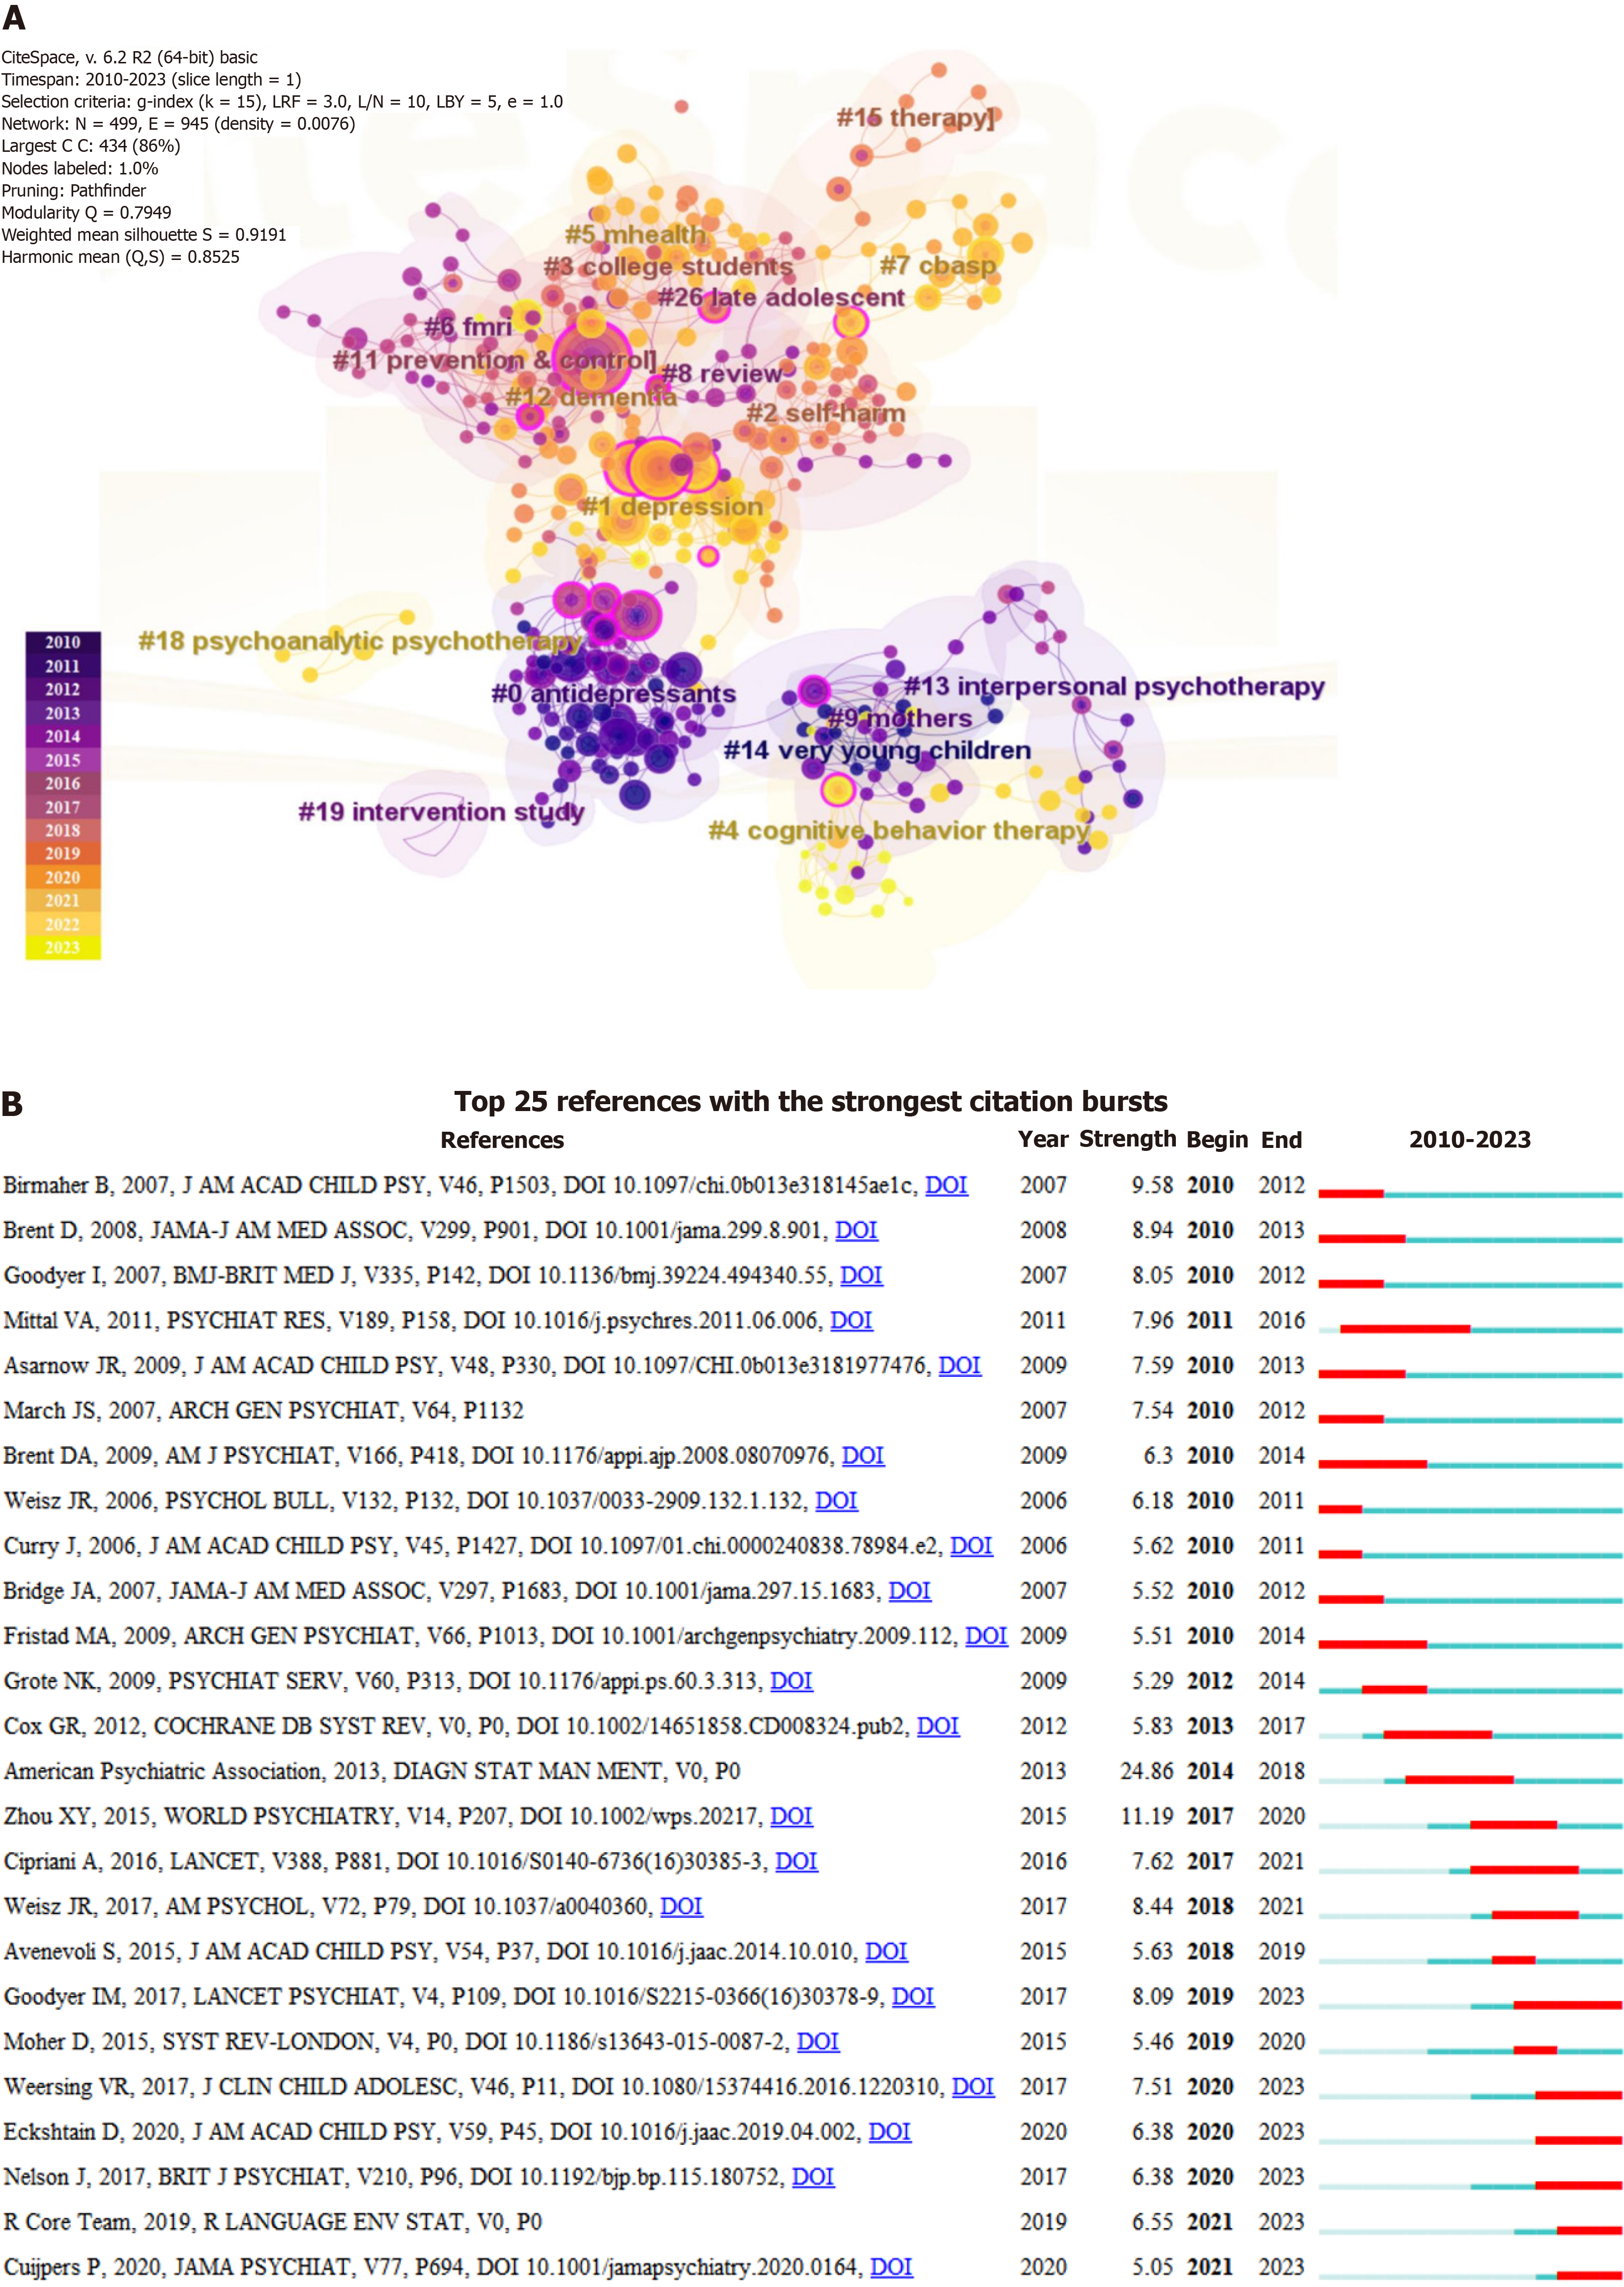
Figure 5 Visualization of reference co-citation analysis.
A: Network visualization map of reference co-citation cluster analysis; B: Top 25 references with the strongest citation bursts.
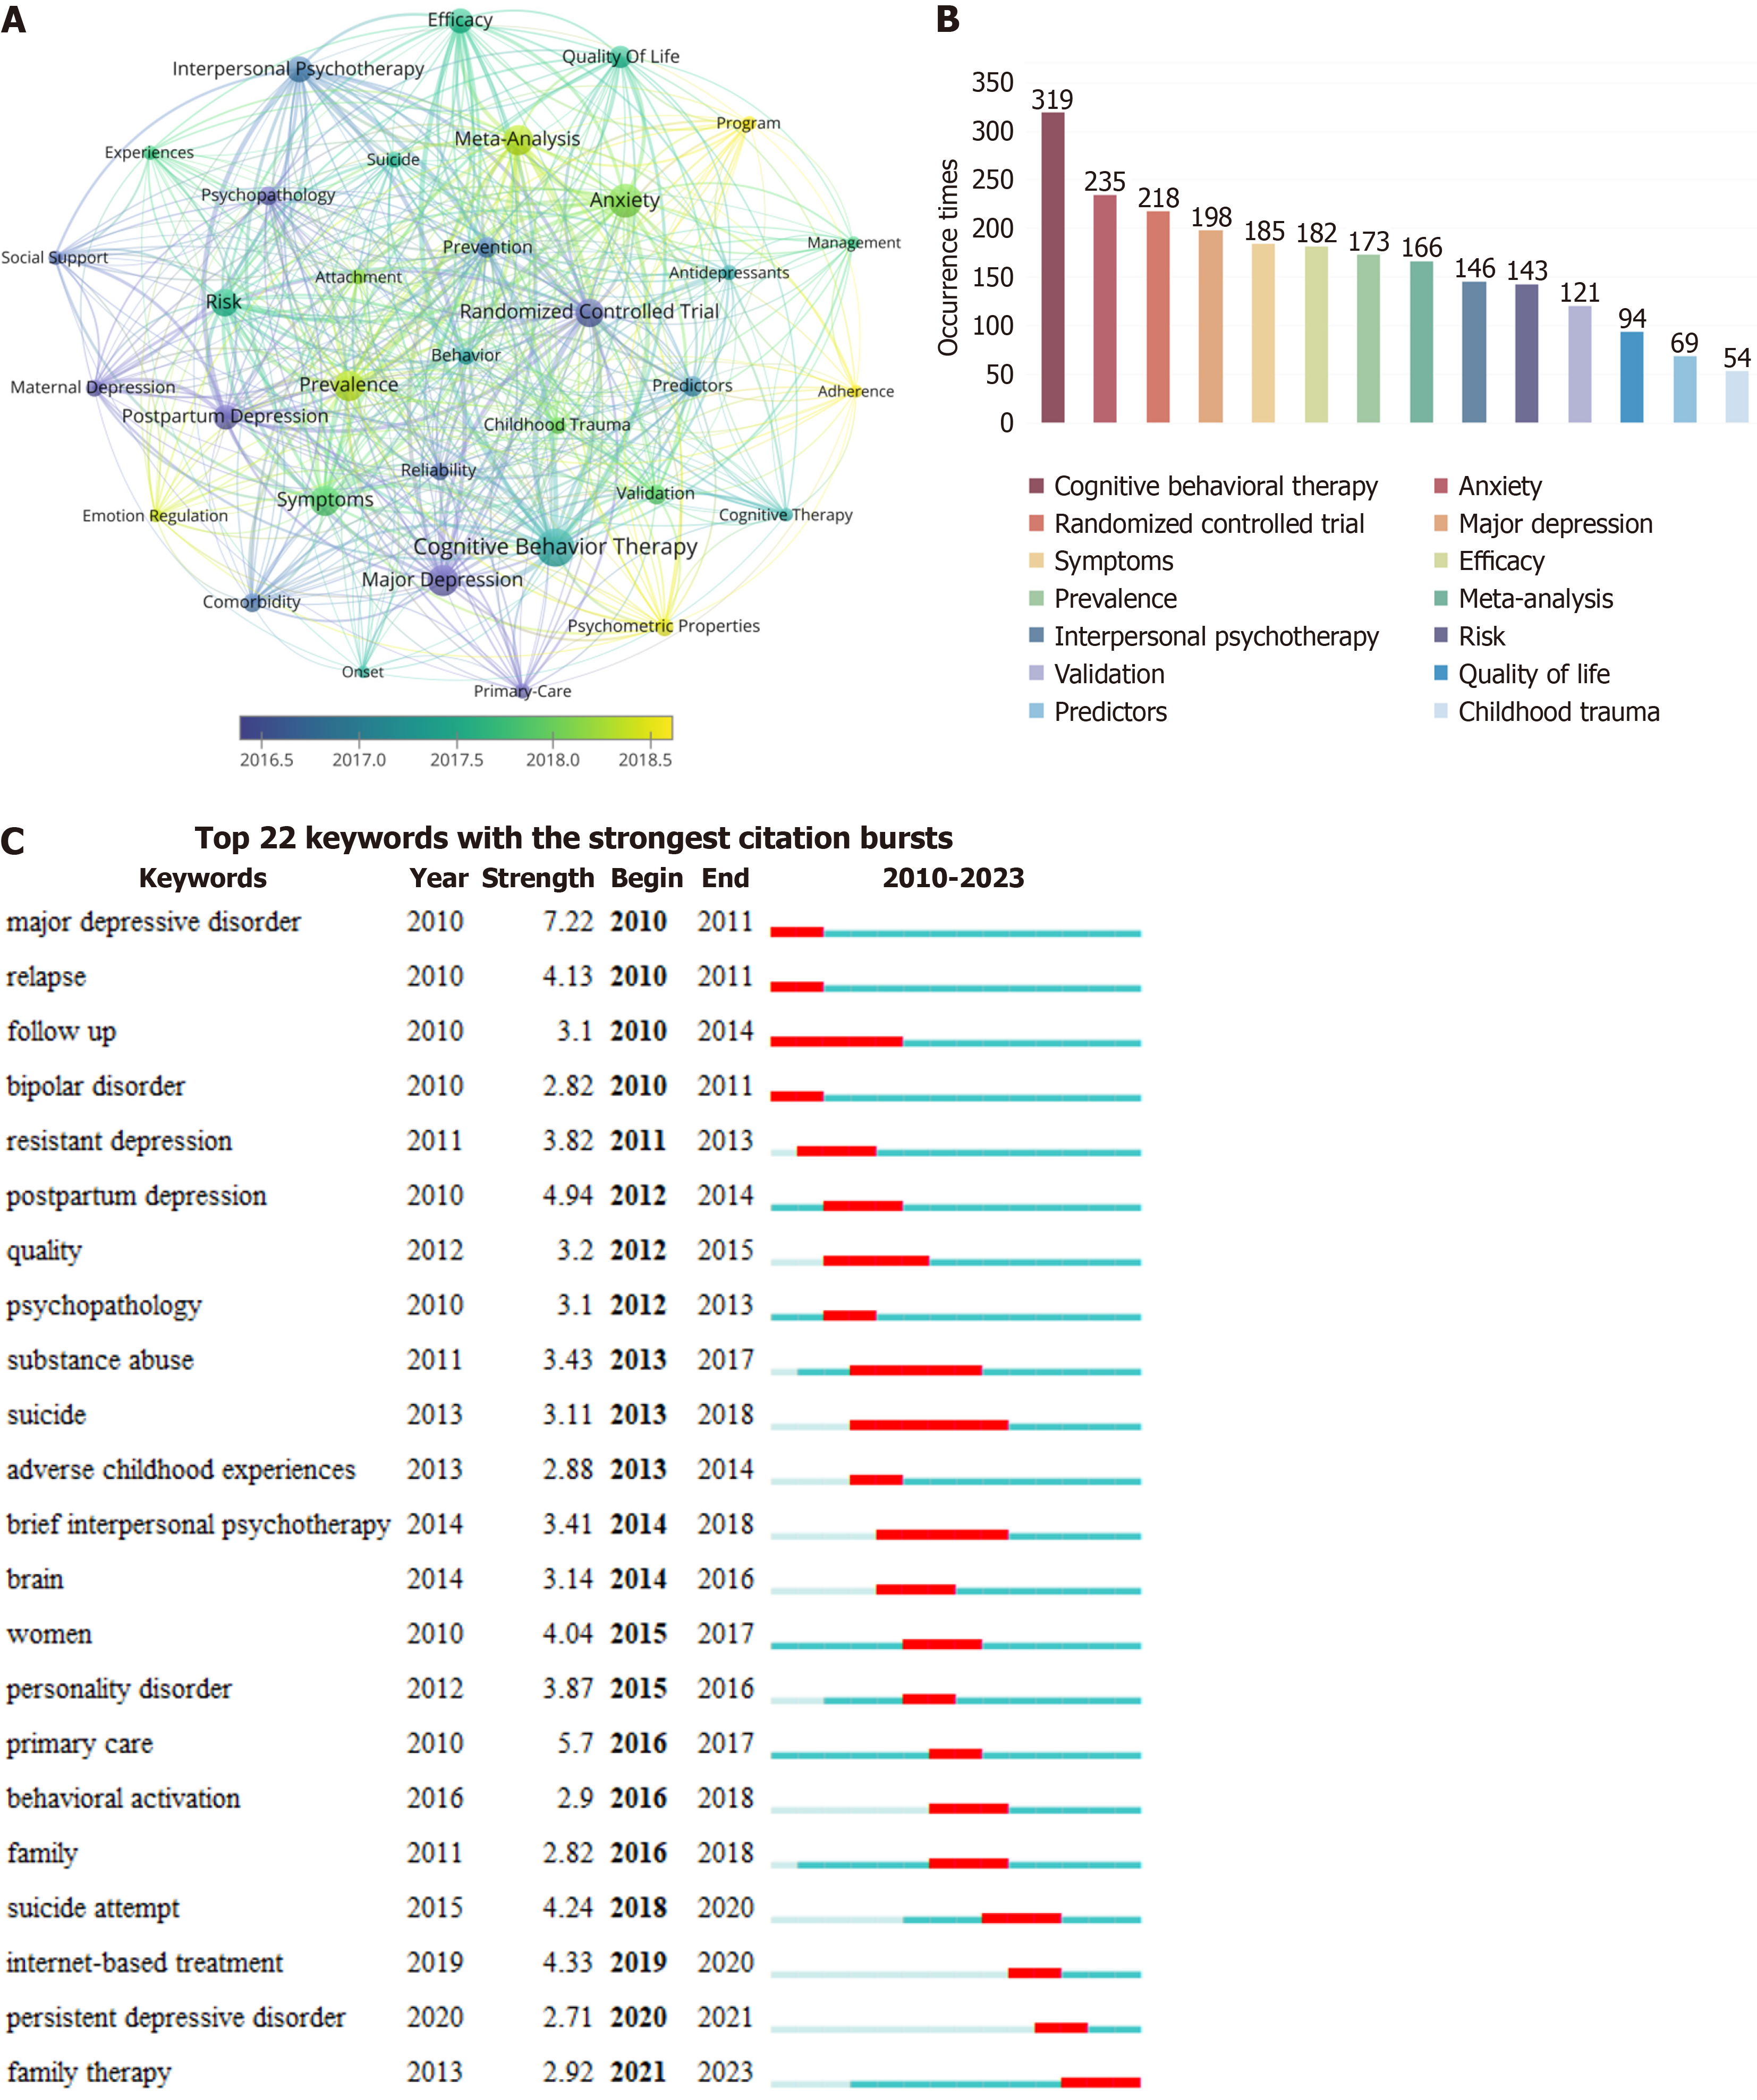
Figure 6 Visualization of keyword co-occurrence analysis.
A: Network visualization map of keyword co-occurrence analysis; B: Top 15 keywords with the largest occurrence times; C: Top 22 keywords with the strongest citation bursts.
- Citation: Wang N, Kong JQ, Bai N, Zhang HY, Yin M. Psychological interventions for depression in children and adolescents: A bibliometric analysis. World J Psychiatry 2024; 14(3): 467-483
- URL: https://www.wjgnet.com/2220-3206/full/v14/i3/467.htm
- DOI: https://dx.doi.org/10.5498/wjp.v14.i3.467


