Copyright
©The Author(s) 2024.
World J Psychiatry. Mar 19, 2024; 14(3): 445-455
Published online Mar 19, 2024. doi: 10.5498/wjp.v14.i3.445
Published online Mar 19, 2024. doi: 10.5498/wjp.v14.i3.445
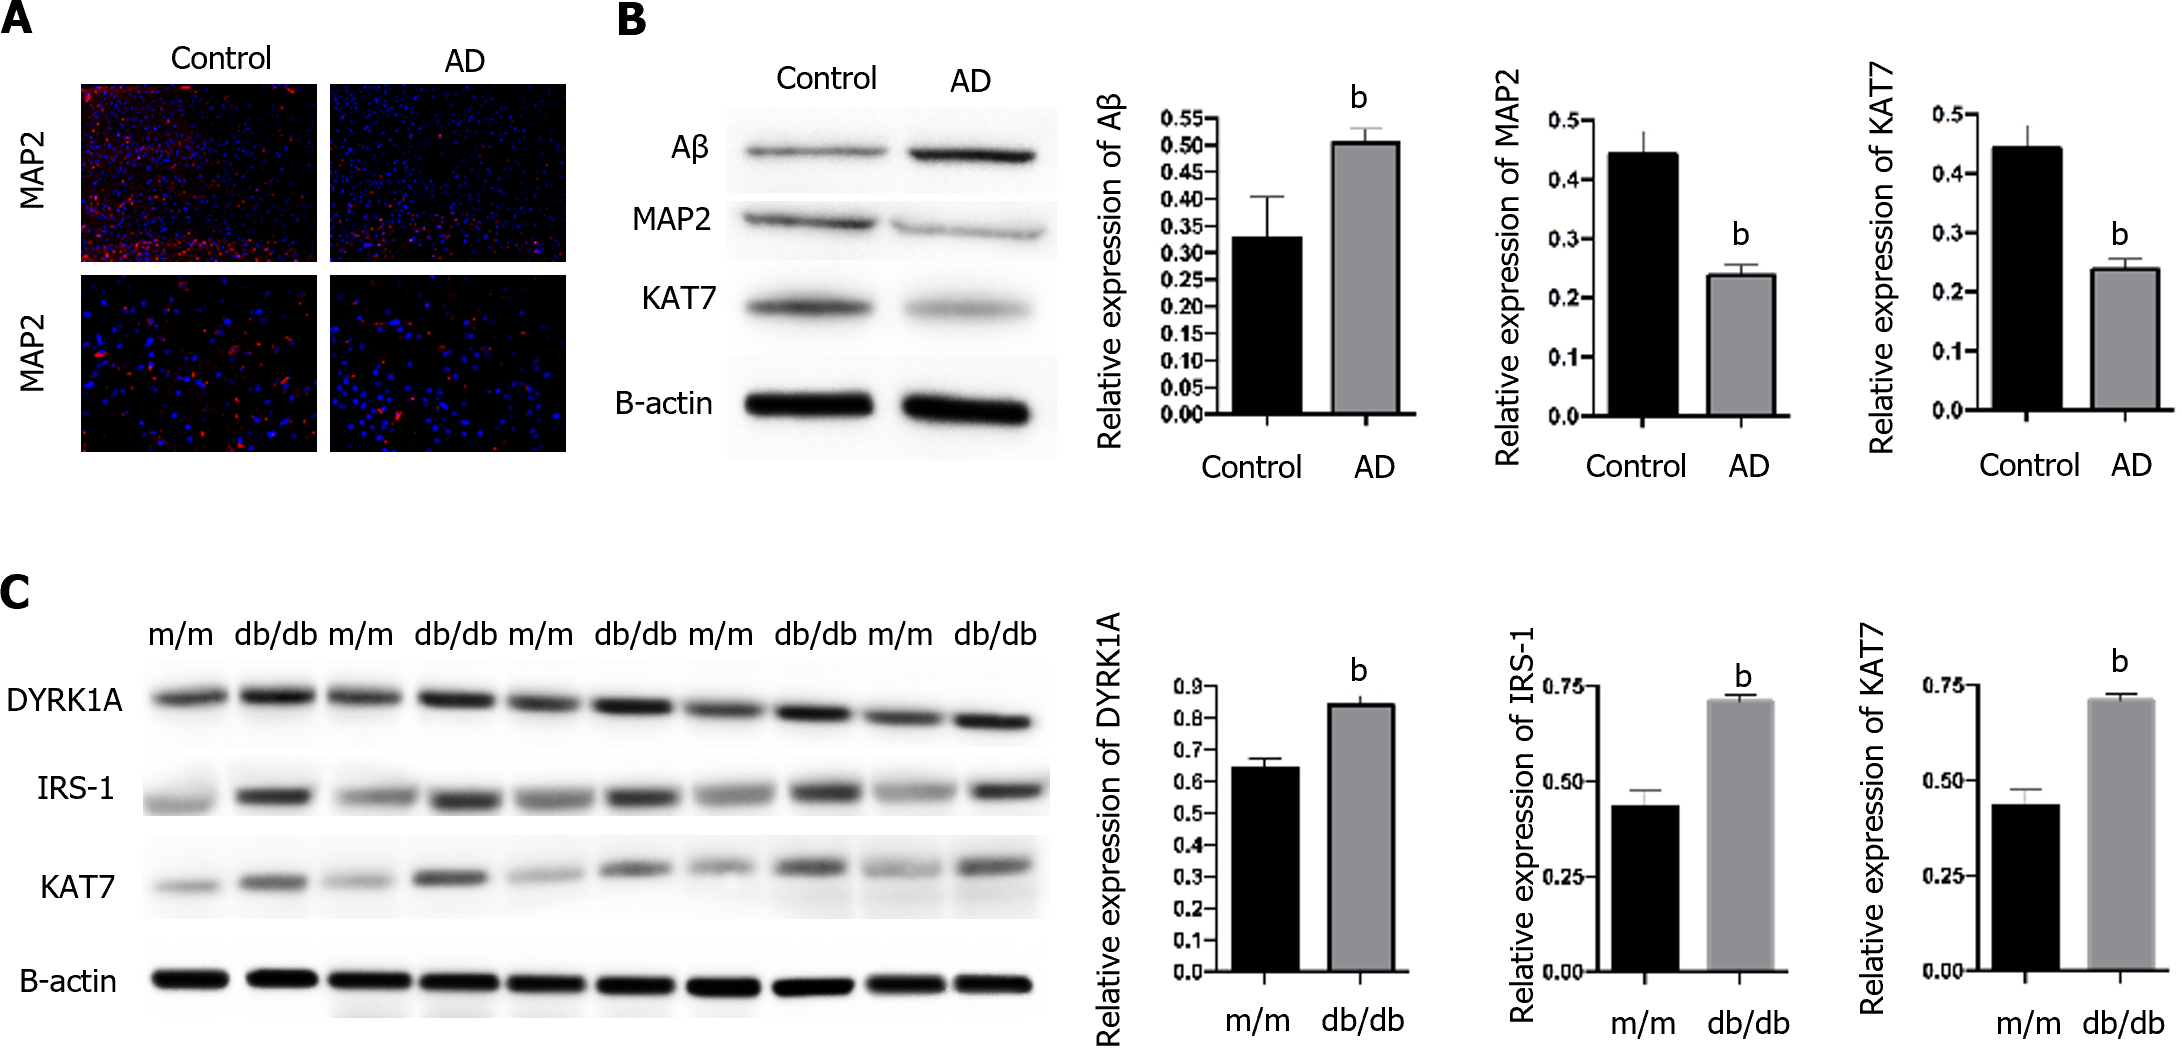
Figure 1 KAT7 expression is correlated with Alzheimer’s disease and insulin resistance.
A: Immunofluorescence staining of MAP2 in brain tissues form Alzheimer’s disease mice and control. Blue, nuclei; Red, MAP2; B: Western blotting assay to evaluate the expression of MAP2, Aβ, and KAT7 in brain tissues. Histogram of relative protein expression in brain tissues form Alzheimer’s disease mice and control; C: Western blotting assay to evaluate the expression of dual-specificity tyrosine phosphorylation-regulated kinase-1A, IRS-1, and KAT7 in brain tissues of diabetic mice (db/db) and control mice (m/m). Histogram of relative protein expression. bP < 0.01. AD: Alzheimer’s disease. DYRK1A: Dual-specificity tyrosine phosphorylation-regulated kinase-1A.
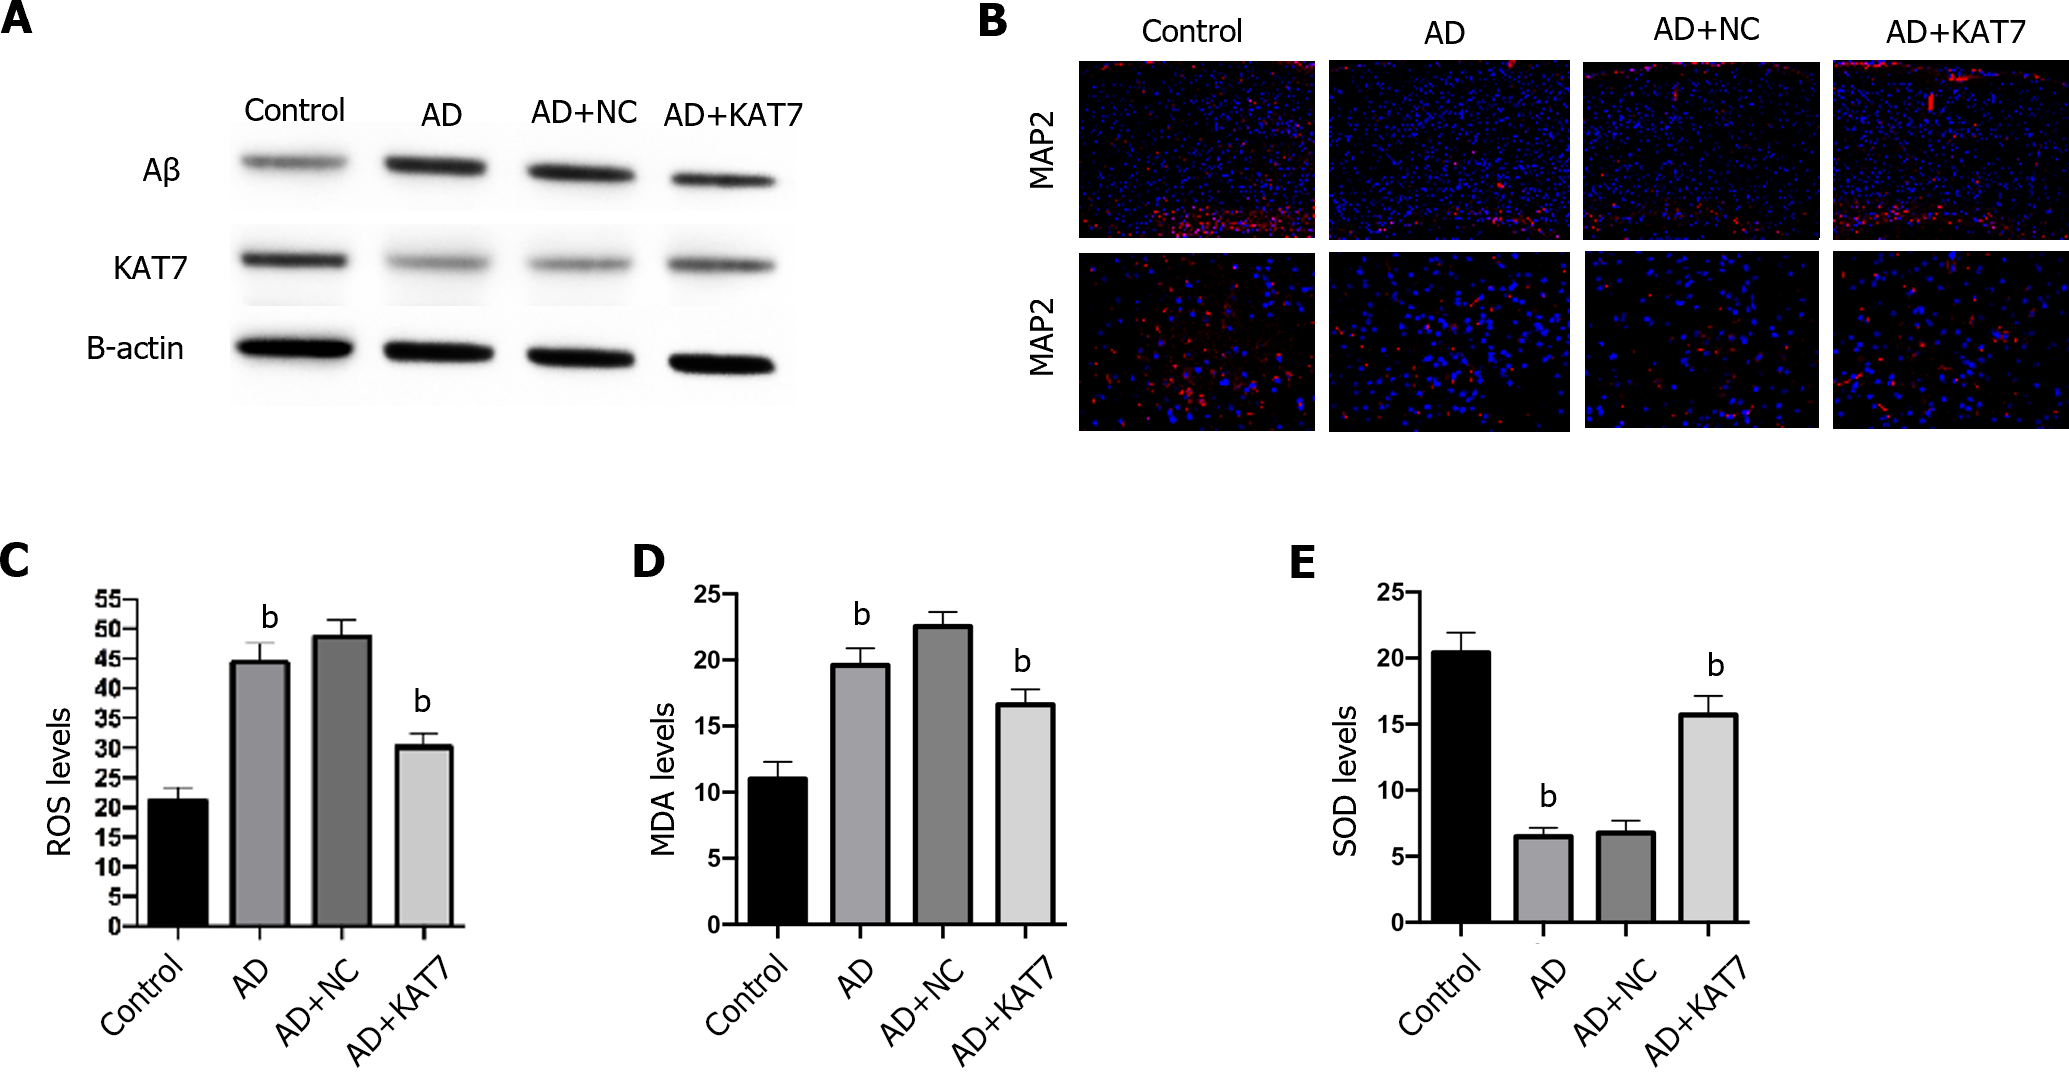
Figure 2 KAT7 alleviated Alzheimer’s disease-induced neurological damages in vivo.
A: Western blotting assay to evaluate the expression of KAT7 and Aβ in brain tissues; B: Immunofluorescence staining of microtubule-associated protein 2 in brain tissues; C: Evaluation of oxidative biomarkers reactive oxygen species in brain tissues; D: Evaluation of oxidative biomarkers malondialdehyde in brain tissues; E: Evaluation of oxidative biomarkers SOD activity in brain tissues. bP < 0.01. MDA: Malondialdehyde; ROS: Reactive oxygen species; AD: Alzheimer’s disease; NC: Negative control; MAP2: Microtubule-associated protein 2.
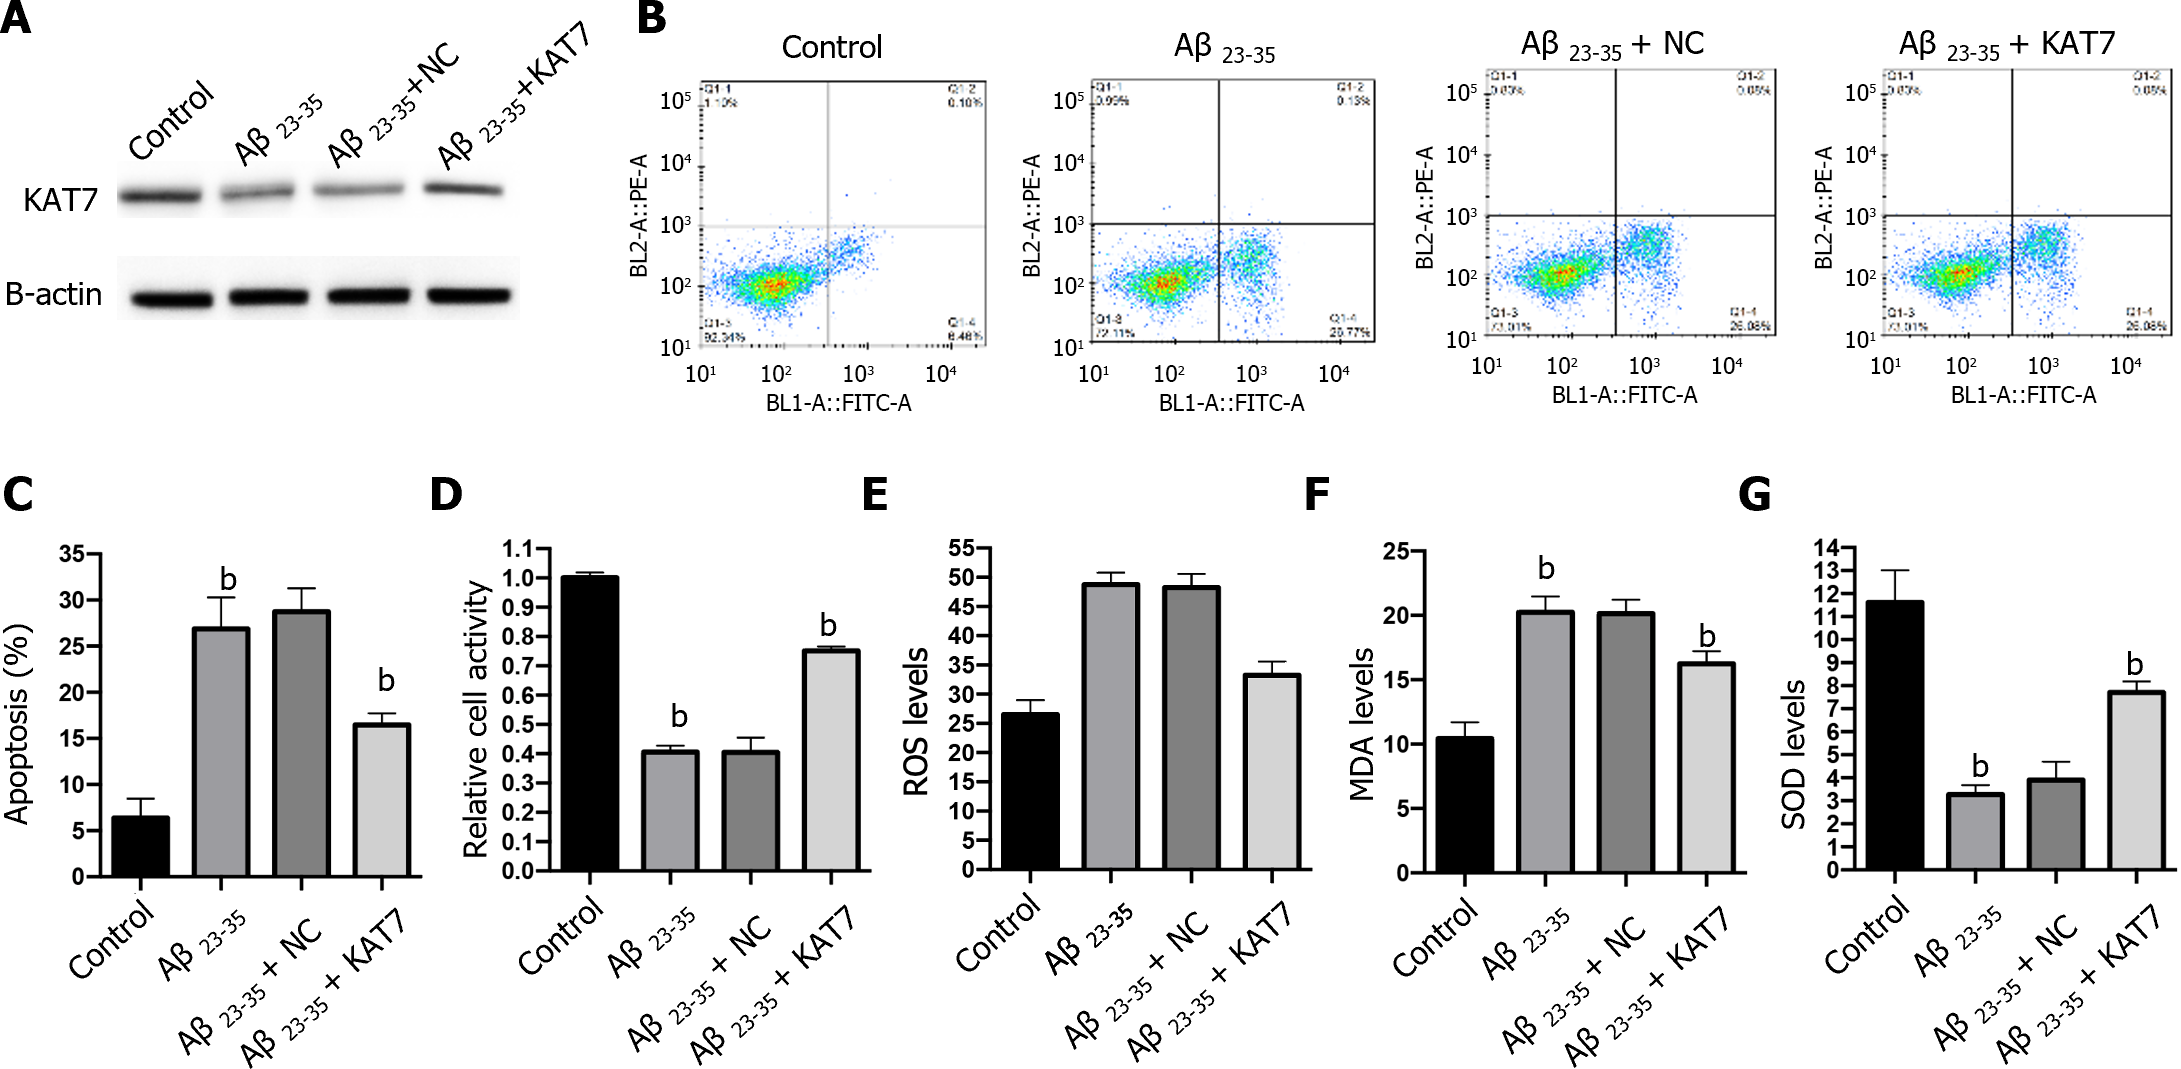
Figure 3 KAT7 alleviated Alzheimer’s disease-induced neurological damages in vitro.
A: Western blotting assay to evaluate the expression of KAT7 in neurons; B: Apoptosis of neurons checked by flow cytometry; C: Histogram of apoptotic cells; D: Cell viability of neurons after stimulation of Aβ with or without KAT7 overexpression was measured by cell counting kit-8 assay; E-G: Evaluation of oxidative biomarkers reactive oxygen species (E), malondialdehyde (F), and SOD activity (G). bP < 0.01.
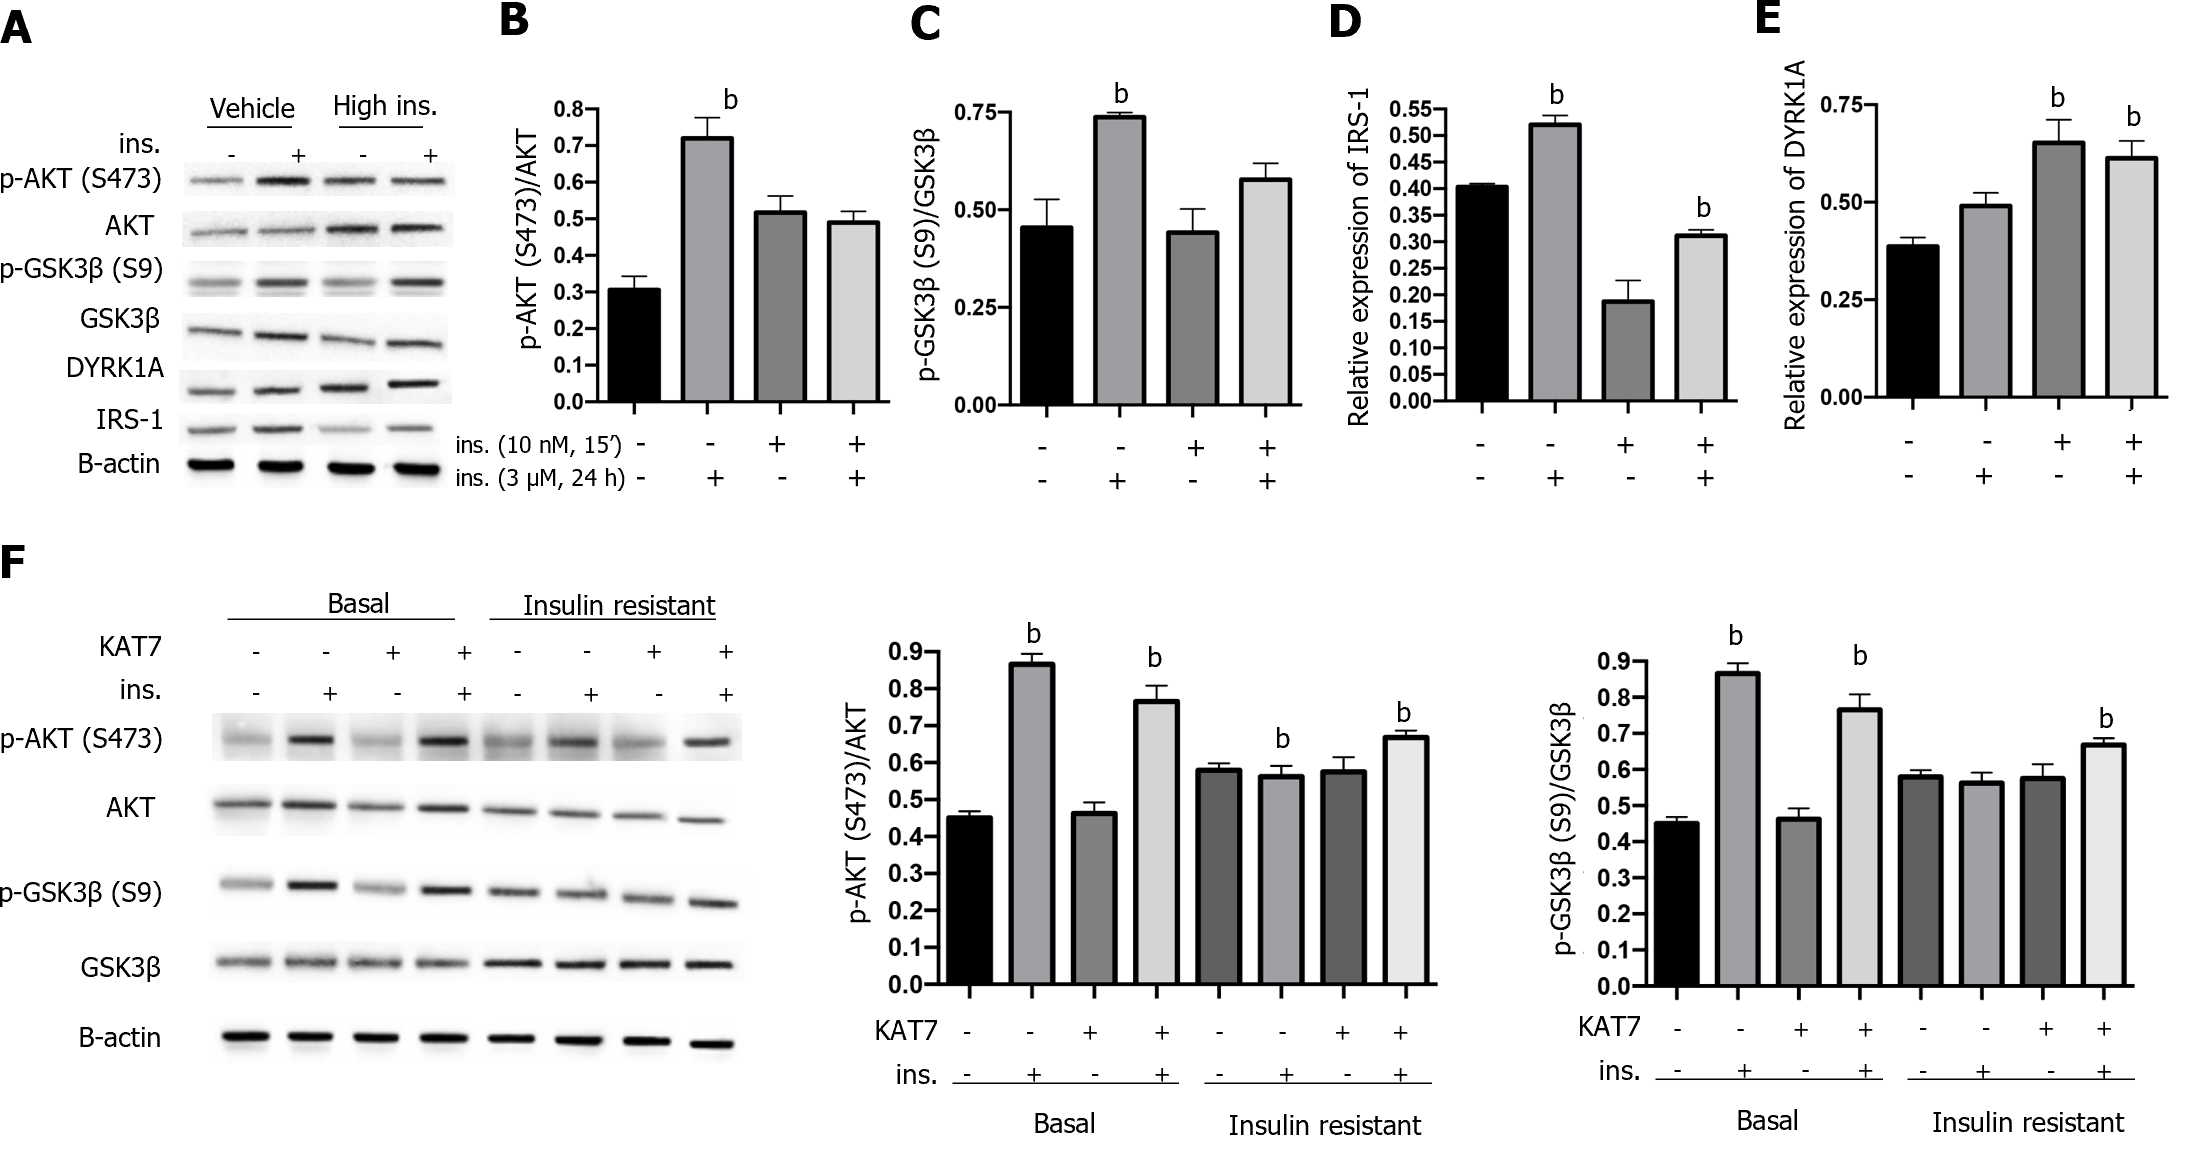
Figure 4 KAT7 ameliorates chronic high insulin-induced insulin resistance.
A: The protein levels of p-AKT, total AKT, p-GSK3β, total GSK3β, dual-specificity tyrosine phosphorylation-regulated kinase-1A (DYRK1A), and IRS-1 in neurons were assessed via western blotting; B: Histogram to quantify protein expression of pAKT in A; C: Histogram to quantify relative protein expression of p-GSK3β in A; D: Histogram to quantify relative protein expression of IRS-1 in A; E: Histogram to quantify relative protein expression of DYRK1A in A. Vehicle, no pre-stimulation with insulin; High ins, pre-stimulation with insulin (3 μM) for 24 h + indicated restimulation with insulin (10 nM, 15 min); F: Neurons treated the same as in A to establish insulin resistance, along with or without KAT7 overexpression. The protein levels of p-AKT, total AKT, p-GSK3β, and total GSK3β in neurons were assessed via western blotting. Histogram to quantify protein expression. bP < 0.01. DYRK1A: Dual-specificity tyrosine phosphorylation-regulated kinase-1A.
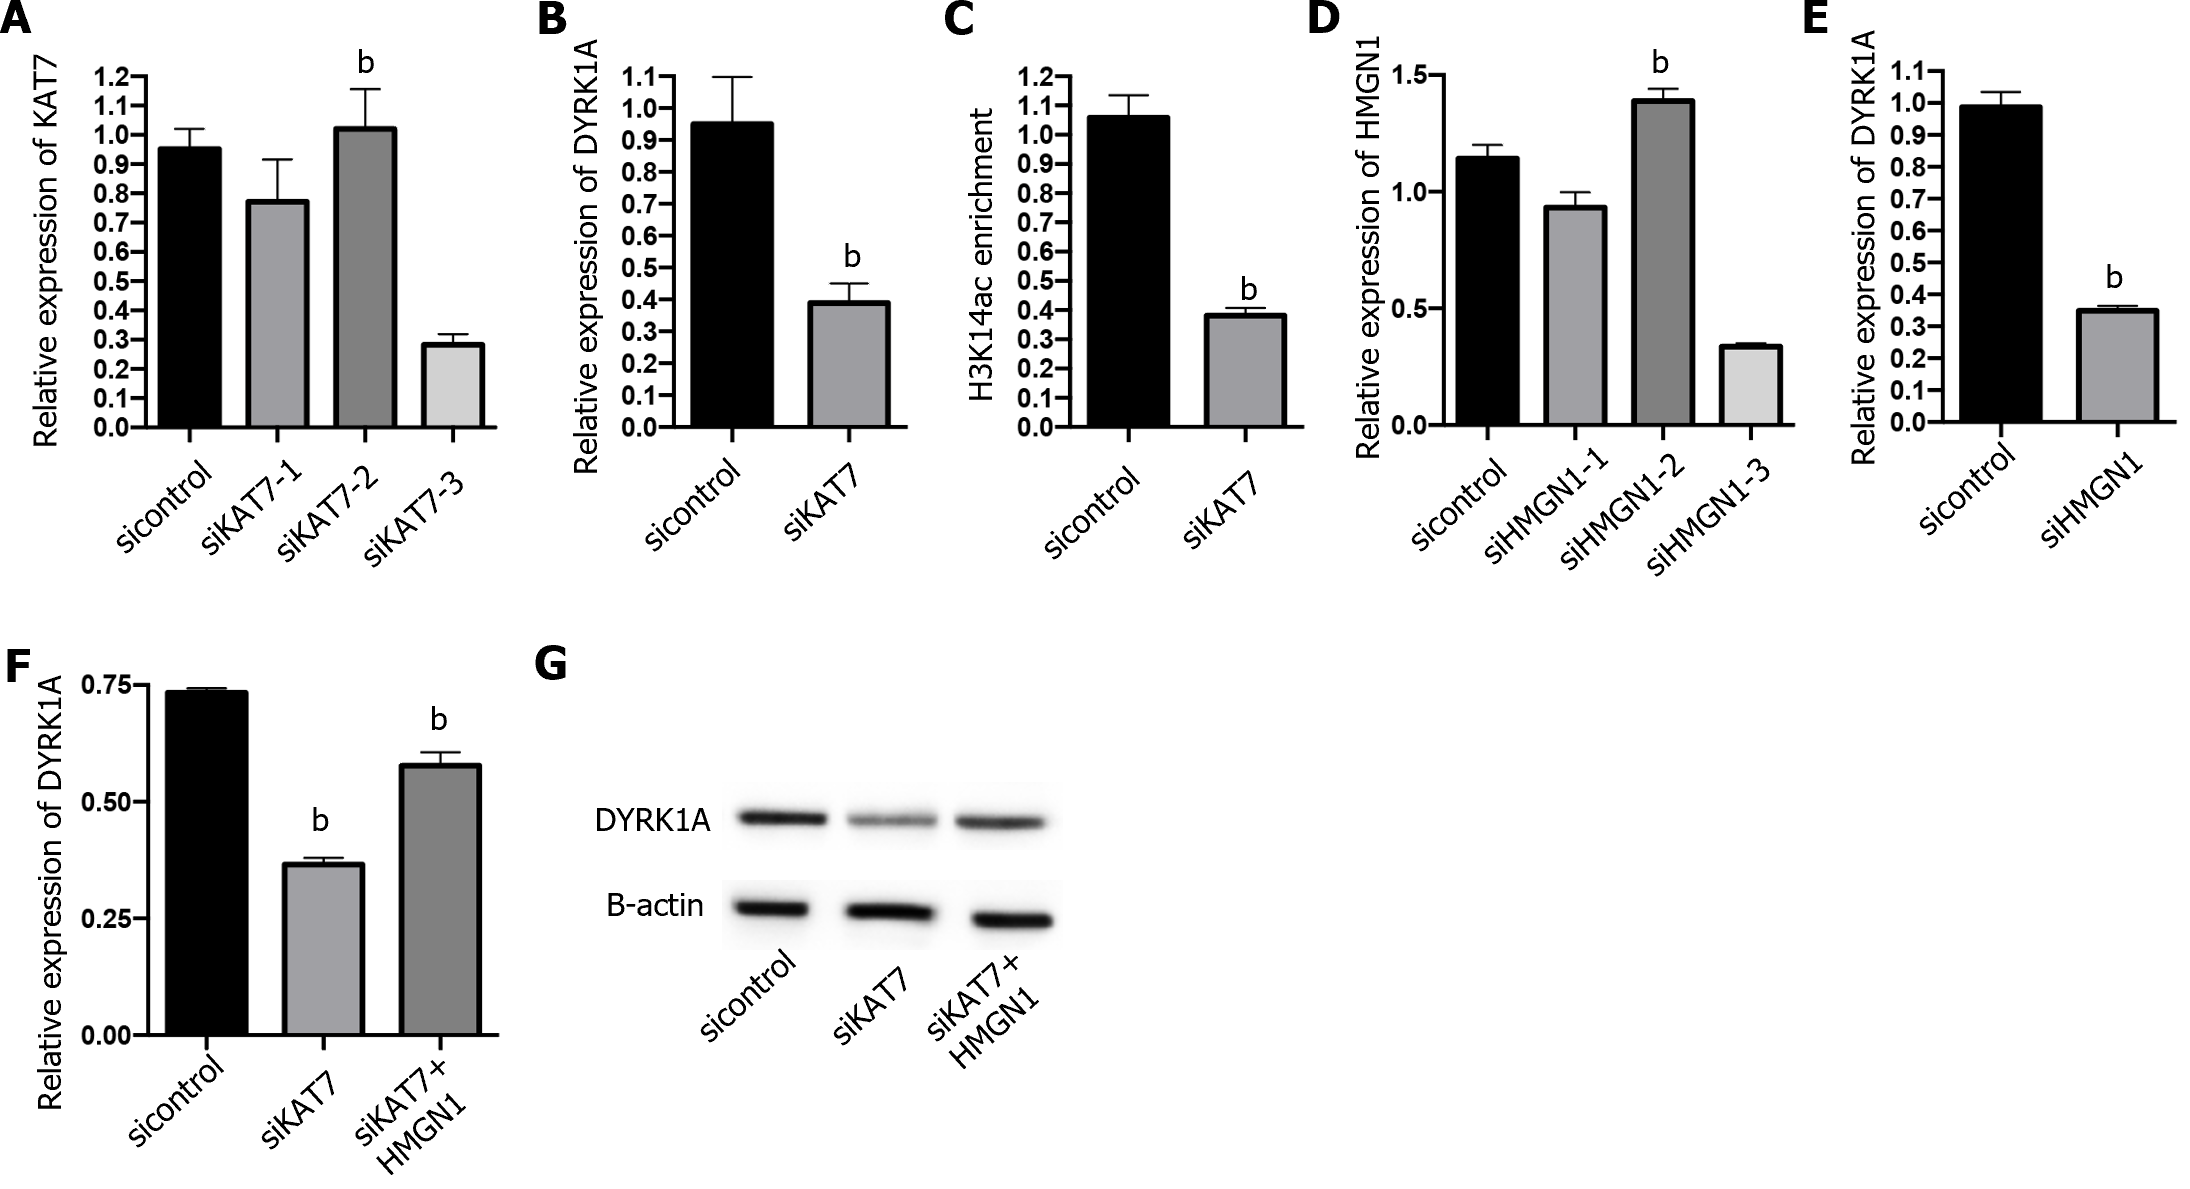
Figure 5 KAT7 epigenetically induces dual-specificity tyrosine phosphorylation-regulated kinase-1A expression.
A: RNA level of KAT7 in neurons after transfection of siKAT7-1, siKAT7-2, or siKAT7-3 was measured using qPCR; B: RNA level of dual-specificity tyrosine phosphorylation-regulated kinase-1A (DYRK1A) in neurons after siKAT7-3 transfection was measured using qPCR; C: Chromatin immunoprecipitation assay to measure enrichment of H3K14ac on DYRK1A gene; D: RNA level of HMGN1 in neurons after transfection of siHMGN1-1, siHMGN1-2, or siHMGN1-3 was measured using qPCR; E: RNA level of DYRK1A in neurons after transfection of siHMGN1-3 was measured using qPCR; F and G: RNA and protein levels of DYRK1A in neurons after siKAT7-3 transfection with or without KAT7 overexpression vectors was measured using qPCR. bP < 0.01. DYRK1A: Dual-specificity tyrosine phosphorylation-regulated kinase-1A.
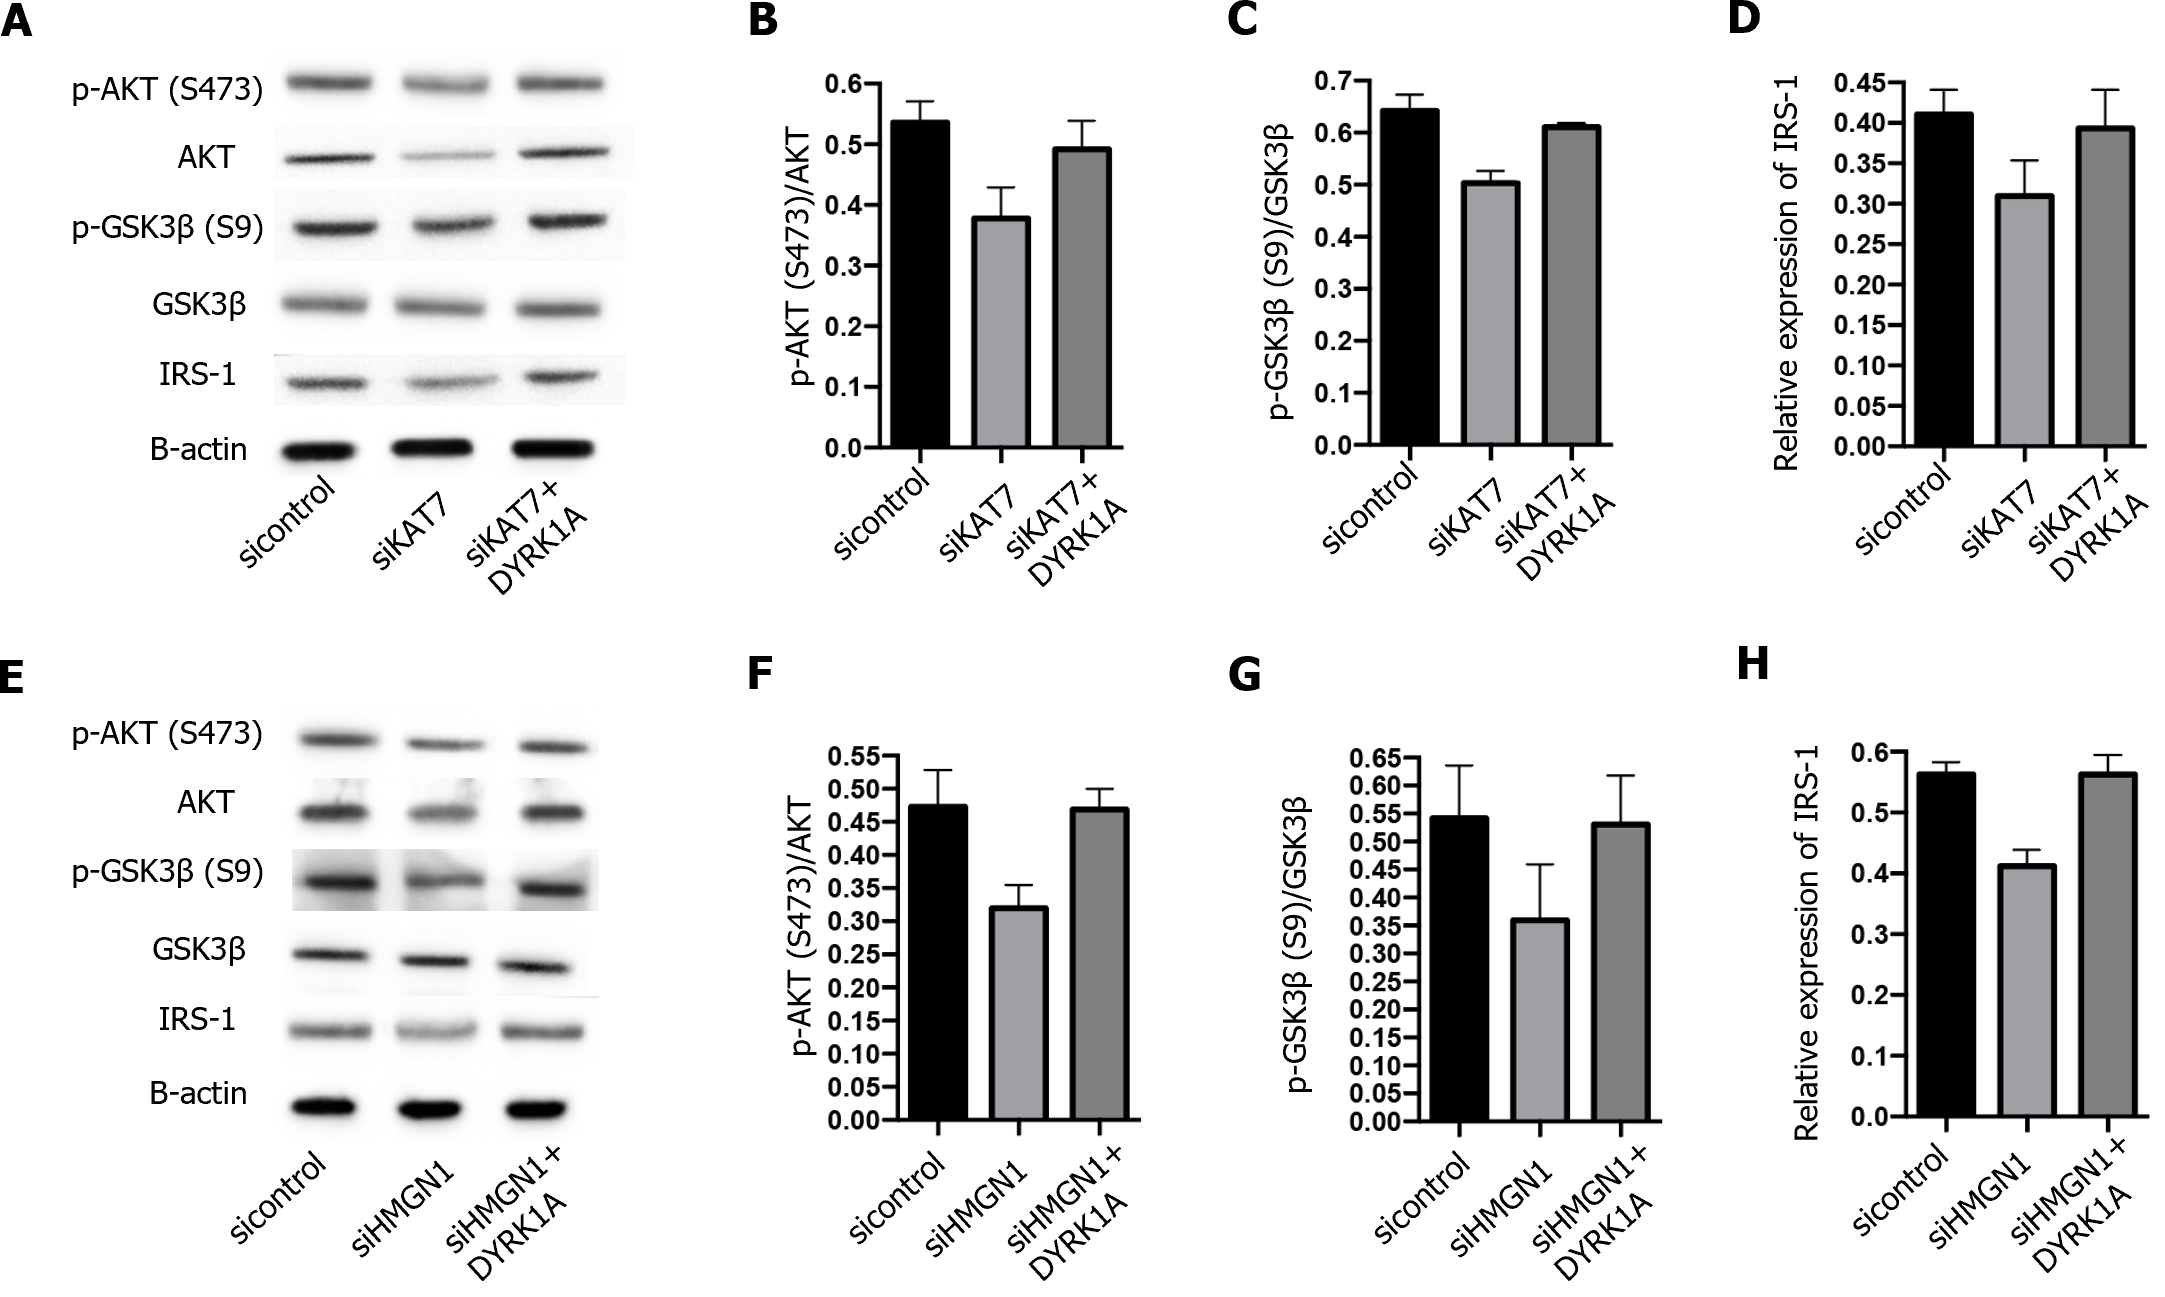
Figure 6 KAT7 epigenetically induces dual-specificity tyrosine phosphorylation-regulated kinase-1A expression in a HMGN1 dependent-manner.
The insulin-resistant neurons were transfected with siKAT7 or siHMGN1 with or without dual-specificity tyrosine phosphorylation-regulated kinase-1A (DYRK1A) overexpression. A: The protein levels of p-AKT, total AKT, p-GSK3β, total GSK3β, and IRS-1 in neurons were assessed via western blotting; B: Histogram to quantify relative protein expression of pAKT in A; C: Histogram to quantify relative protein expression of pGSK3β in A; D: Histogram to quantify relative protein expression of IRS-1 in A; E: The protein levels of p-AKT, total AKT, p-GSK3β, total GSK3β, and IRS-1 in neurons treated with siHMGN1 and DYRK1A overexpression were assessed via western blotting; F: Histogram to quantify relative protein expression of pAKT in B; G: Histogram to quantify relative protein expression of pGSK3β in B; H: Histogram to quantify relative protein expression of IRS-1 in B. DYRK1A: Dual-specificity tyrosine phosphorylation-regulated kinase-1A.
- Citation: Lu QS, Ma L, Jiang WJ, Wang XB, Lu M. KAT7/HMGN1 signaling epigenetically induces tyrosine phosphorylation-regulated kinase 1A expression to ameliorate insulin resistance in Alzheimer’s disease. World J Psychiatry 2024; 14(3): 445-455
- URL: https://www.wjgnet.com/2220-3206/full/v14/i3/445.htm
- DOI: https://dx.doi.org/10.5498/wjp.v14.i3.445


