Copyright
©The Author(s) 2024.
World J Psychiatry. Dec 19, 2024; 14(12): 1956-1970
Published online Dec 19, 2024. doi: 10.5498/wjp.v14.i12.1956
Published online Dec 19, 2024. doi: 10.5498/wjp.v14.i12.1956
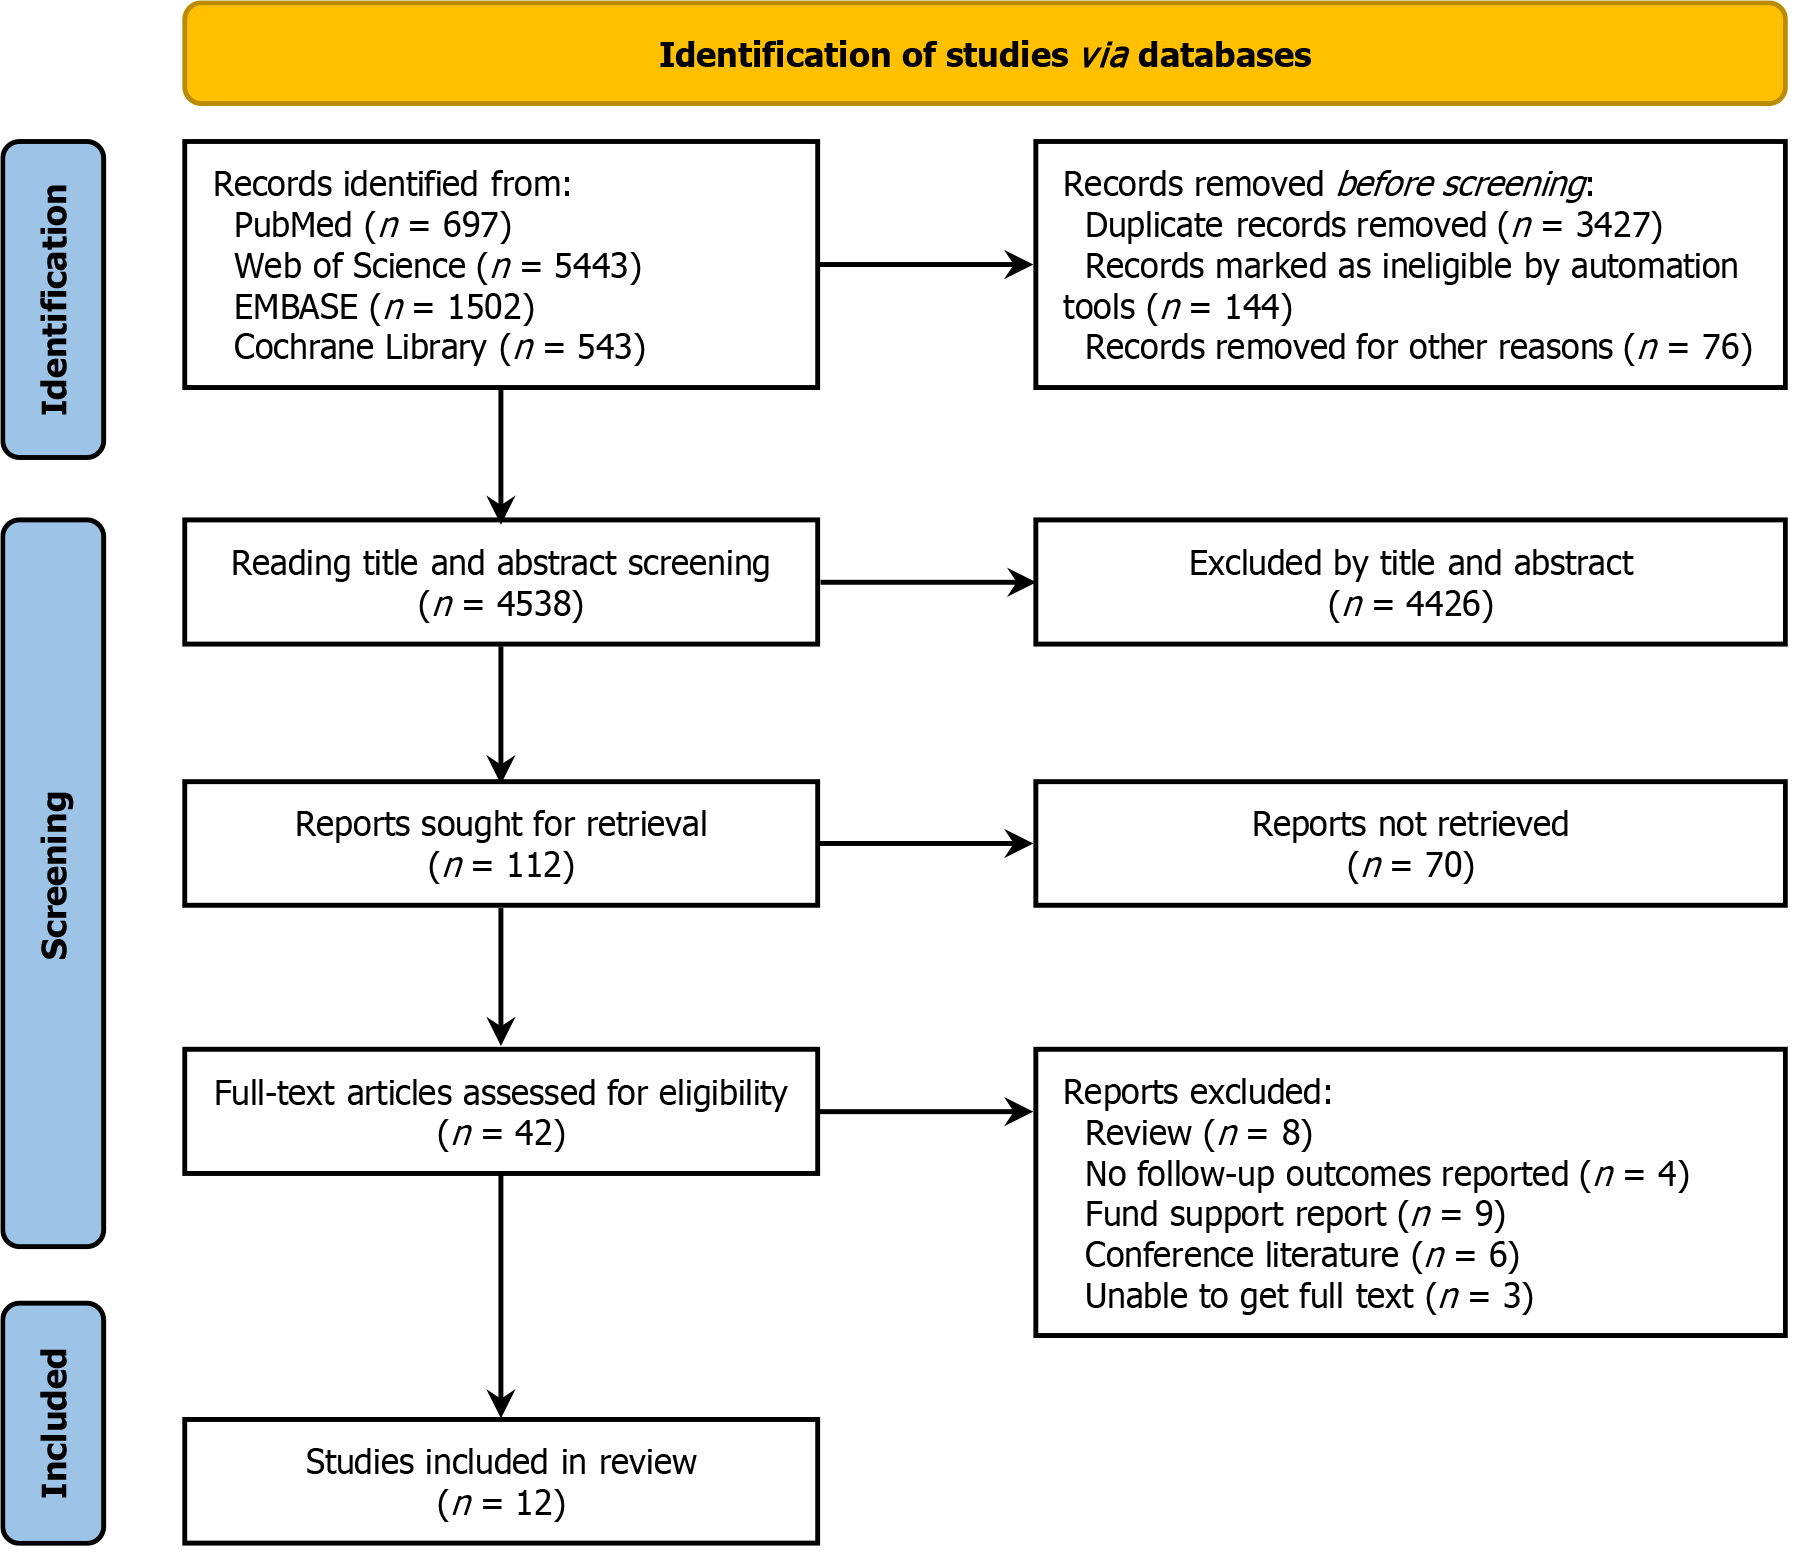
Figure 1
Flow diagram of study selection.
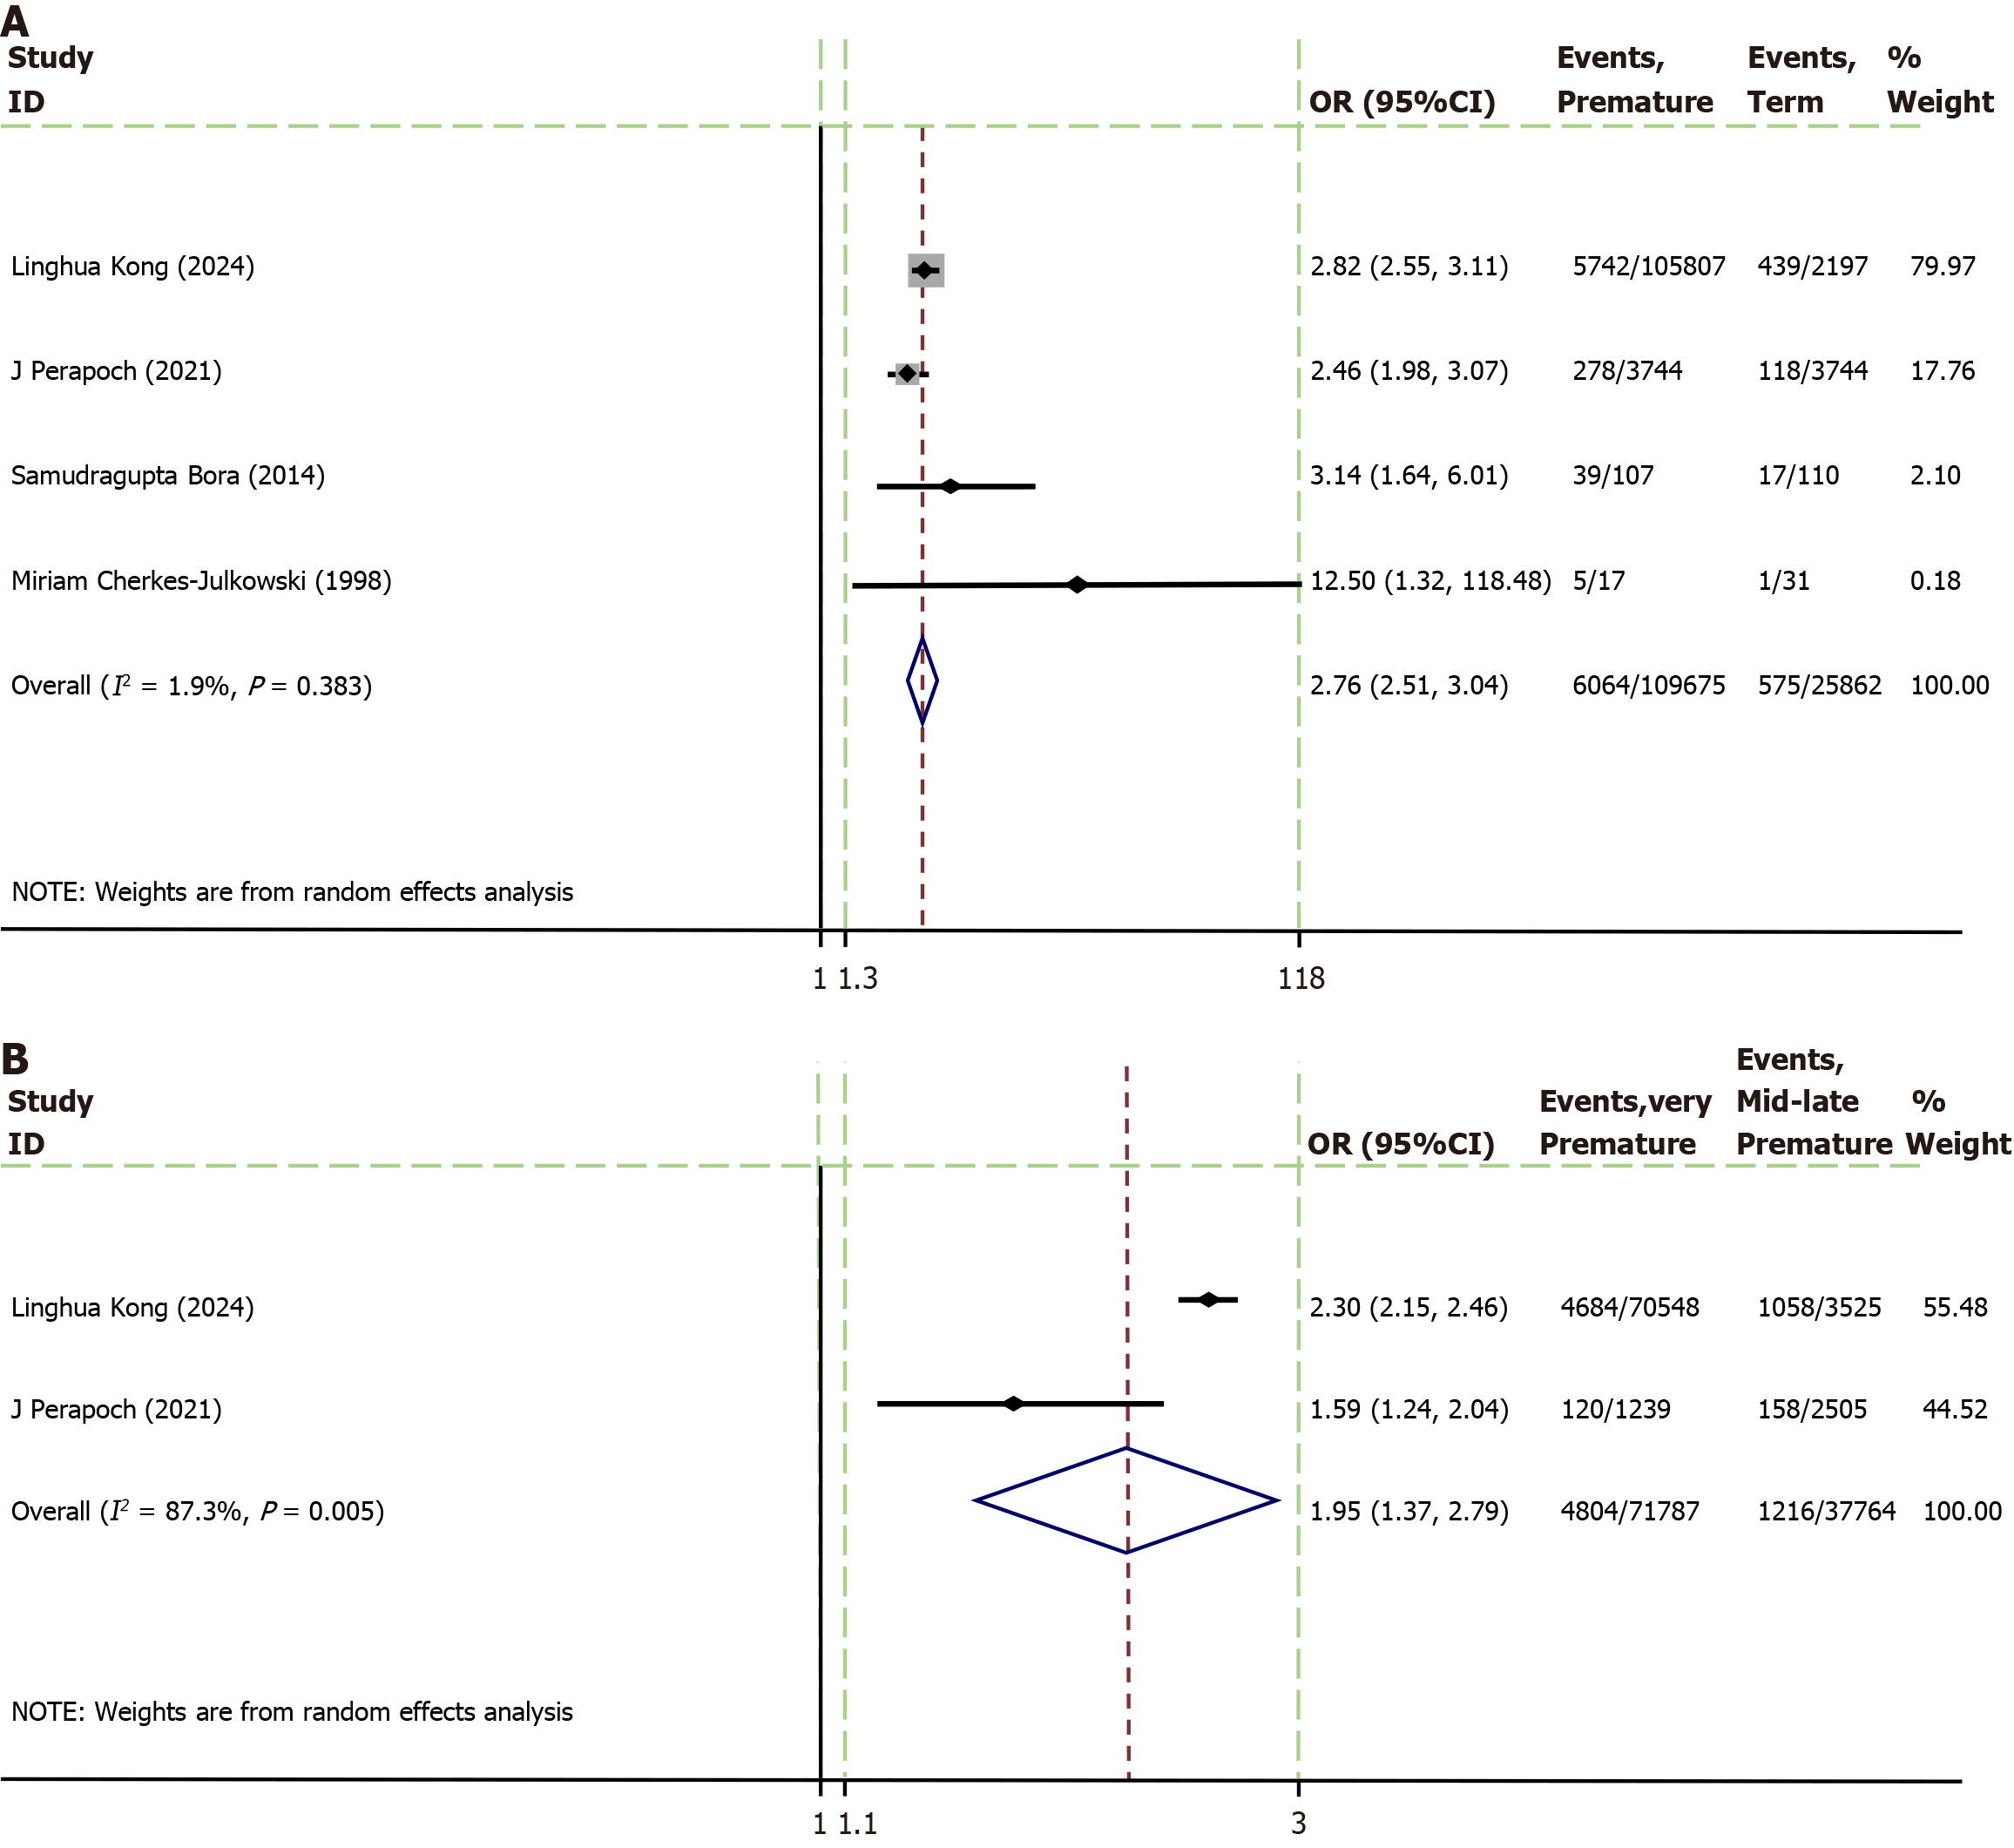
Figure 2 Meta-analysis of premature delivery and attention deficit hyperactivity disorder in children.
A: Premature vs term; B: Very preterm vs mid-late premature. OR: Odds ratio; CI: Confidence interval.
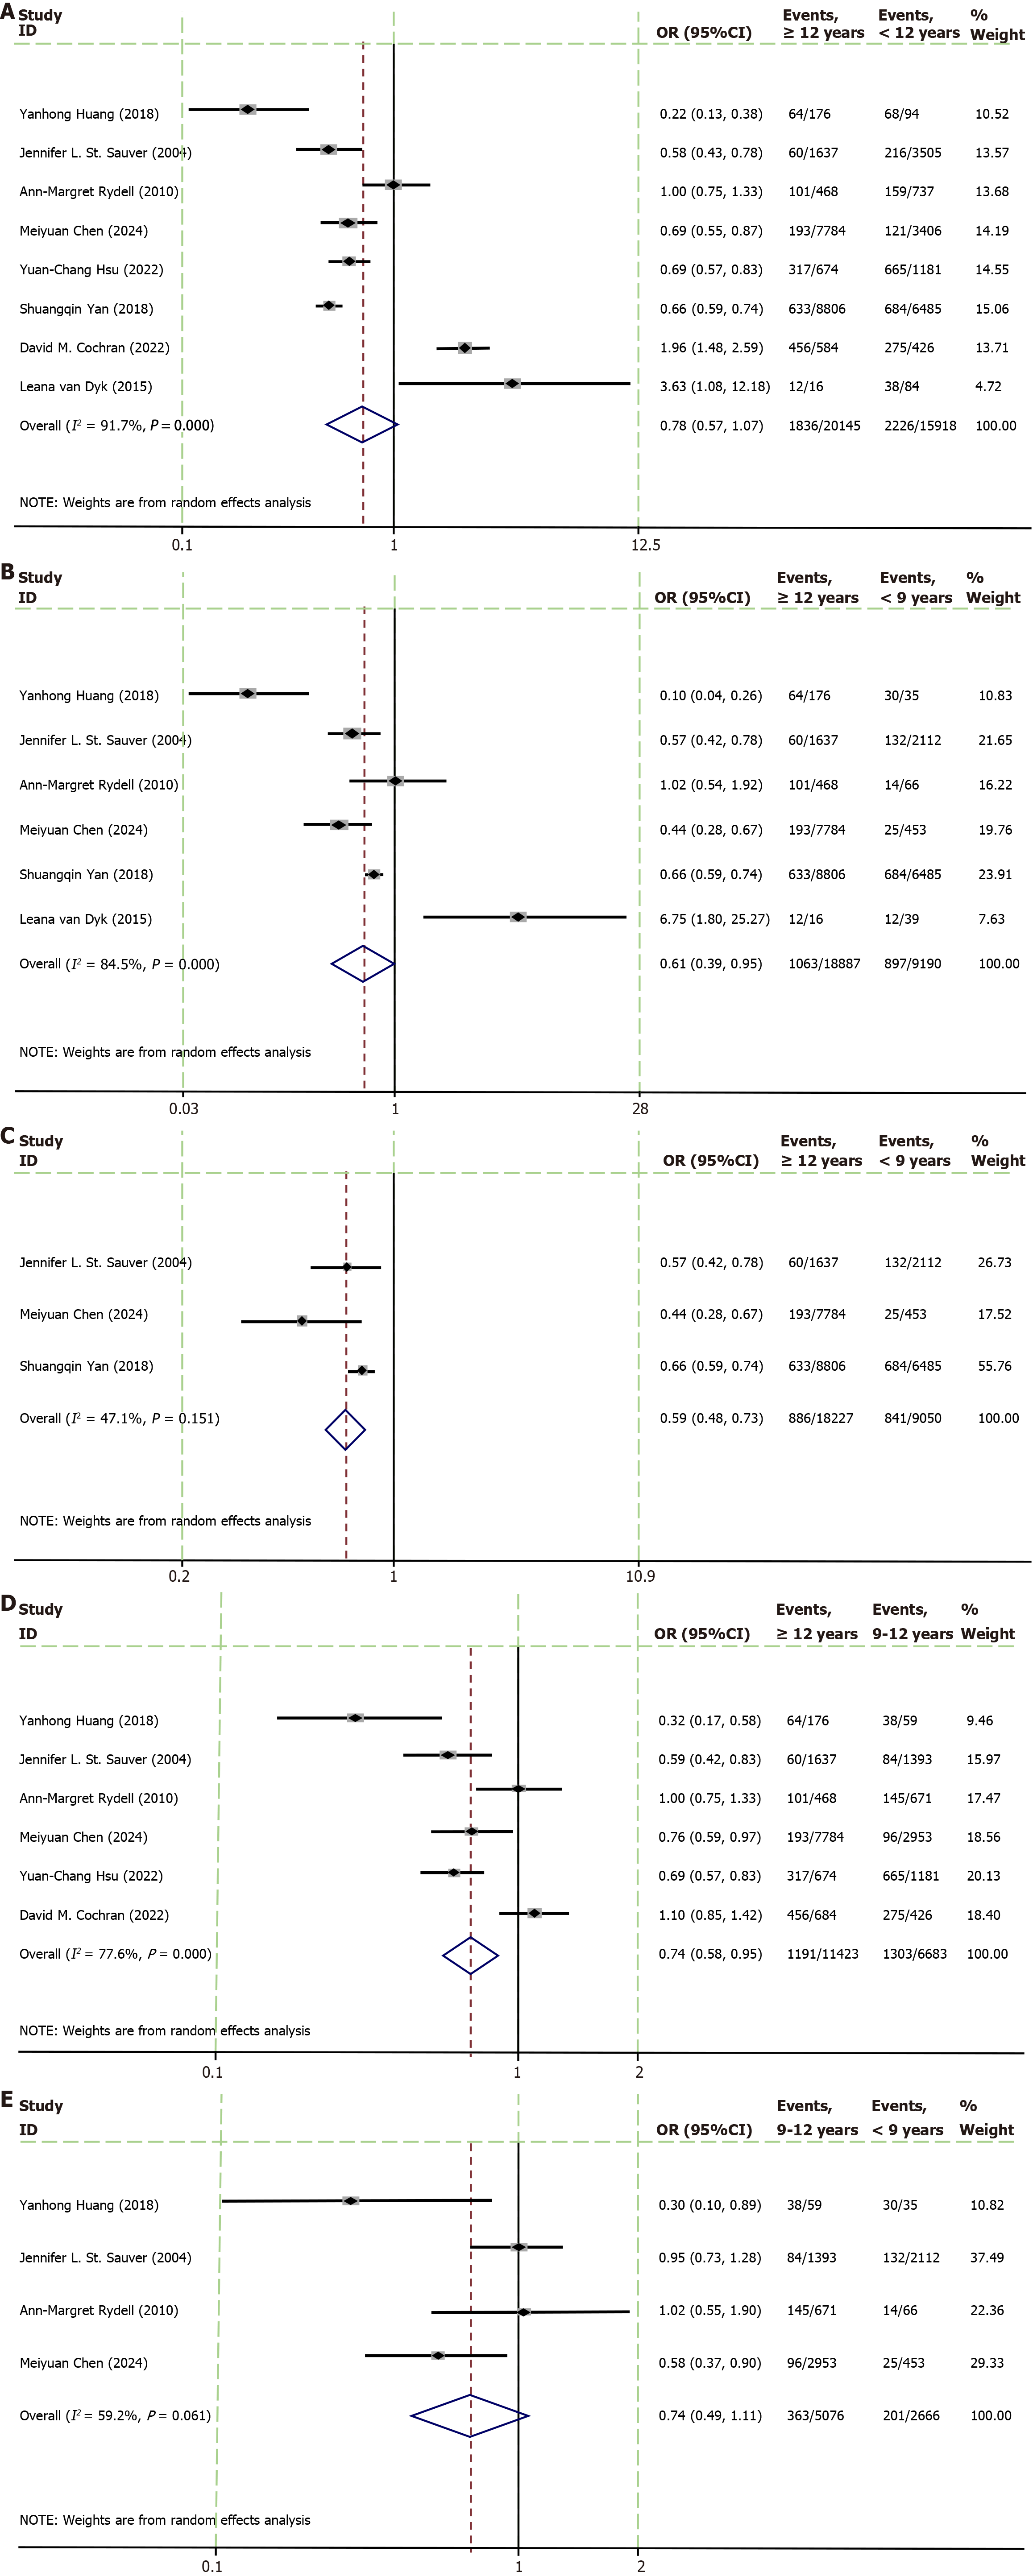
Figure 3 Meta-analysis forest map of mothers with different years of education.
A: ≥ 12 years vs 12 years; B: ≥ 12 years vs 9 years; C: ≥ 12 years vs 9 years; D: ≥ 12 years vs 9-12 years; E: 9-12 years vs < 9 years. After the adjustment of meta-analysis, the studies with large heterogeneity were manually excluded. OR: Odds ratio; CI: Confidence interval.
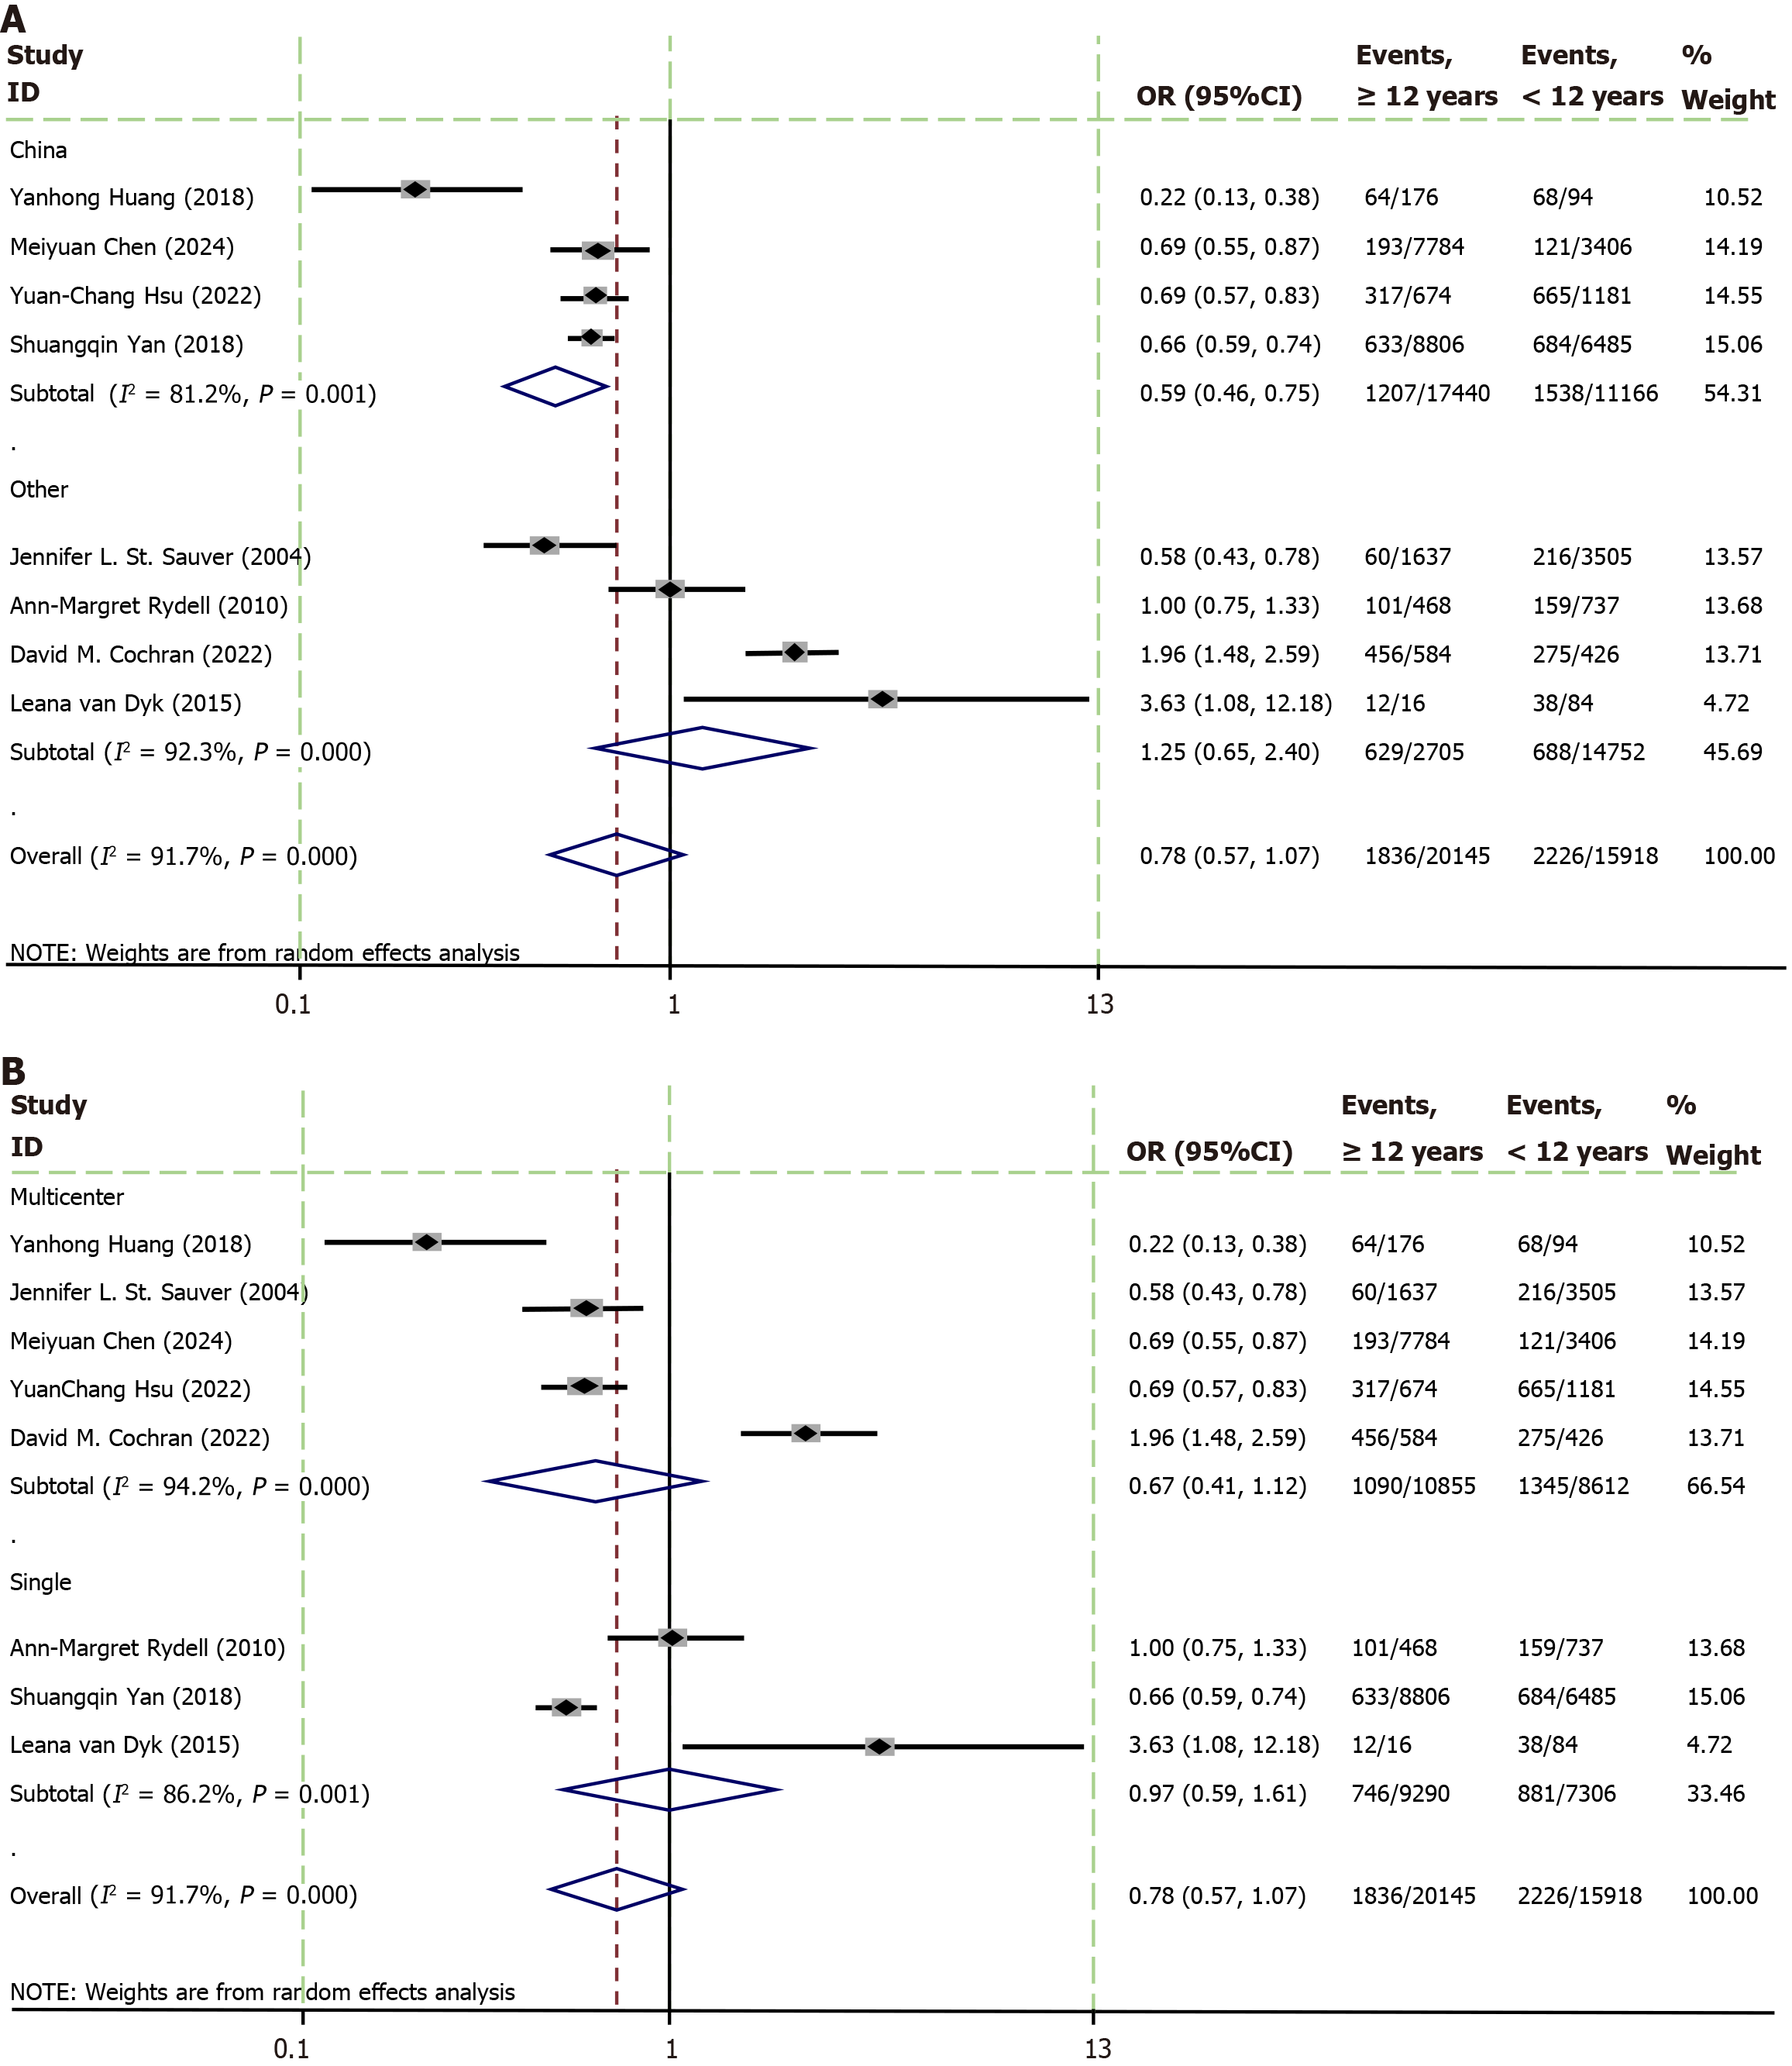
Figure 4 Subgroup analysis of the influence of mother's education level on attention deficit hyperactivity disorder in children forest map.
A: China vs other country; B: Multicenter vs single center. OR: Odds ratio; CI: Confidence interval.
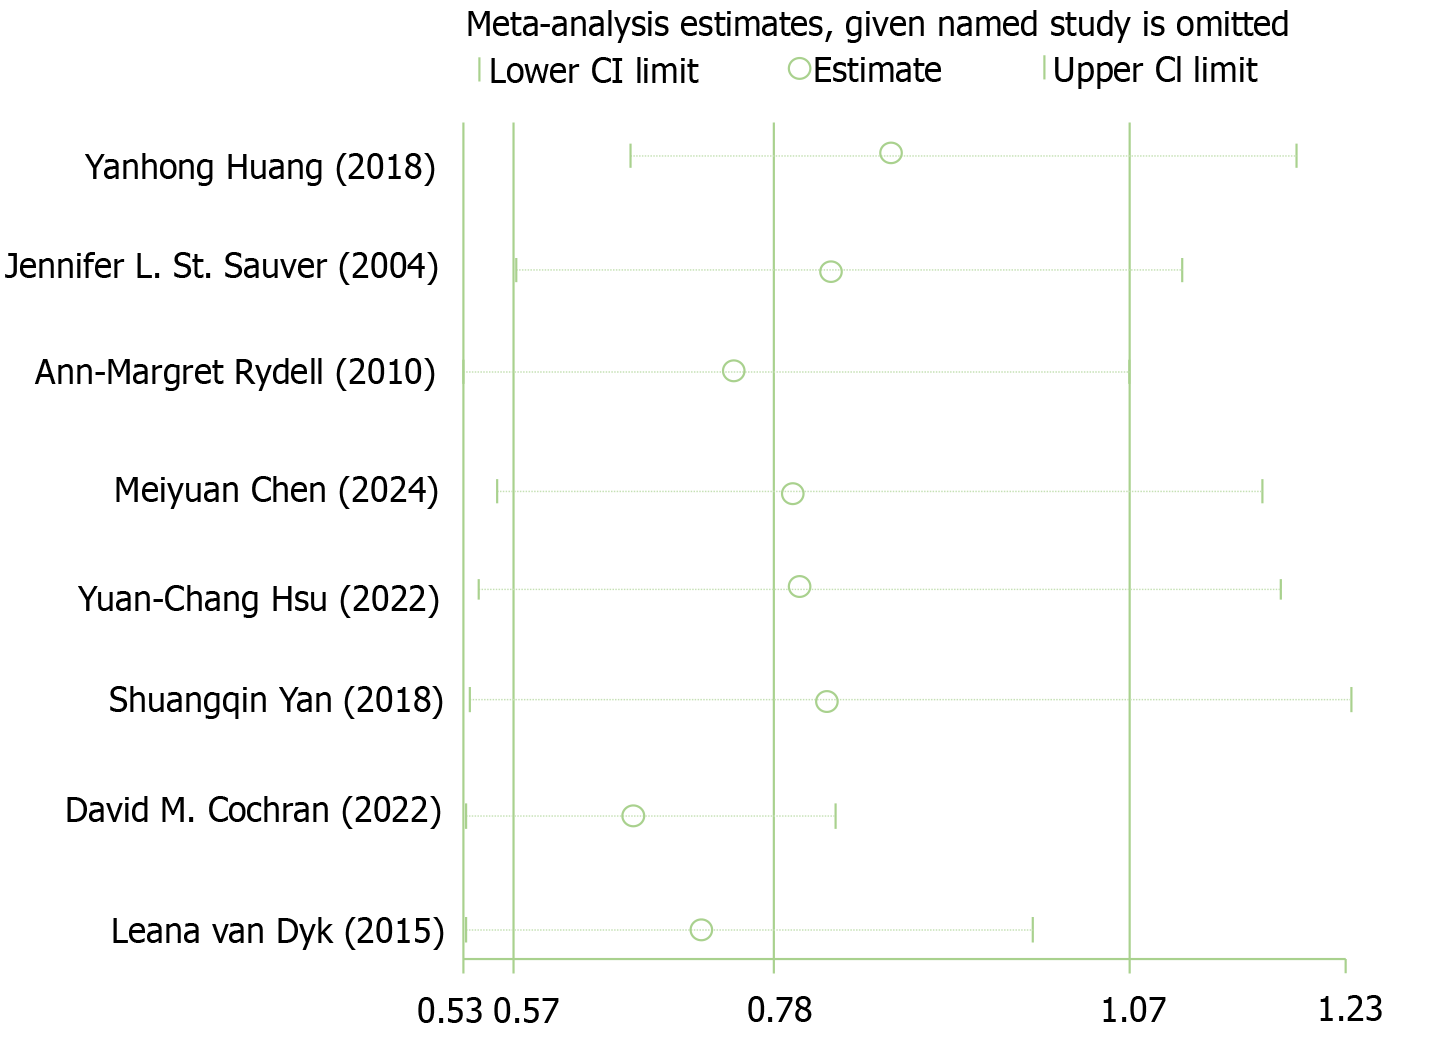
Figure 5 Sensitivity analysis chart of mother’s education level.
CI: Confidence interval.
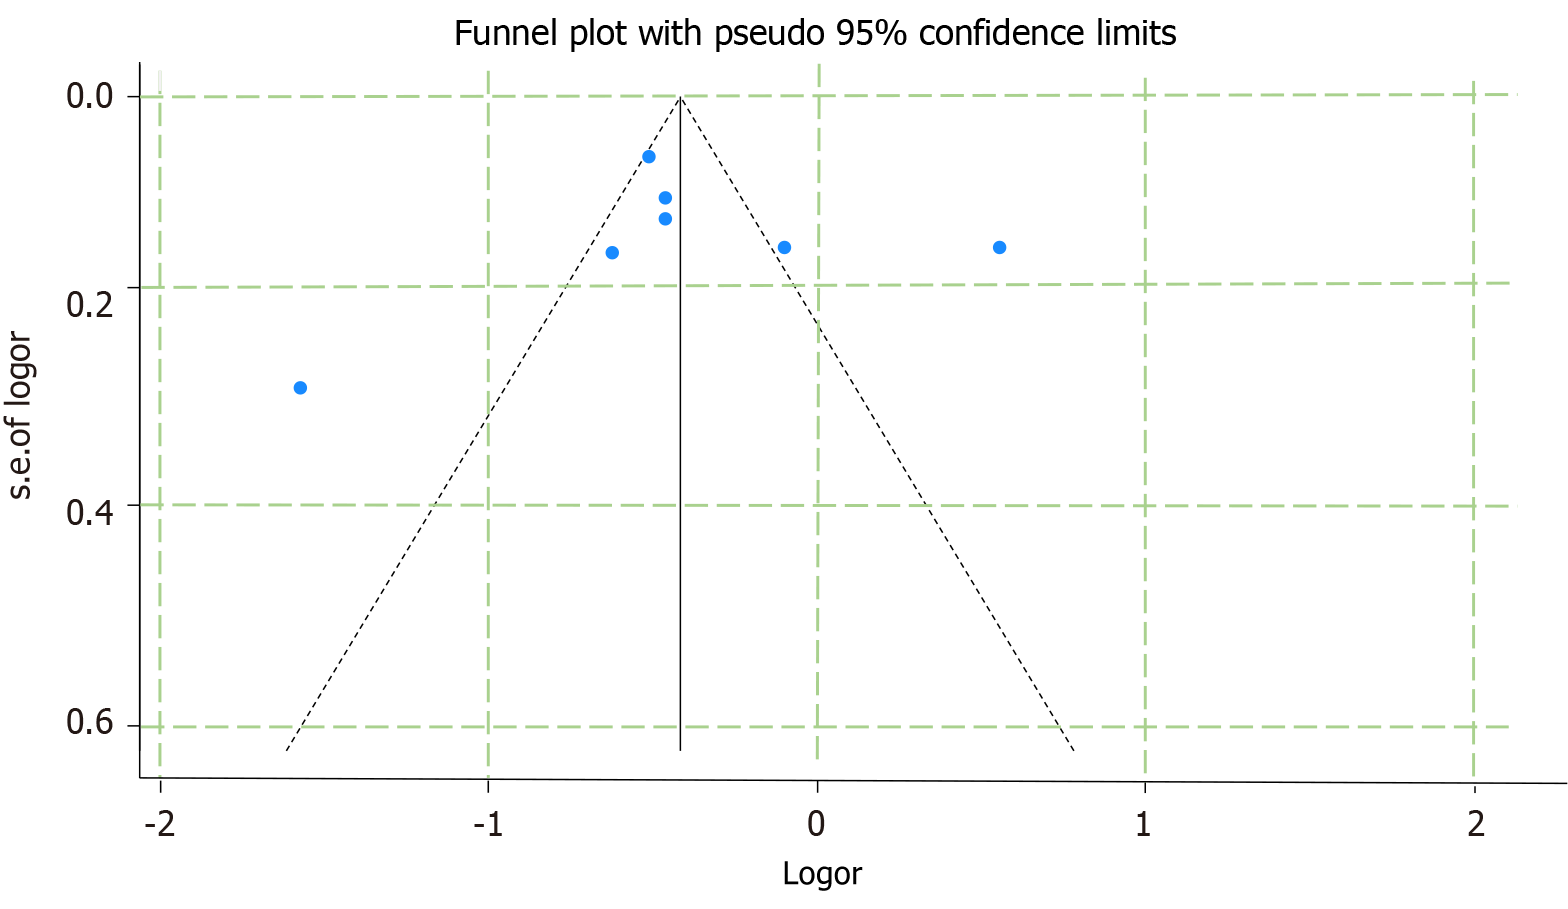
Figure 6
Funnel diagram of meta-analysis of mother’s education level.
- Citation: Zhao YK, Li M, Shi TT, Feng MM, Hu LL. Association of premature birth and maternal education level on attention deficit hyperactivity disorder in children: A meta-analysis. World J Psychiatry 2024; 14(12): 1956-1970
- URL: https://www.wjgnet.com/2220-3206/full/v14/i12/1956.htm
- DOI: https://dx.doi.org/10.5498/wjp.v14.i12.1956


