Copyright
©The Author(s) 2024.
World J Psychiatry. Dec 19, 2024; 14(12): 1925-1935
Published online Dec 19, 2024. doi: 10.5498/wjp.v14.i12.1925
Published online Dec 19, 2024. doi: 10.5498/wjp.v14.i12.1925
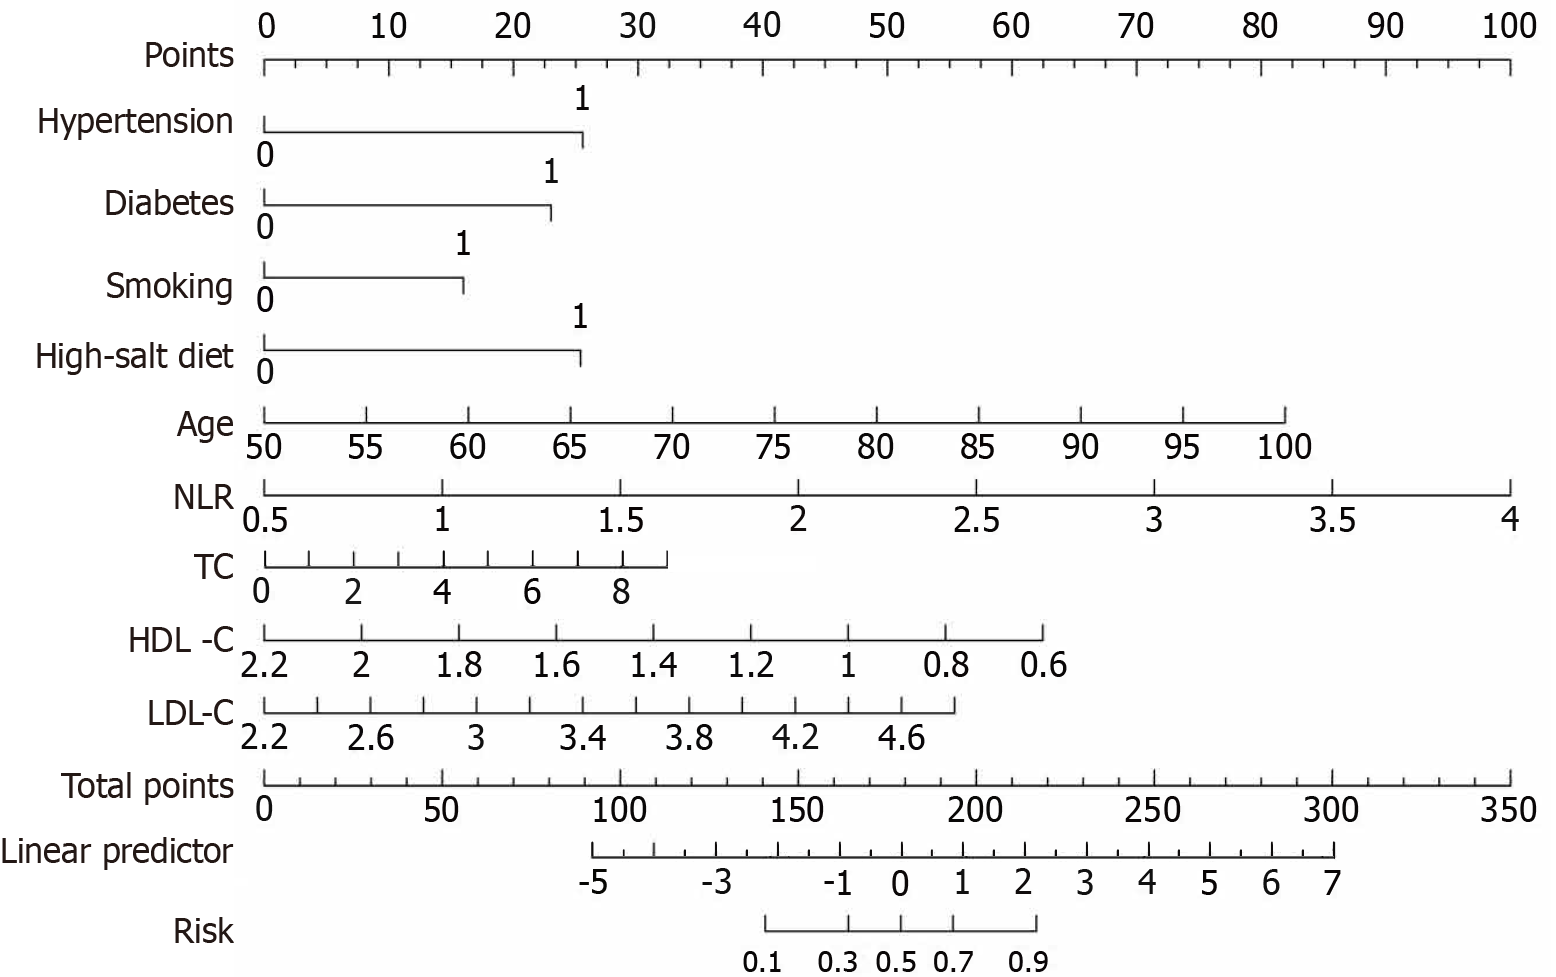
Figure 1 The nomogram model for predicting the risk of mild cognitive impairment onset.
NLR: Neutrophil lymphocyte ratio; TC: Total cholesterol; HDL-C: High-density lipoprotein cholesterol; LDL-C: Low-density lipoprotein cholesterol.
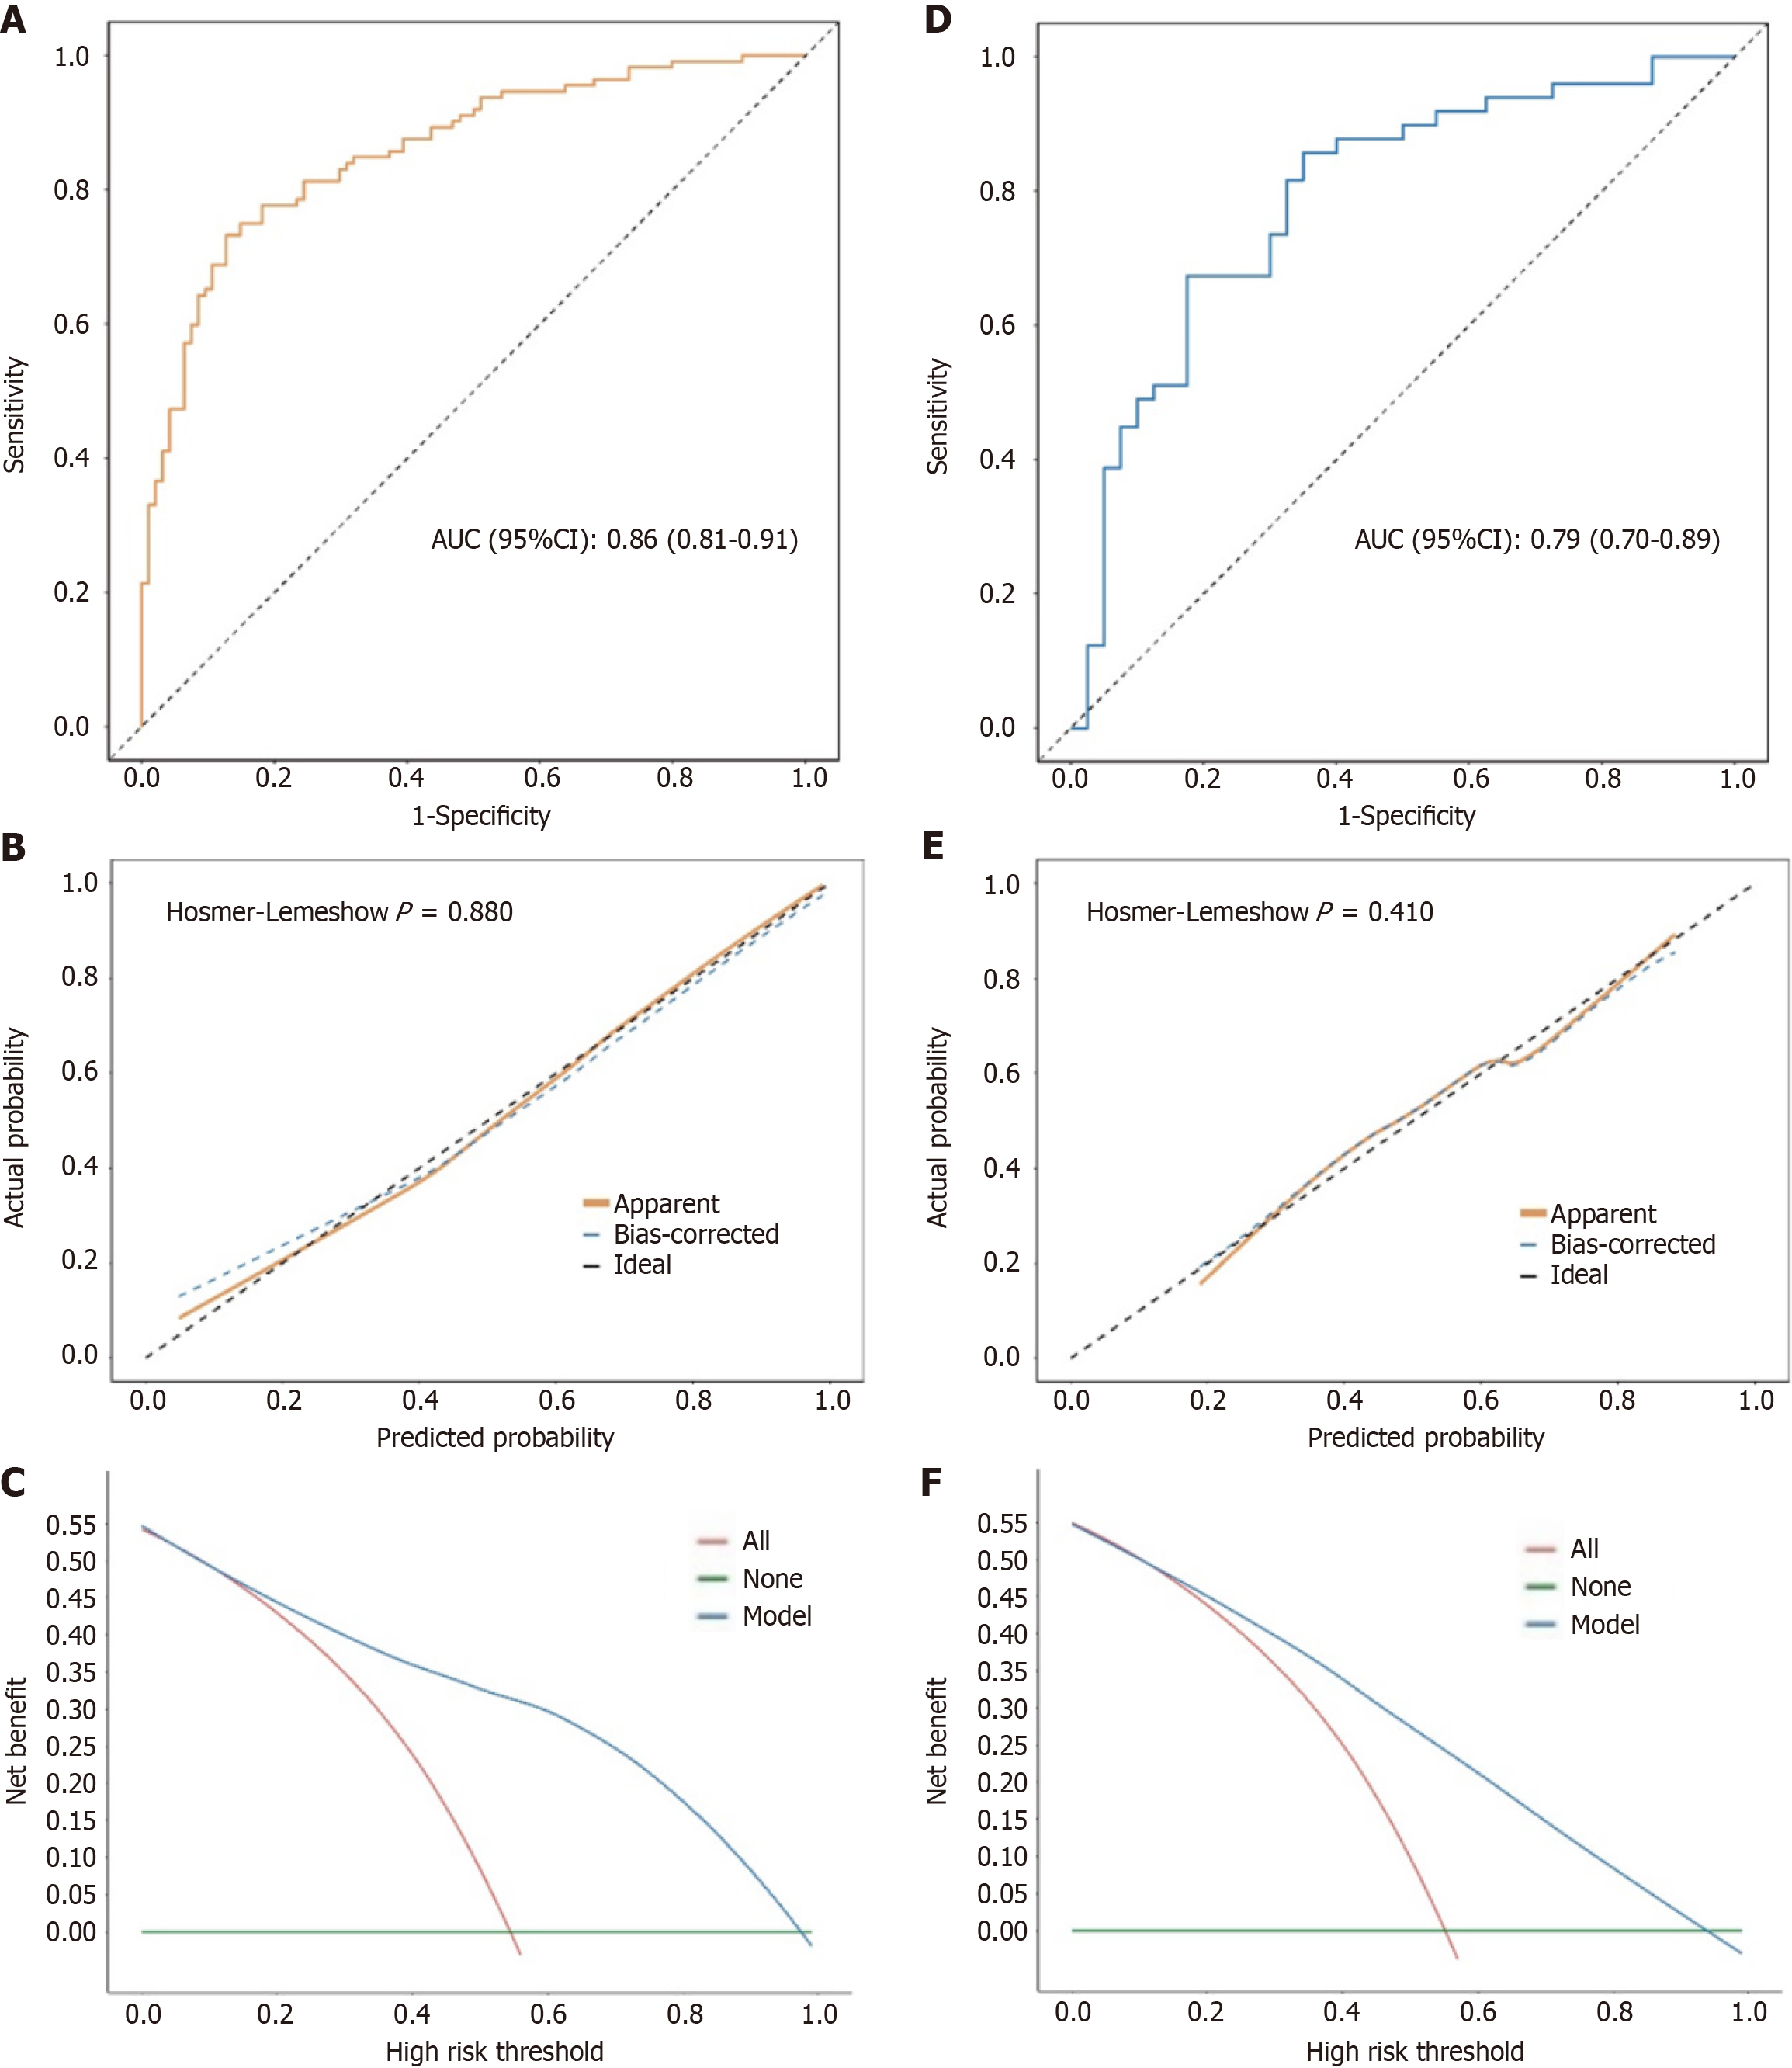
Figure 2 Receiver operating characteristic curves, calibration curves and decision acceptance curve analysis for training and testing sets.
A-C: Receiver operating characteristic (ROC), calibration curve, and decision acceptance curve (DAC) for the training set; D-F: ROC, calibration curve, and DAC for the testing set. AUC: Area under curve.
- Citation: Yang Y, Lu SR, Xu Q, Yu J, Wang Z, Zhang BS, Hong K. Predictive value of nutritional status and serological indicators in elderly patients with mild cognitive impairment. World J Psychiatry 2024; 14(12): 1925-1935
- URL: https://www.wjgnet.com/2220-3206/full/v14/i12/1925.htm
- DOI: https://dx.doi.org/10.5498/wjp.v14.i12.1925


