Copyright
©The Author(s) 2024.
World J Psychiatry. Oct 19, 2024; 14(10): 1592-1604
Published online Oct 19, 2024. doi: 10.5498/wjp.v14.i10.1592
Published online Oct 19, 2024. doi: 10.5498/wjp.v14.i10.1592
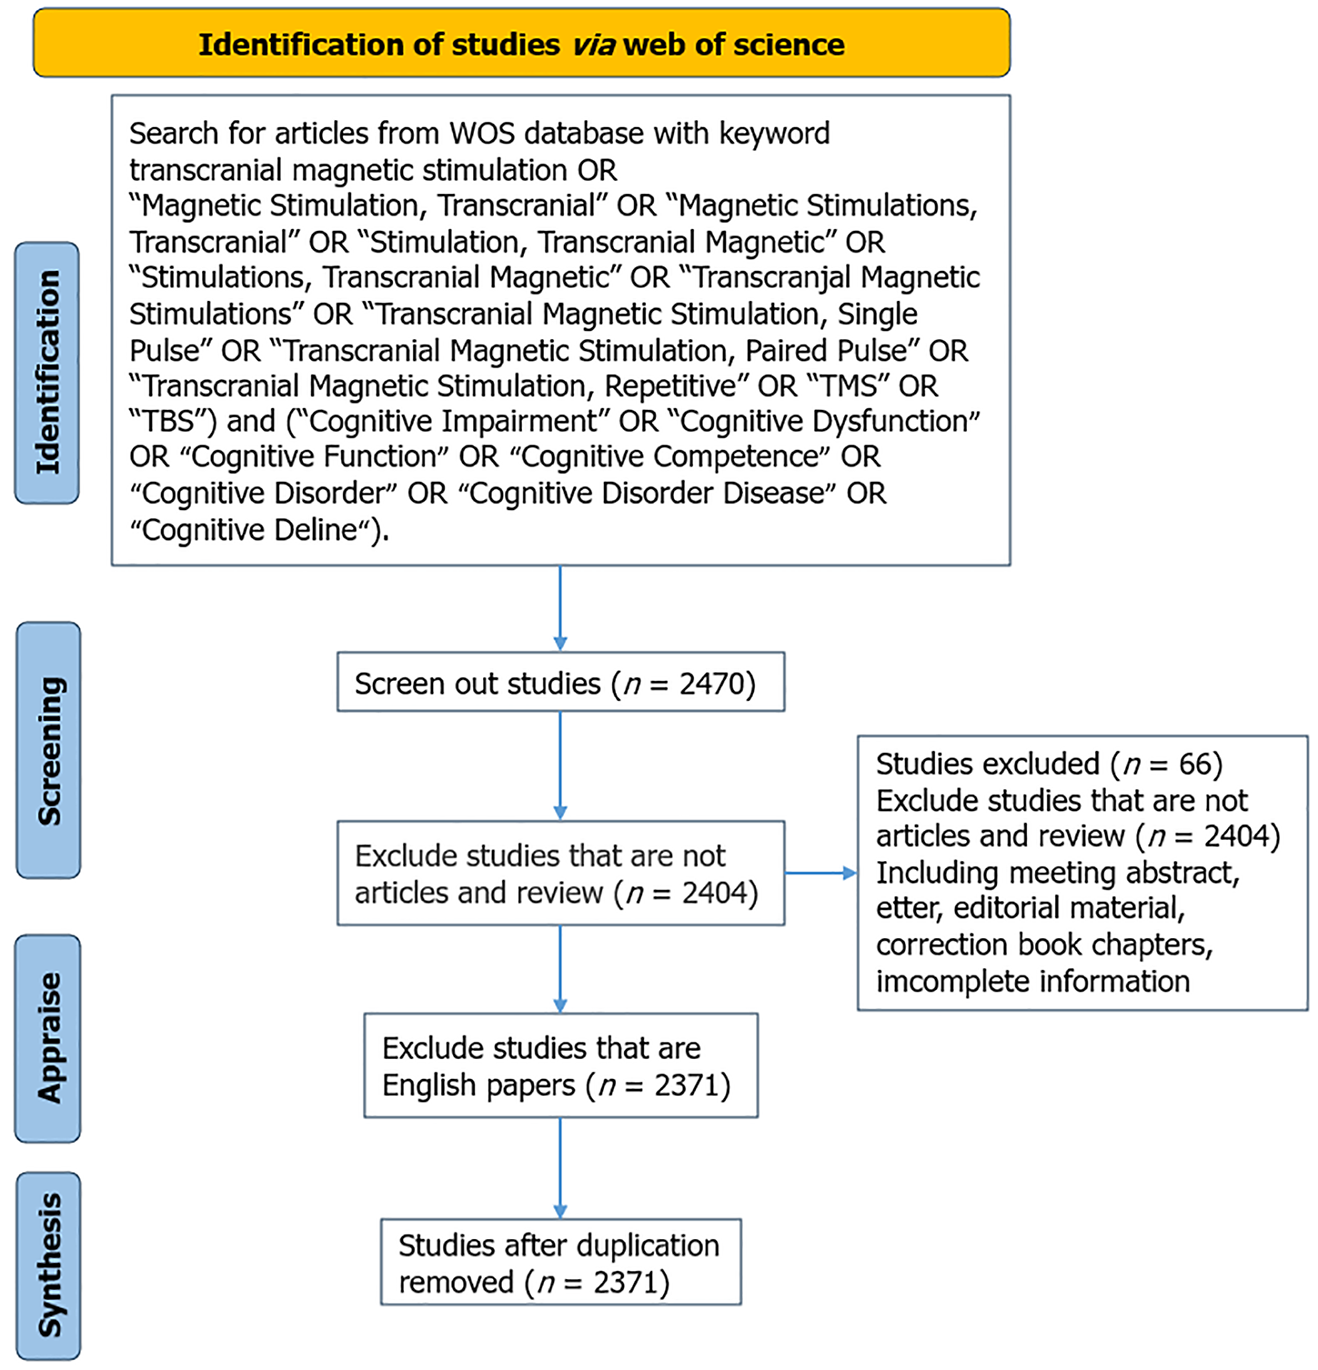
Figure 1 Flowchart showing the process of study selection.
WOS: Web of science; TMS: Transcranial magnetic stimulation; TBS: Theta burst stimulation.
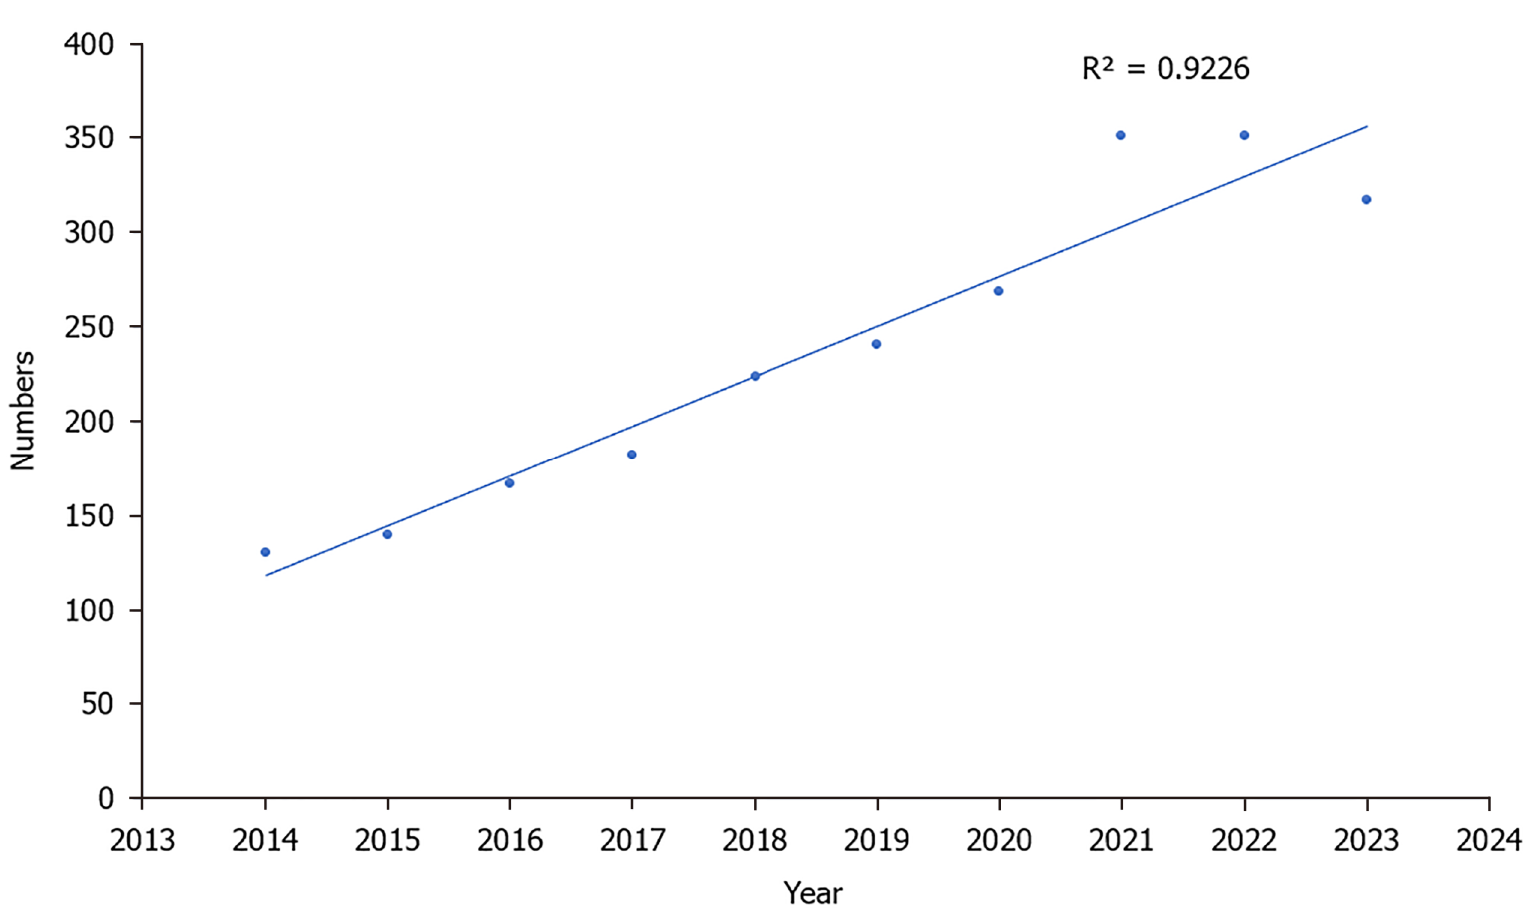
Figure 2 Annual publication outputs and the model fitting curve of time trend.
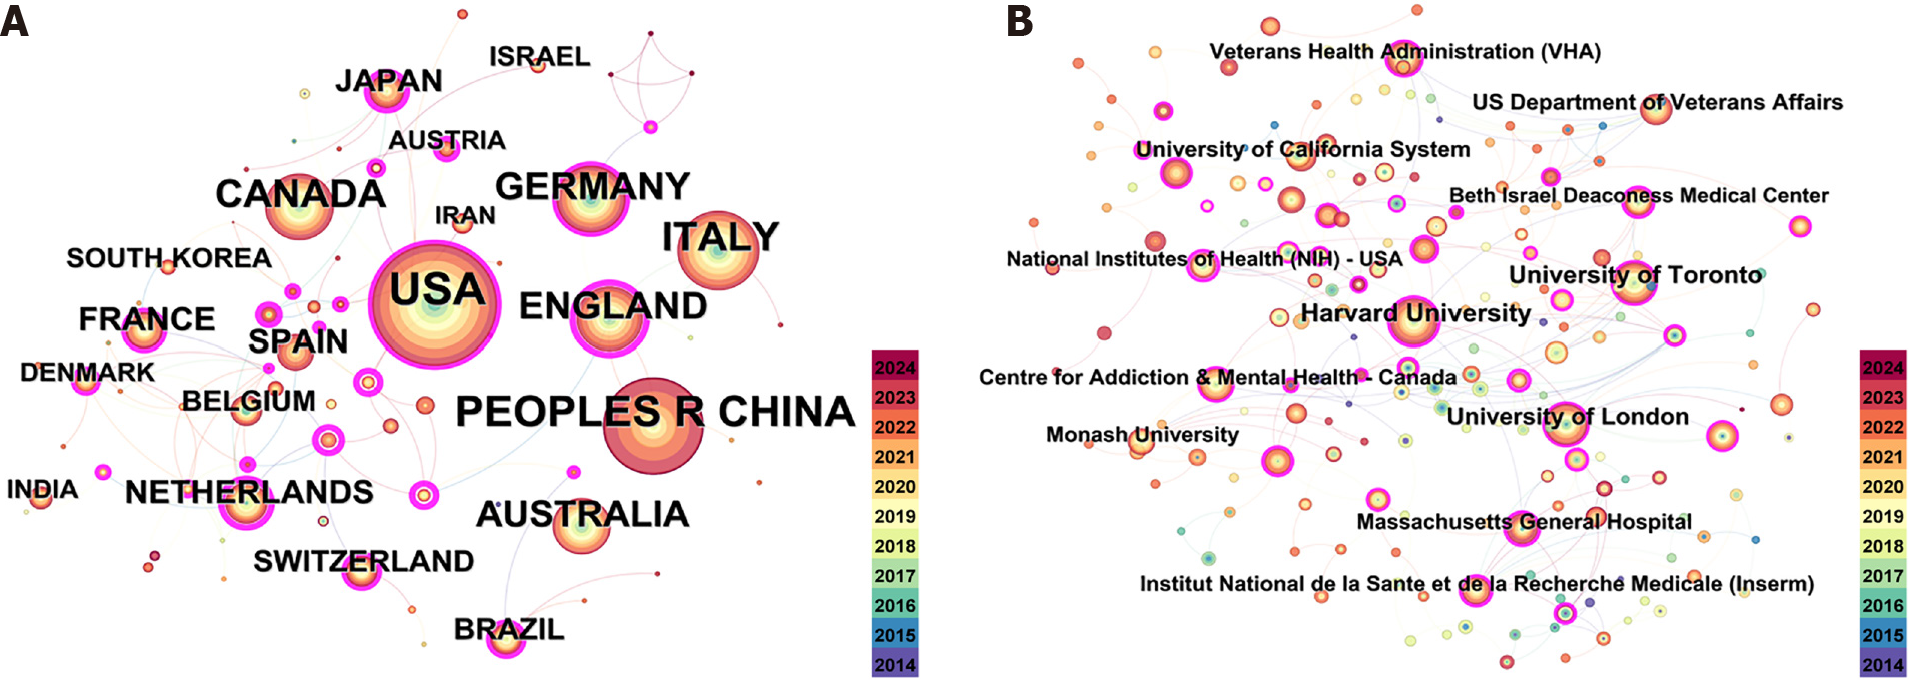
Figure 3 Distribution by country and institution.
A: Analysis map of country co-occurrence; B: Analysis map of institution co-occurrence.
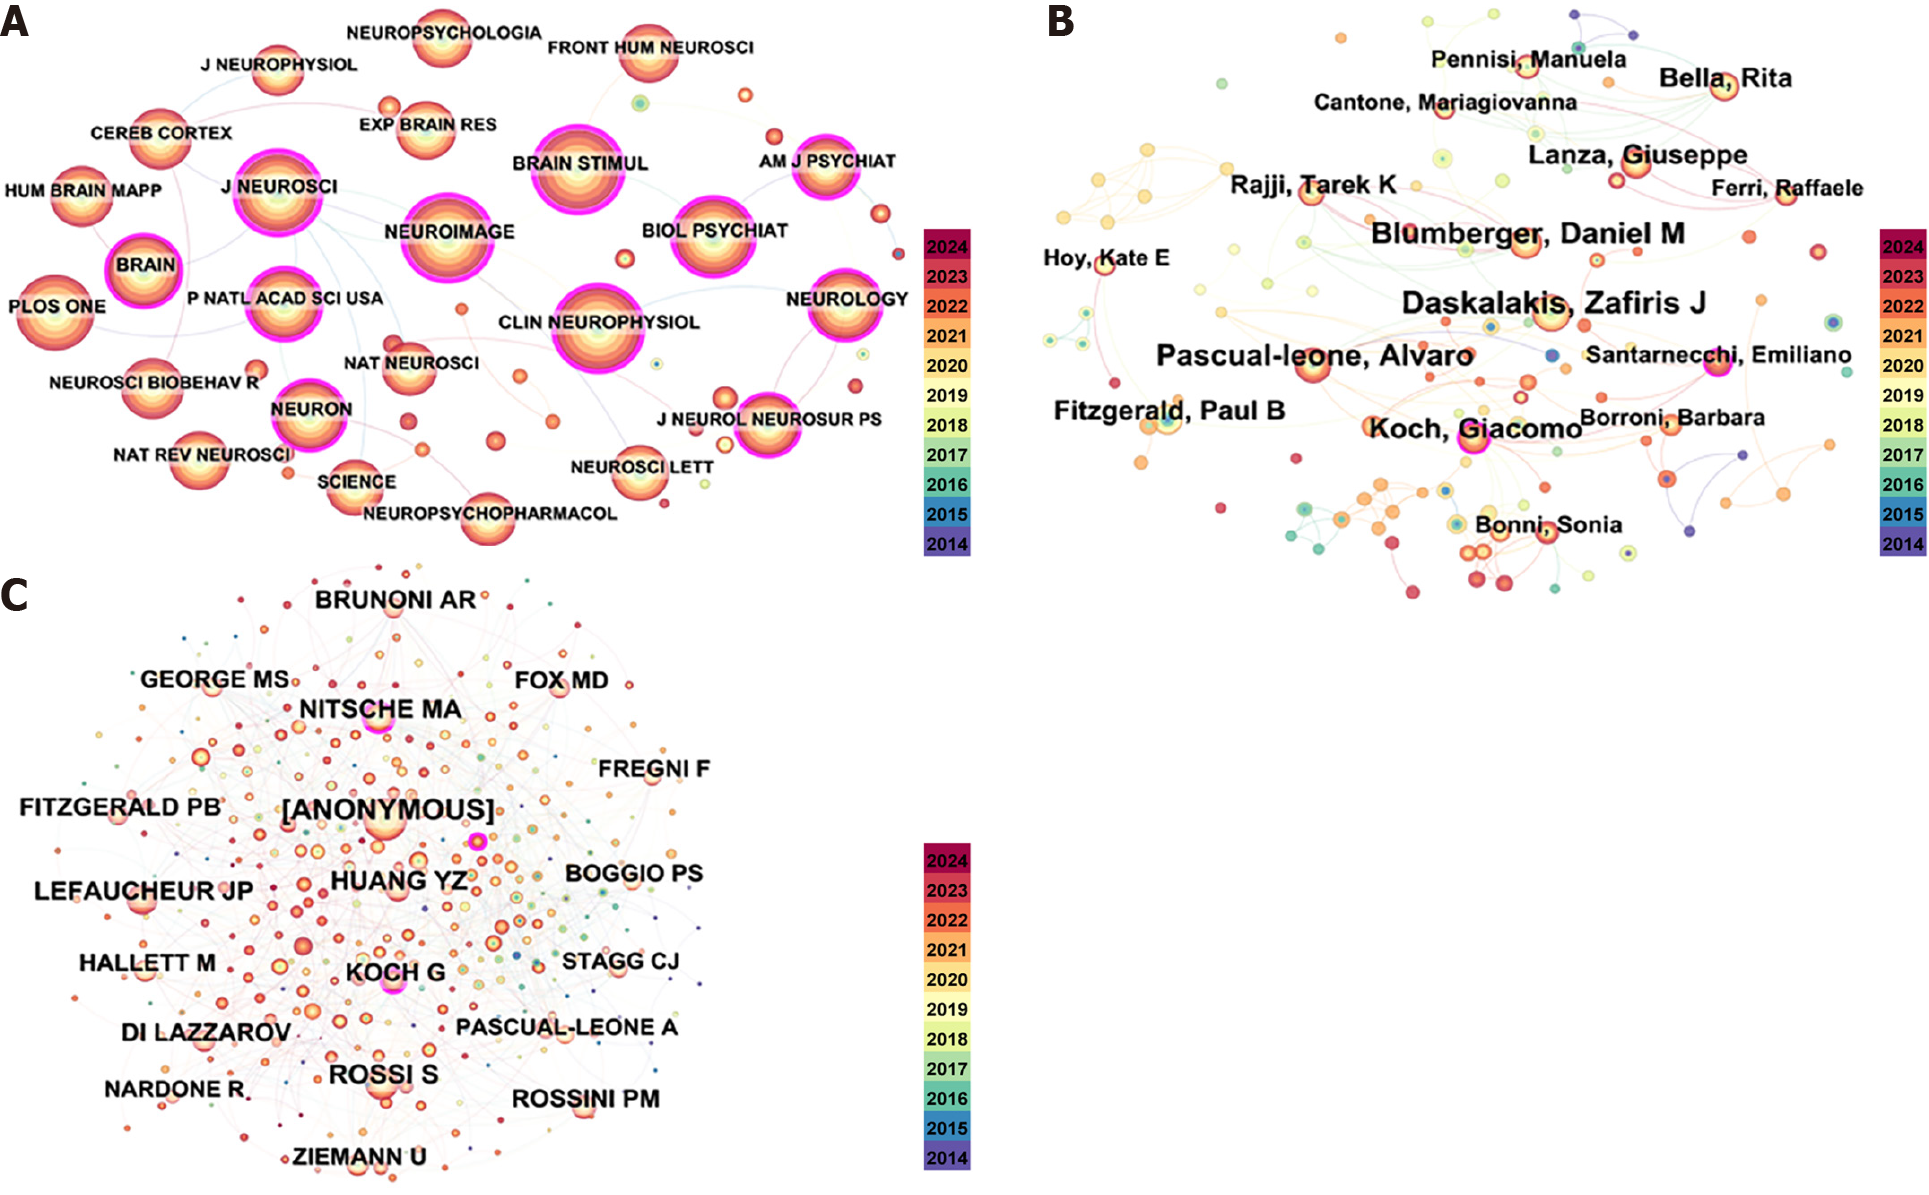
Figure 4 Analysis map.
A: Analysis map of journal co-occurrence; B: Analysis map of co-authors; C: Analysis map of highly cited authors.
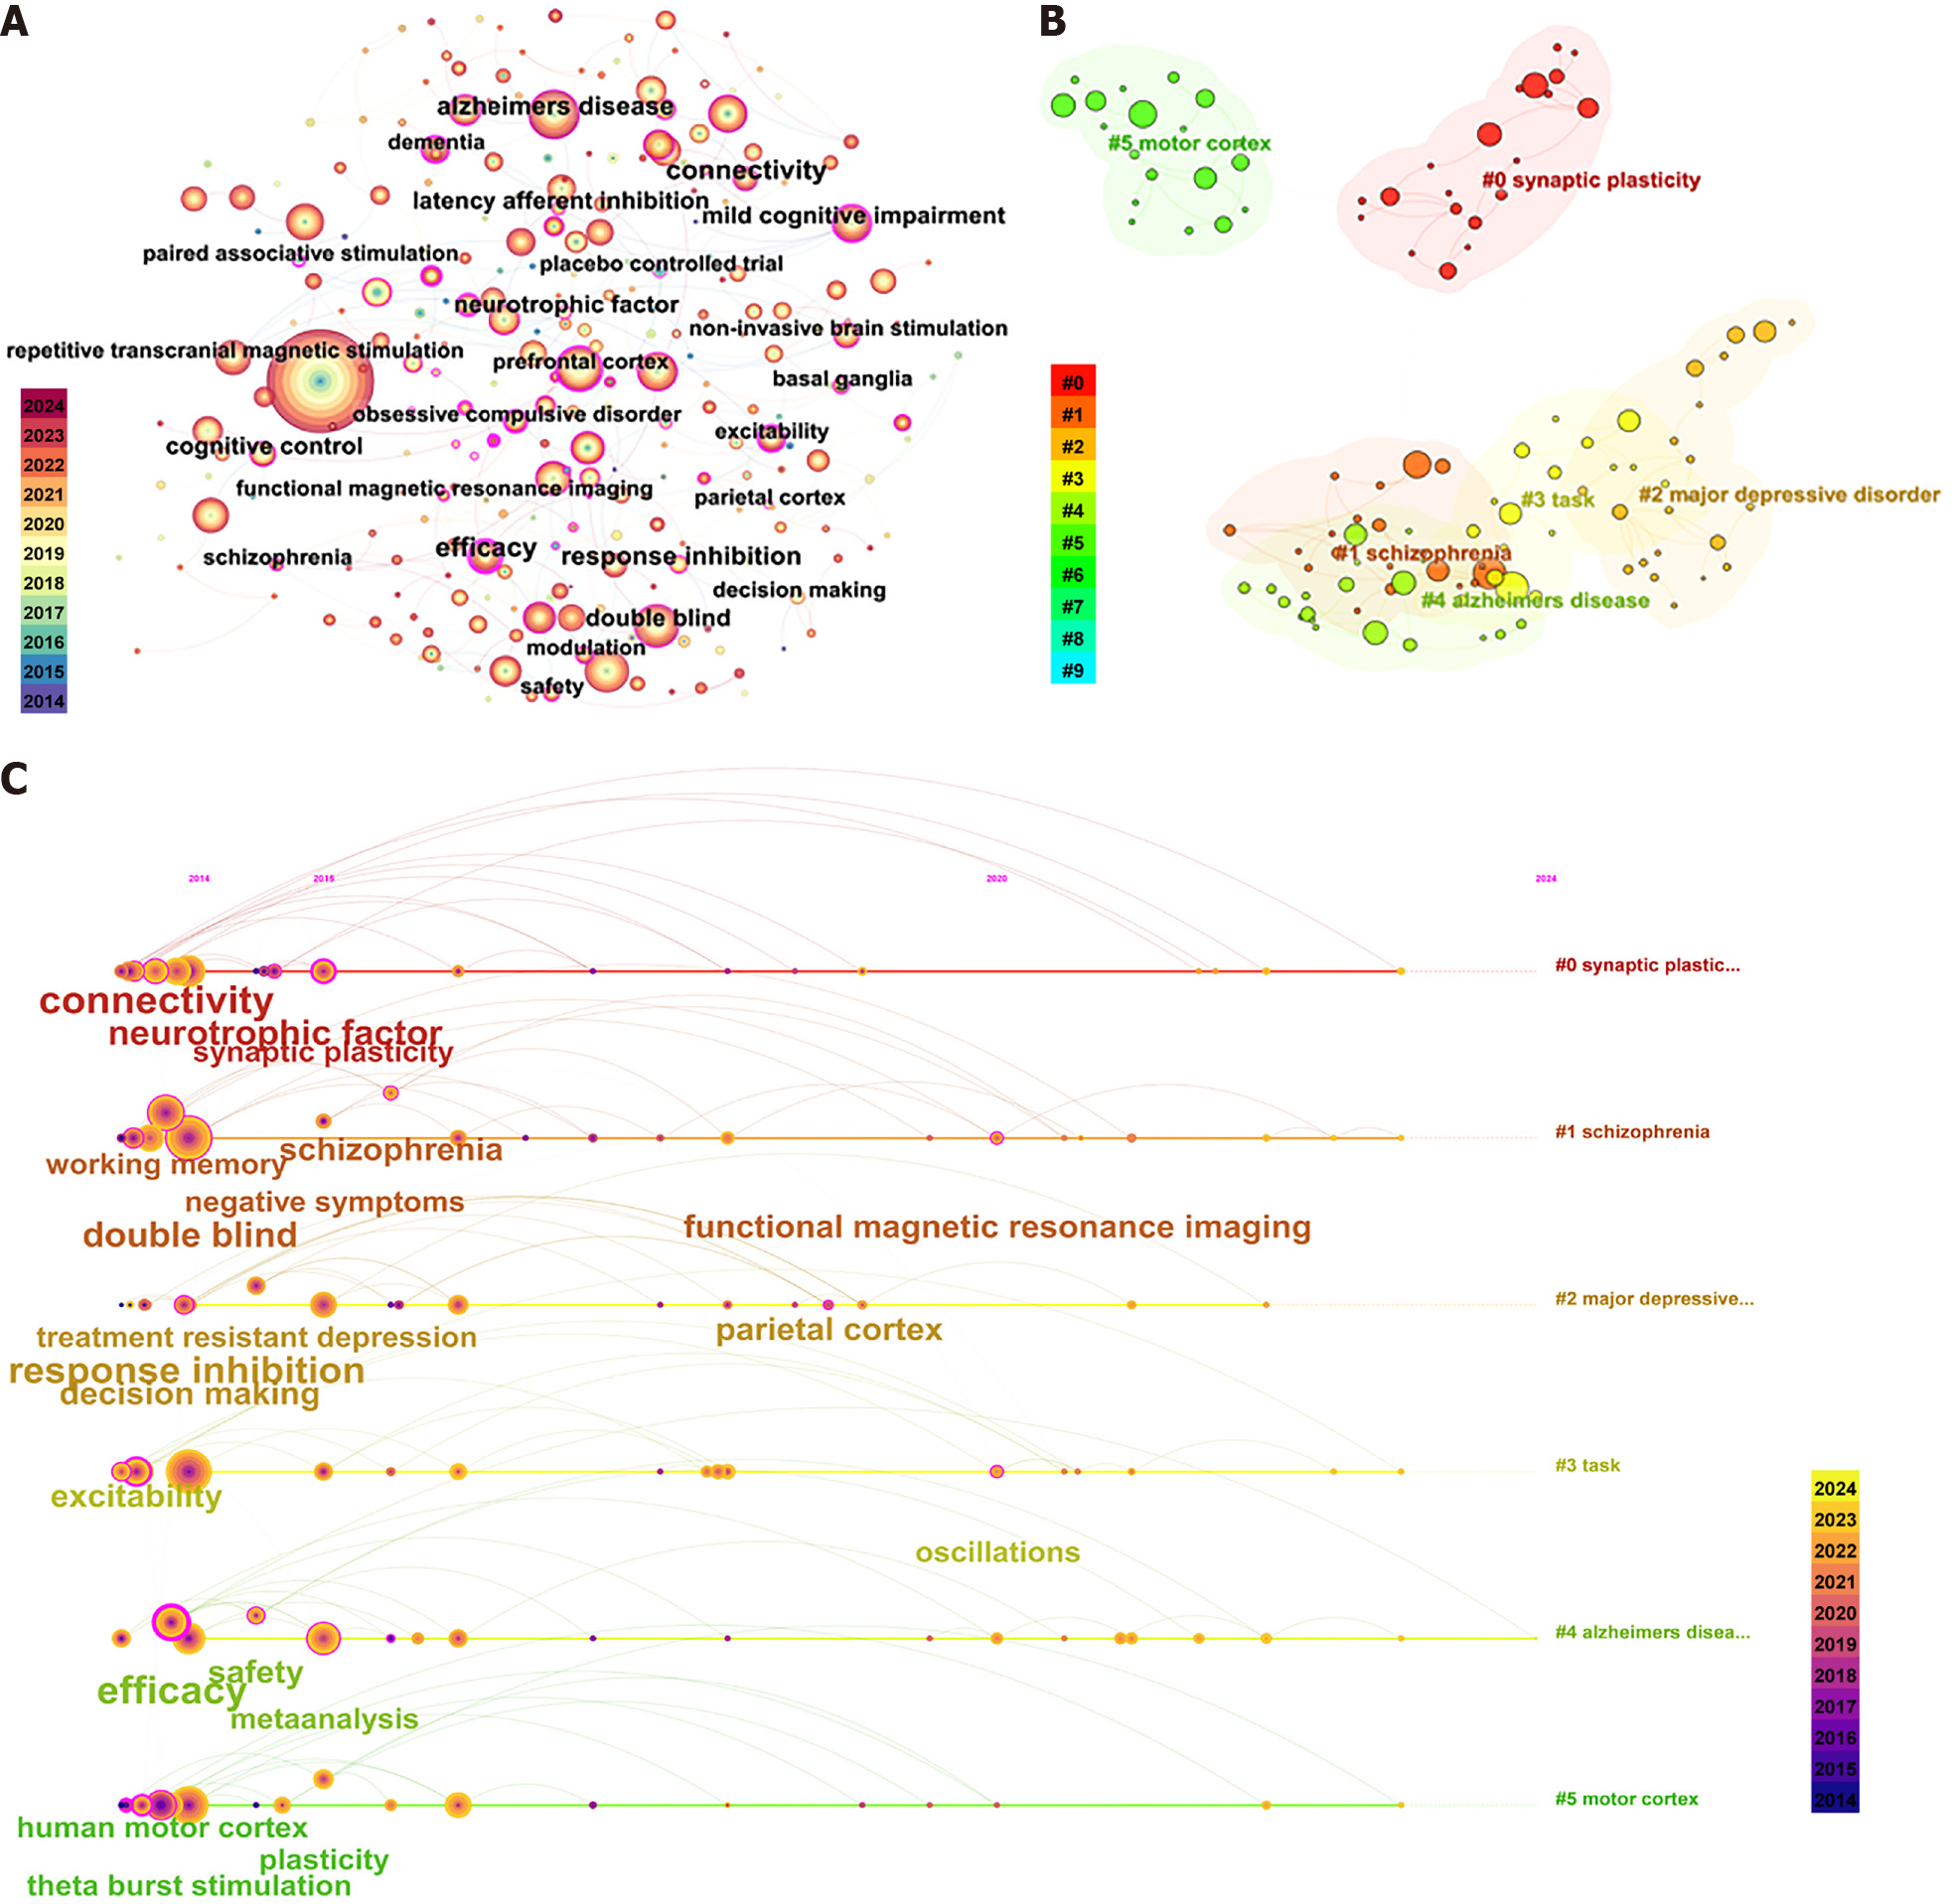
Figure 5 Key words analysis.
A: Map of keyword analysis; B: Keyword cluster analysis graph; C: Keyword cluster co-occurrence time zone map.
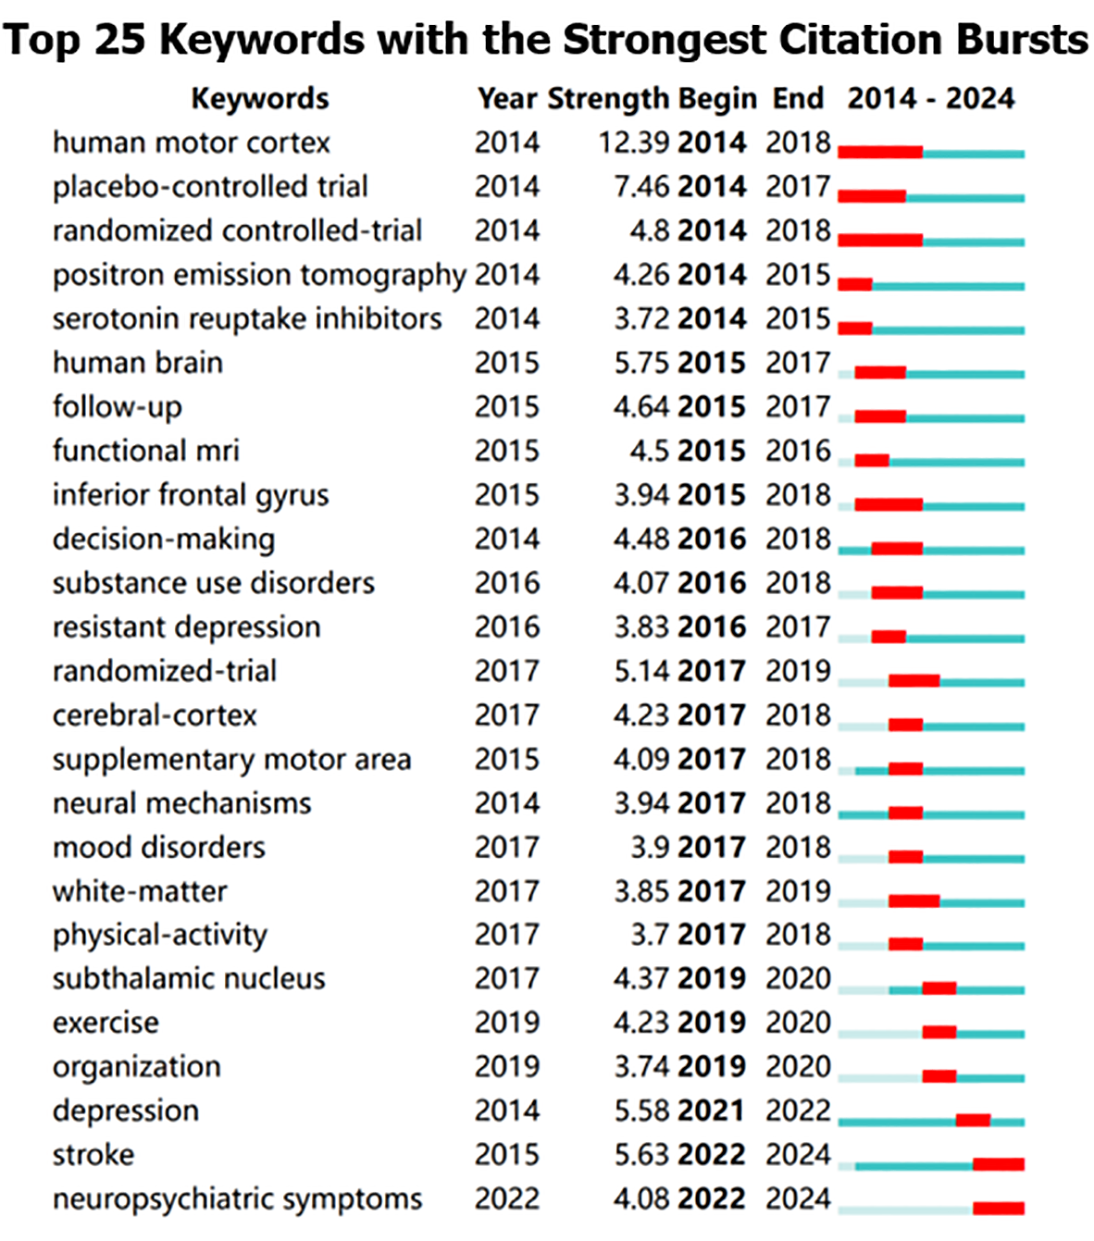
Figure 6 Highest citation burst-producing keywords.
- Citation: Zhang Q, Zhu PP, Yang L, Guo AS. Research hotspots and trends in transcranial magnetic stimulation for cognitive impairment: A bibliometric analysis from 2014 to 2023. World J Psychiatry 2024; 14(10): 1592-1604
- URL: https://www.wjgnet.com/2220-3206/full/v14/i10/1592.htm
- DOI: https://dx.doi.org/10.5498/wjp.v14.i10.1592


