Copyright
©The Author(s) 2023.
World J Psychiatry. Aug 19, 2023; 13(8): 593-606
Published online Aug 19, 2023. doi: 10.5498/wjp.v13.i8.593
Published online Aug 19, 2023. doi: 10.5498/wjp.v13.i8.593
Figure 1 Number of articles analyzed in a bibliometric study on global dialysis and depression-related publications between 1970 and 2022.
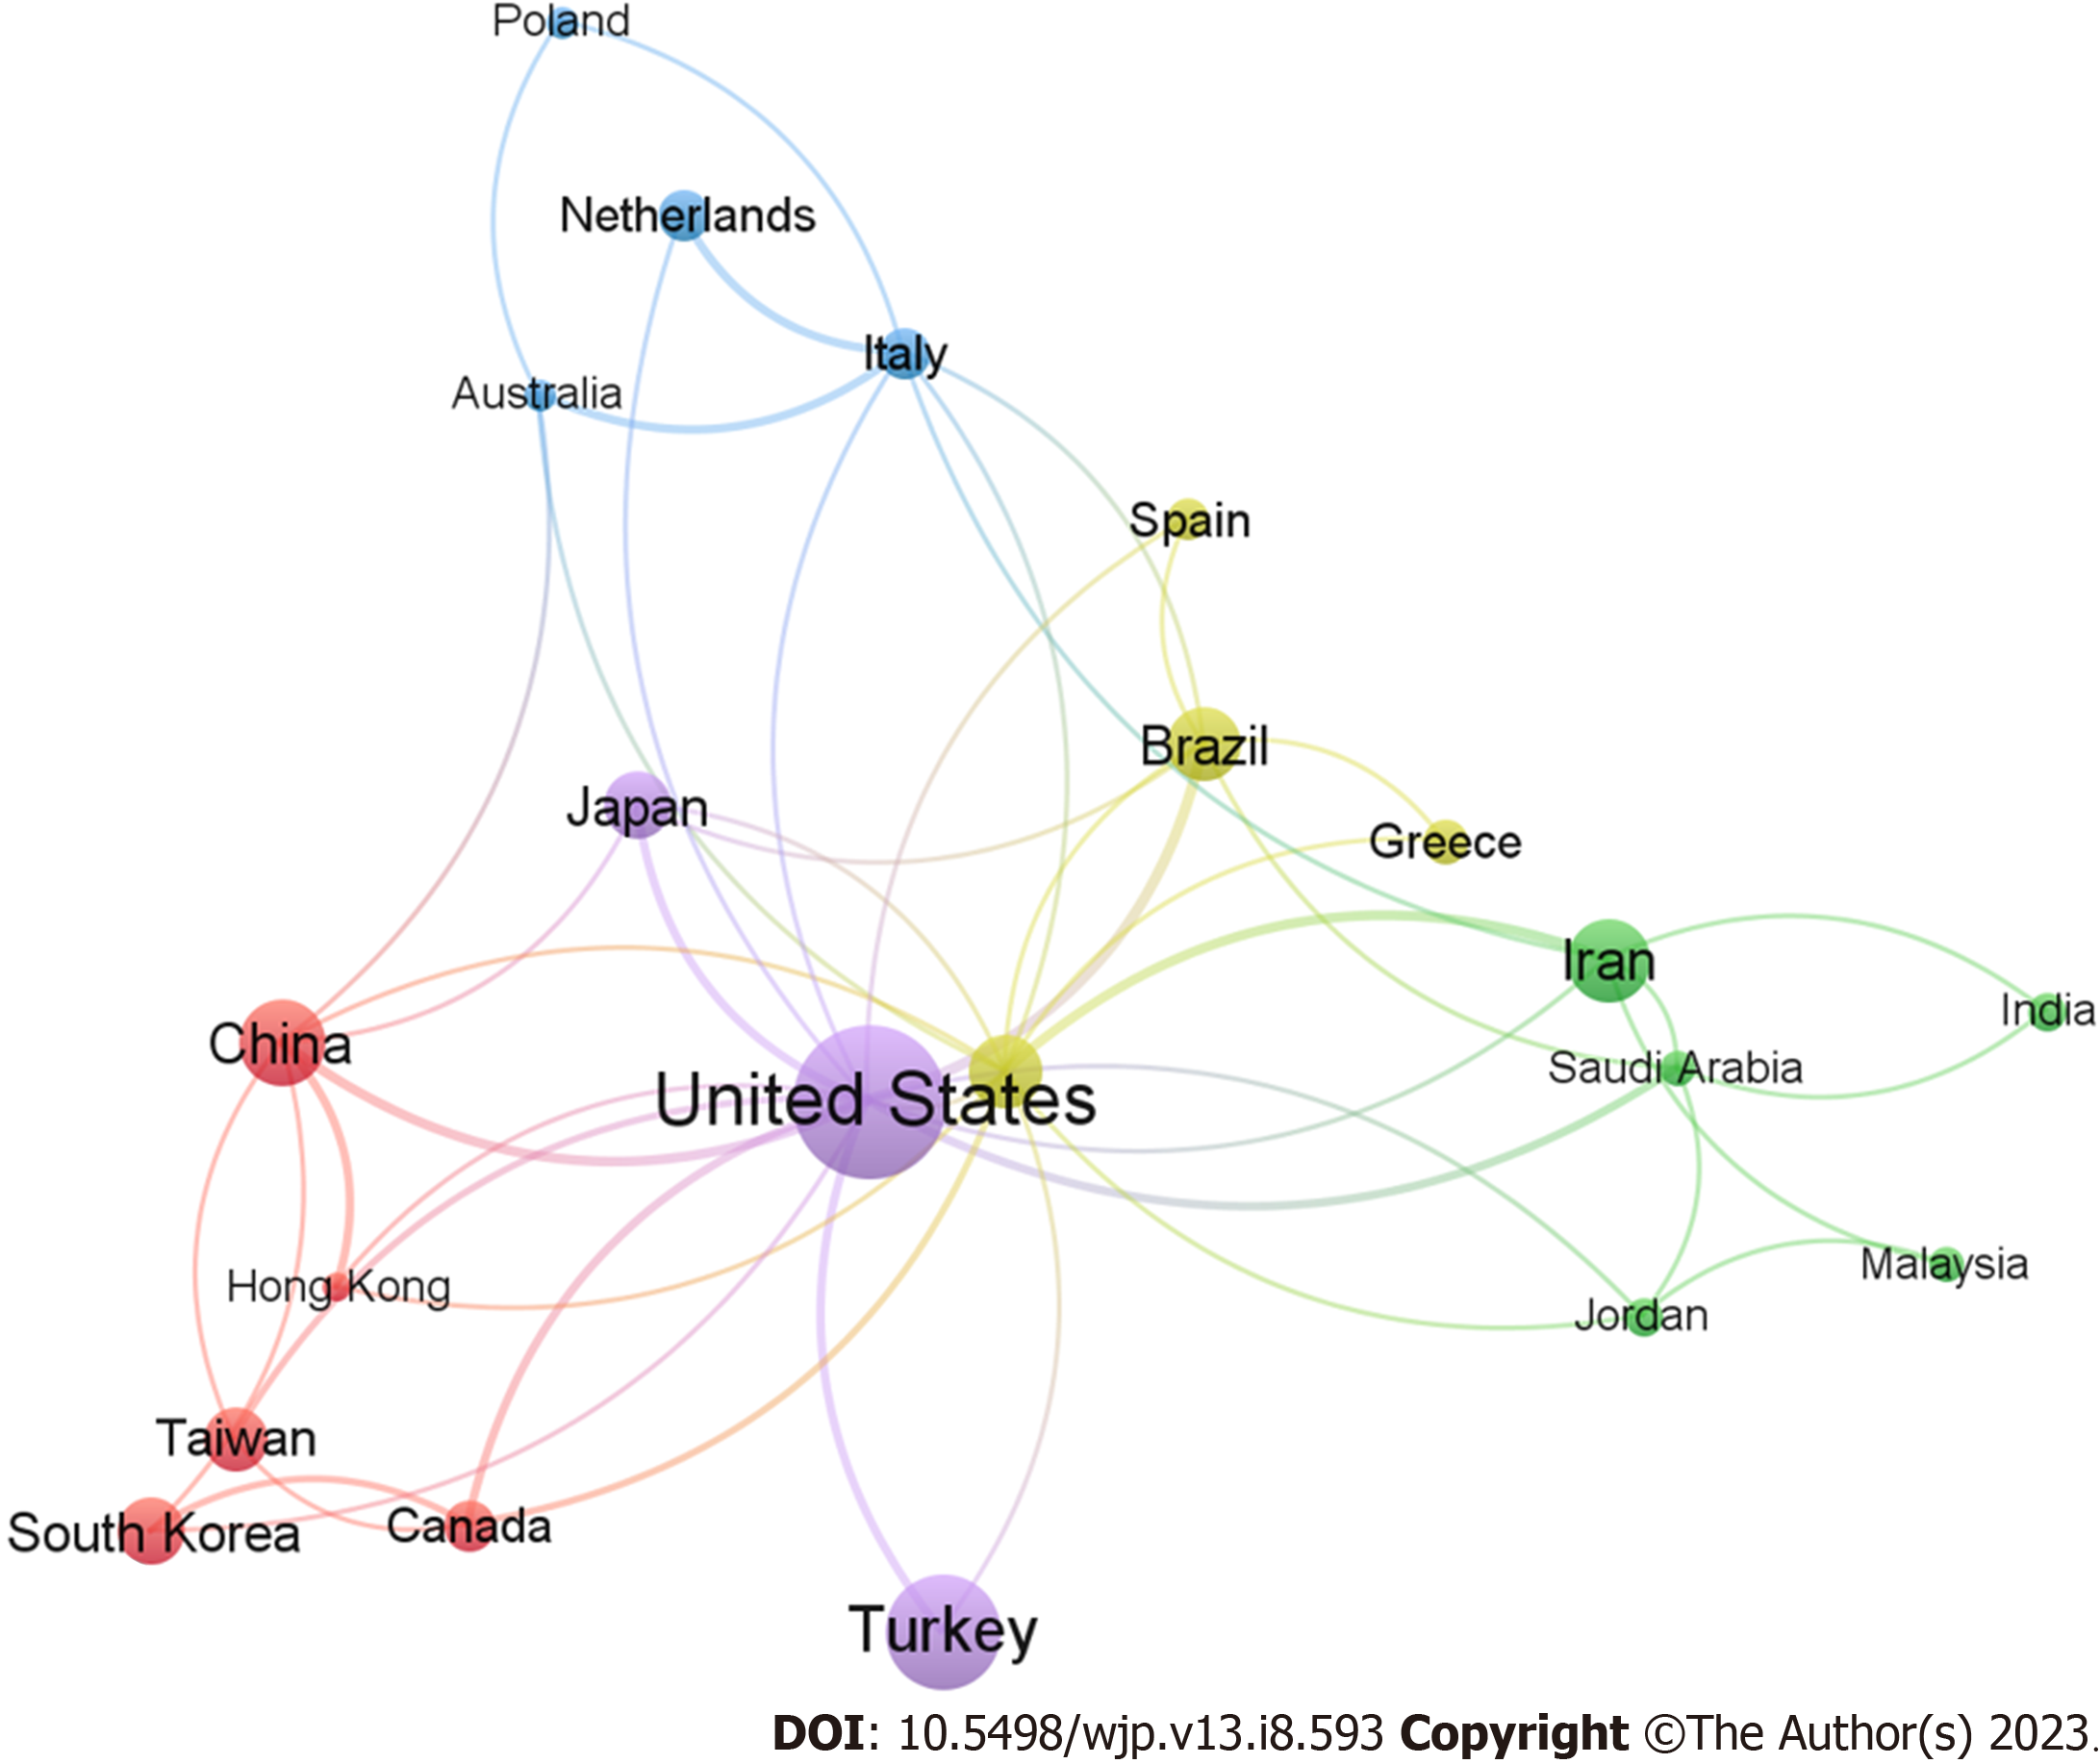
Figure 2 Visualization of the network of international research collaboration on dialysis and depression among 21 countries with a minimum research output of 10 documents.
VOSviewer software version 1.6.19 was used to generate the map.
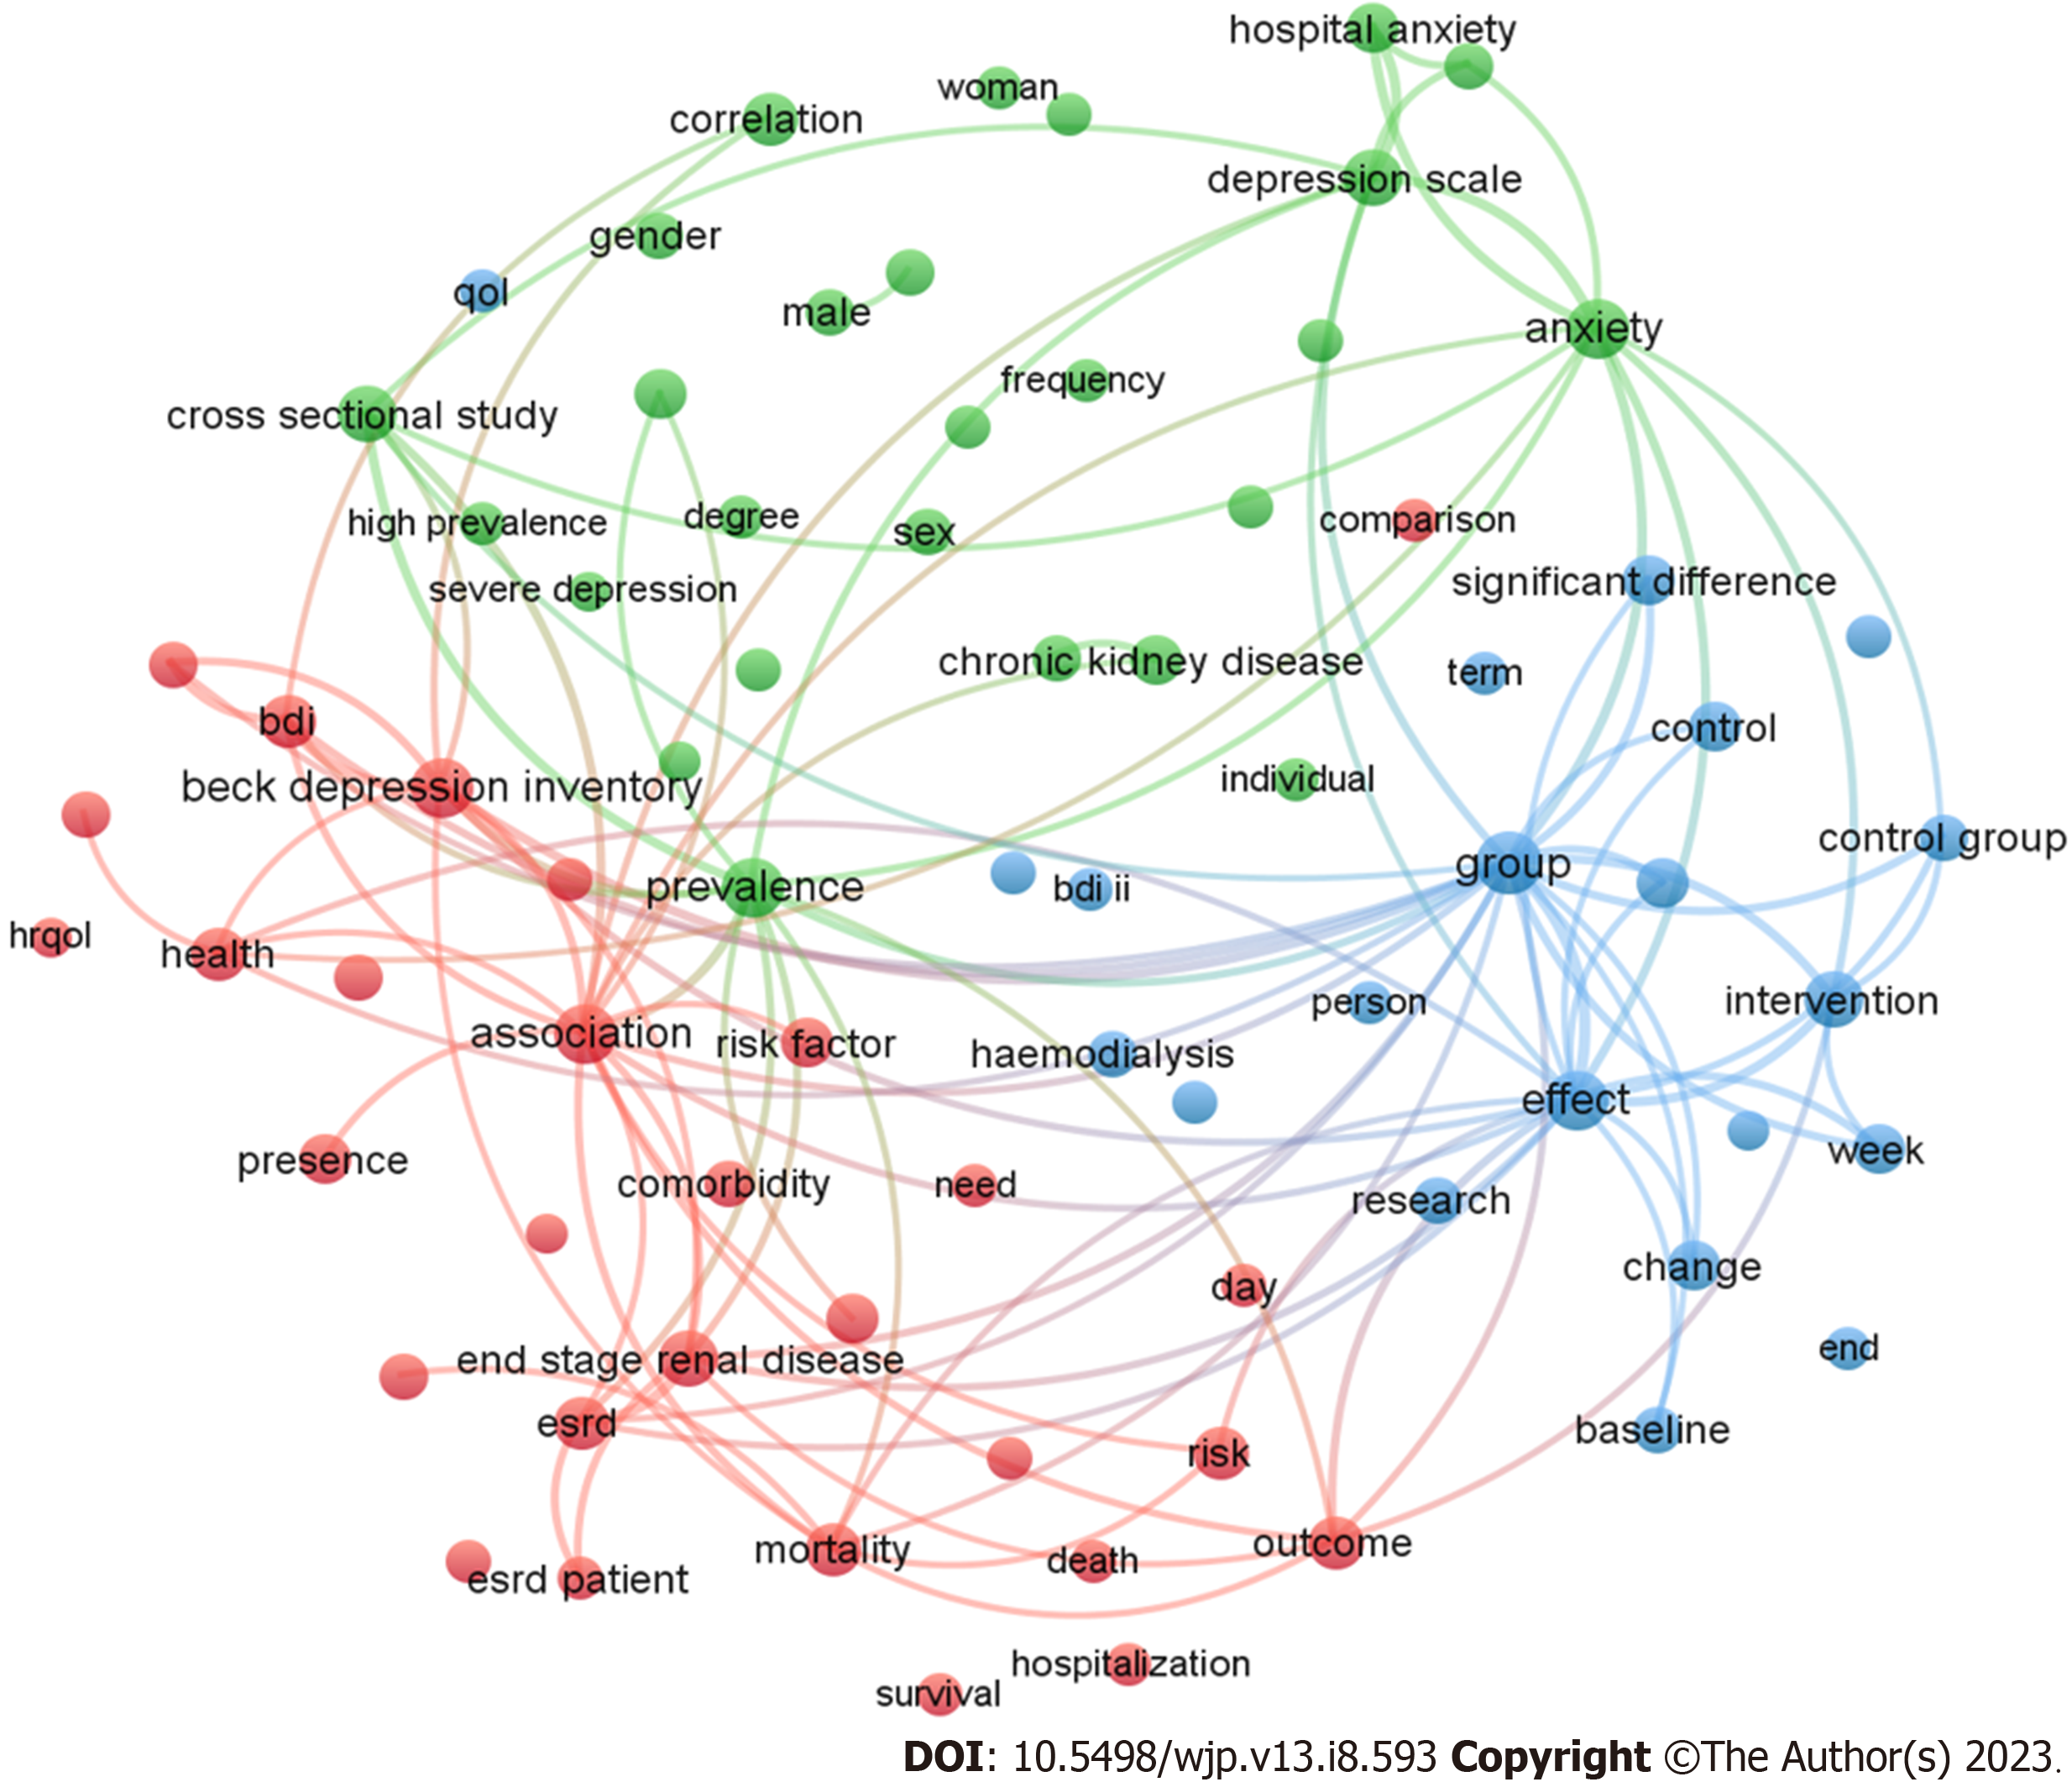
Figure 3 Map visualizing the network analysis of terms found in titles and abstracts, with a minimum frequency of ten or more.
Terms are represented as nodes, and the associations between them are depicted as lines or links. The thickness of the lines represents the strength of the association between the terms. VOSviewer software version 1.6.19 was used to generate the map.
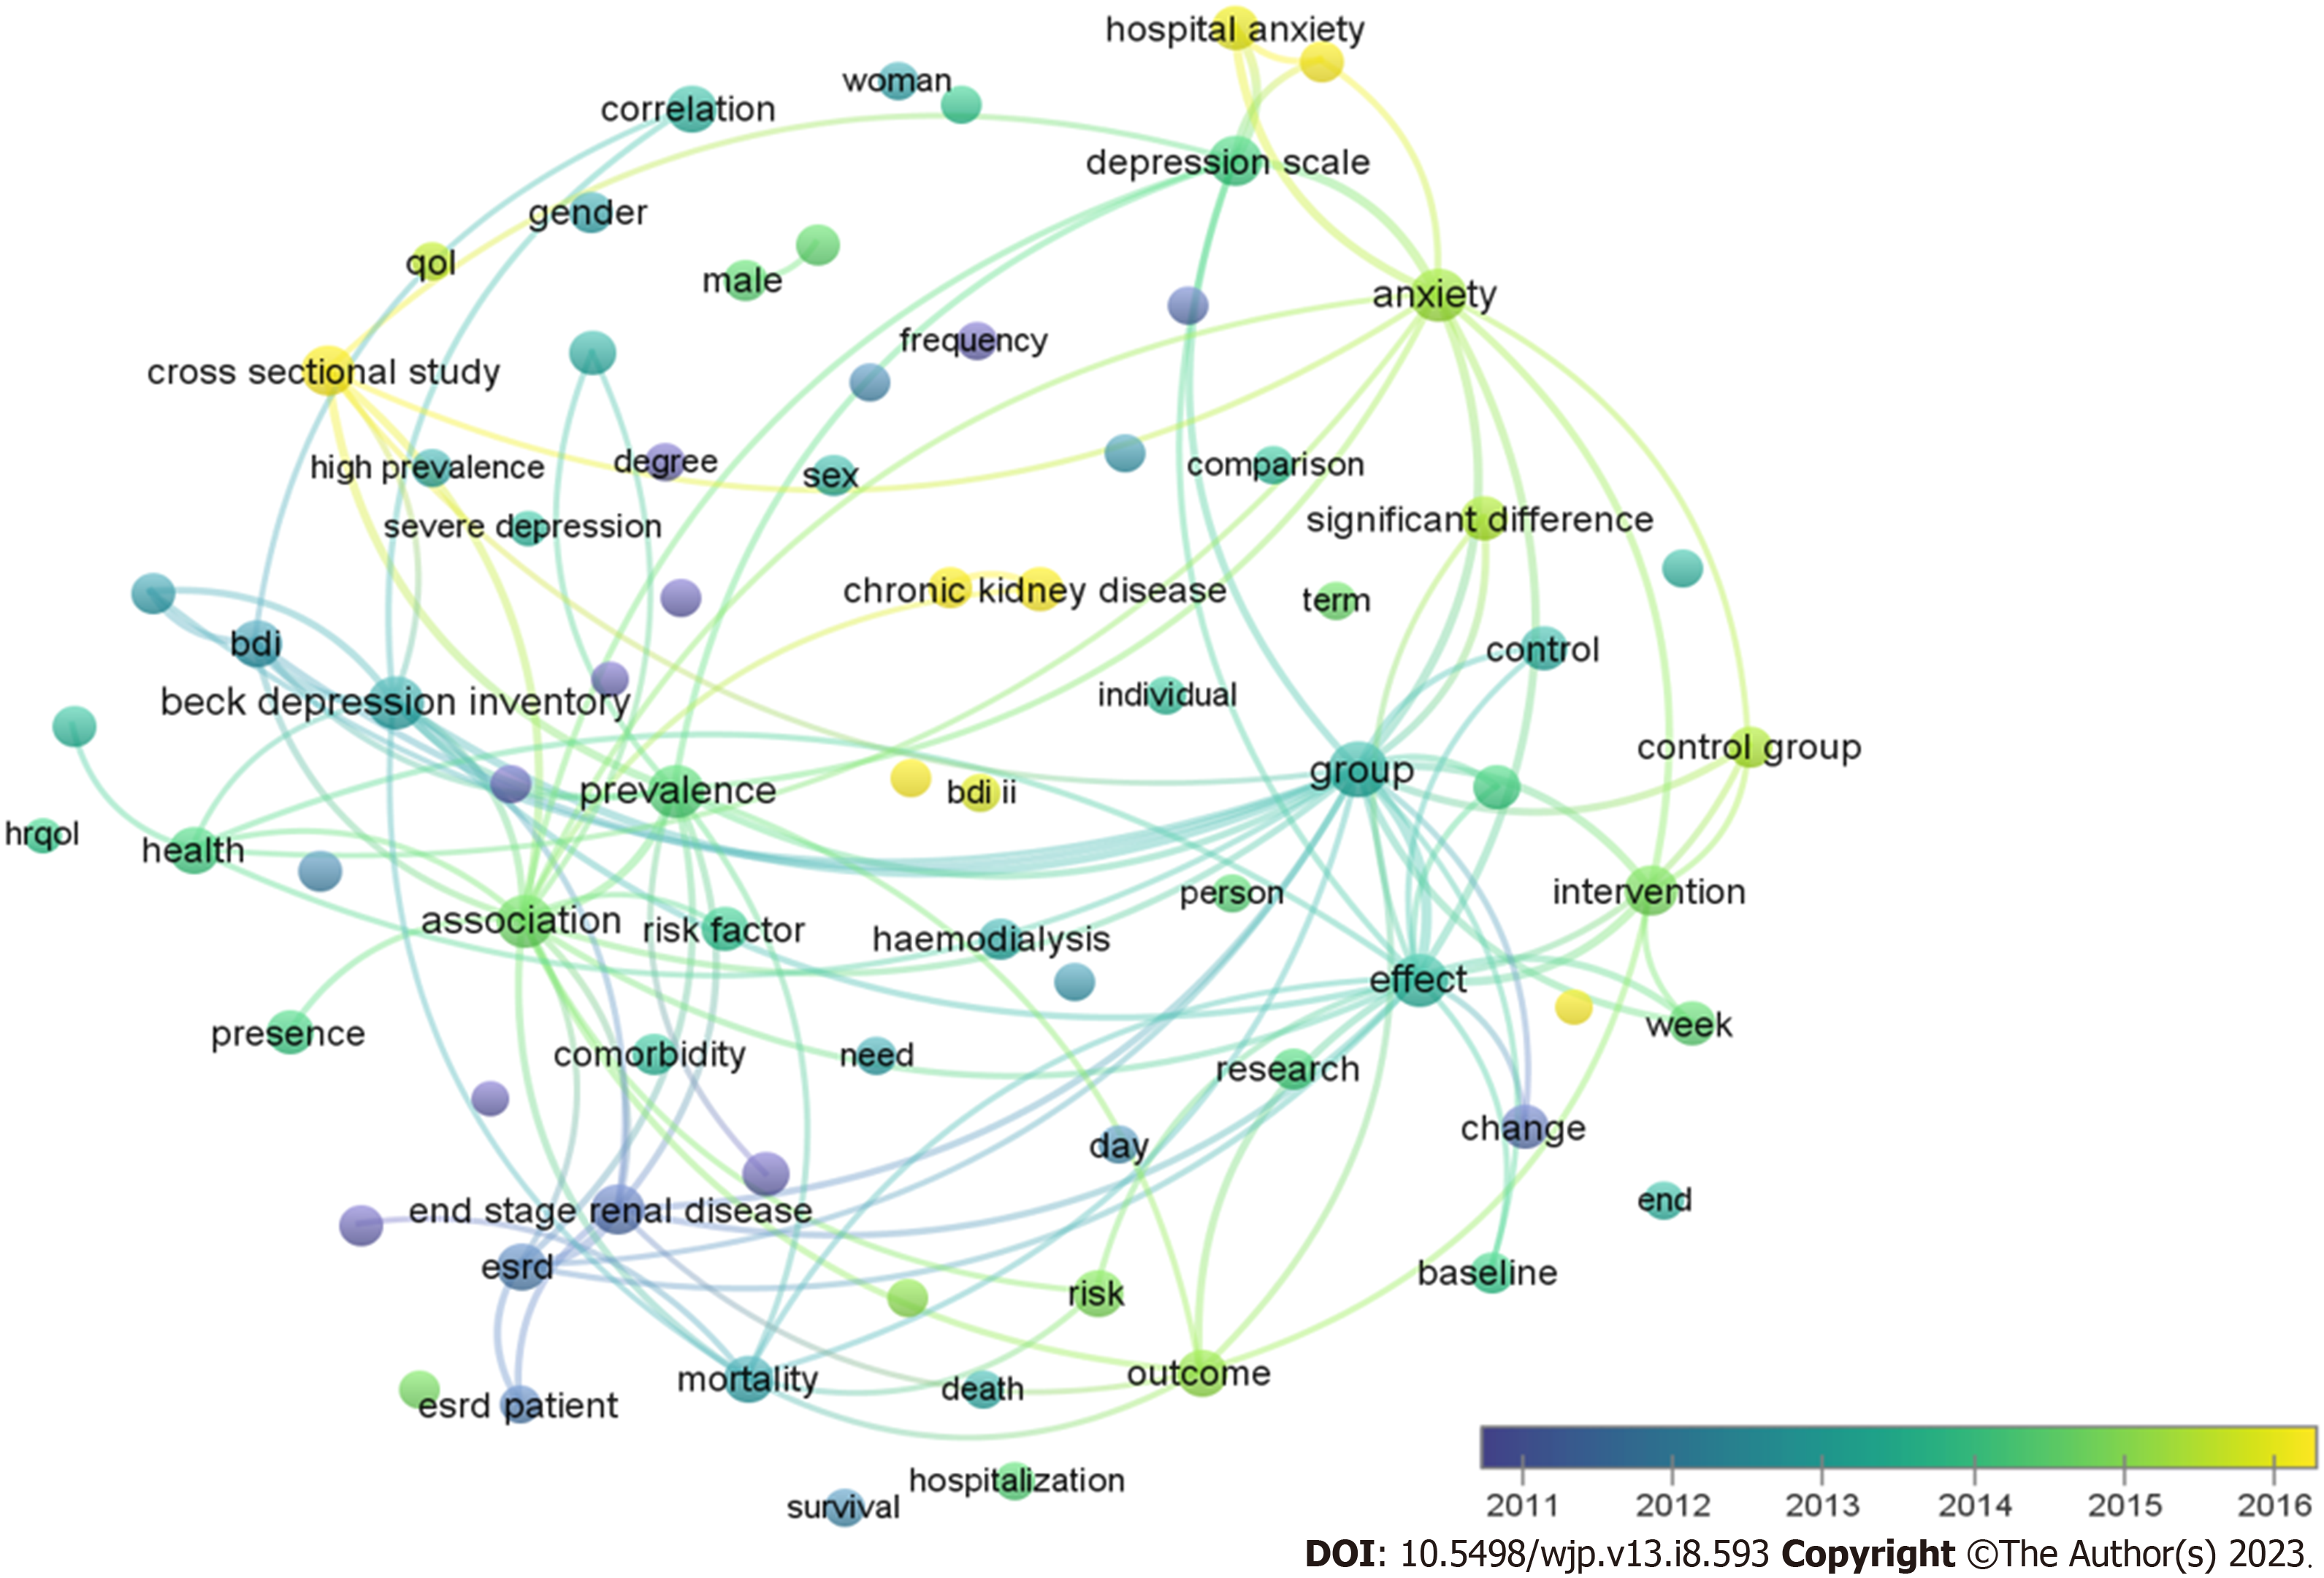
Figure 4 Map of a network visualization analysis of terms in titles and abstracts based on their frequency of appearance.
Blue indicates earlier occurrences of the terms, whereas yellow indicates later occurrences. VOSviewer software version 1.6.19 was utilized to create the map.
- Citation: Al-Jabi SW. Global research trends and mapping knowledge structure of depression in dialysis patients. World J Psychiatry 2023; 13(8): 593-606
- URL: https://www.wjgnet.com/2220-3206/full/v13/i8/593.htm
- DOI: https://dx.doi.org/10.5498/wjp.v13.i8.593


