Copyright
©The Author(s) 2023.
World J Psychiatry. Aug 19, 2023; 13(8): 533-542
Published online Aug 19, 2023. doi: 10.5498/wjp.v13.i8.533
Published online Aug 19, 2023. doi: 10.5498/wjp.v13.i8.533
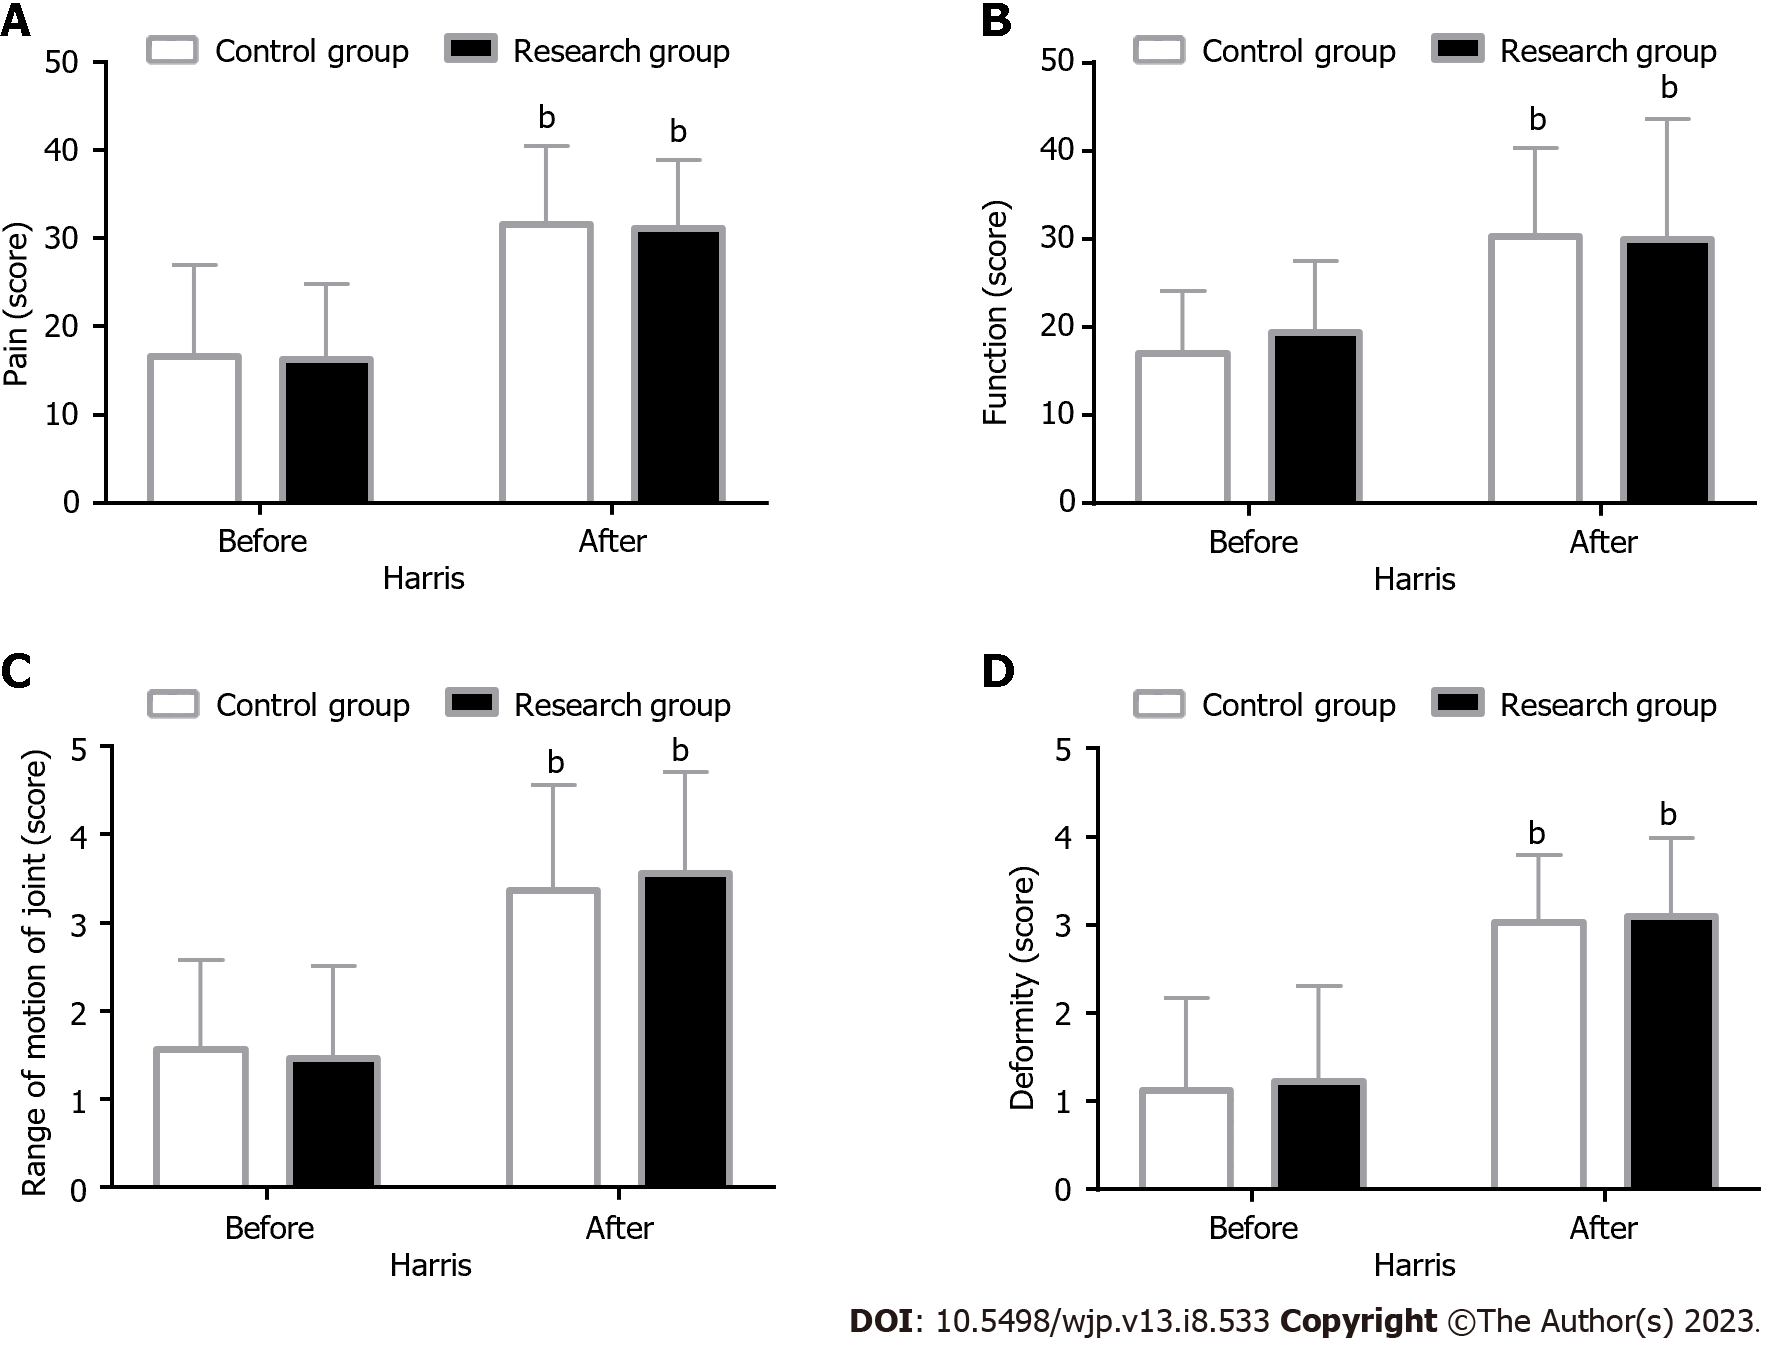
Figure 1 Hip function.
A: There are no significant differences between the research and control groups in pre- and post-interventional pain scores; however, elevated pain scores relative to the pre-interventional values are observed in both groups; B: There are no significant differences between the two groups in pre- and post-interventional function scores; however, elevated function scores relative to the pre-interventional values are observed in both groups; C: There are no significant differences between the two groups in pre- and post-interventional joint range of motion (ROM) scores; however, elevated joint ROM scores relative to the pre-interventional values are observed in both groups; D: There are no significant differences between the two groups in pre- and post-interventional deformity scores; however, elevated deformity scores relative to the pre-interventional values are observed in both groups. bP < 0.01 vs before intervention. ROM: Range of motion.
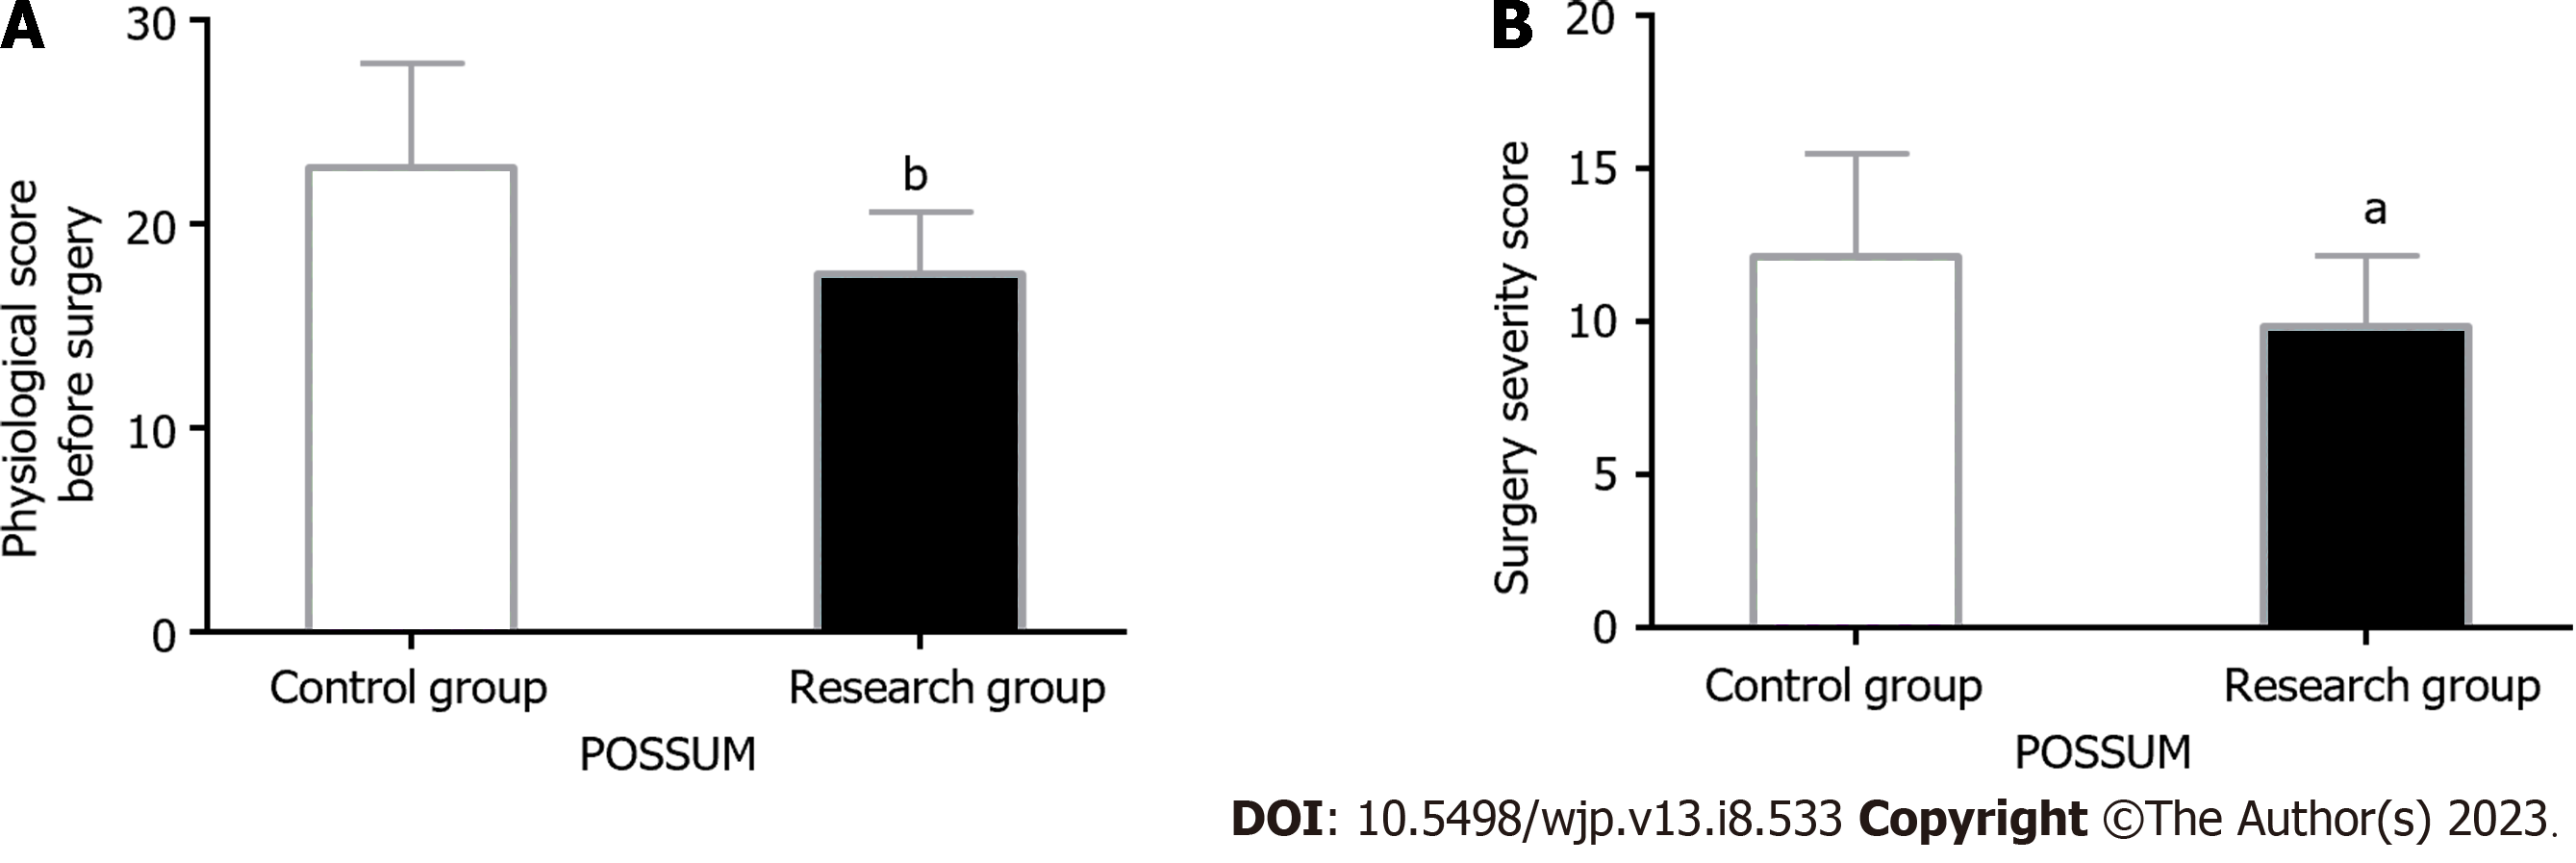
Figure 2 Orthopedic Physiological and Operative Severity Score for the Enumeration of Mortality and Morbidity scale scores.
A: Preoperative physiological scores are significantly lower in the research group than in the control group; B: Surgical severity scores are lower in the research group than in the control group. aP < 0.05 and bP < 0.01 vs control group. POSSUM: Physiological and Operative Severity Score for the Enumeration of Mortality and Morbidity.
Figure 3 Cognitive function.
A: Montreal cognitive assessment scale scores are markedly reduced in the research group but remained higher than the control group after intervention; B: Mini-Cog scores are slightly altered in the research group but remained higher than in the control group after intervention. bP < 0.01 vs before intervention; P < 0.05 vs control group. MoCA: Montreal cognitive assessment scale; Mini-Cog: Mini-Cognitive.
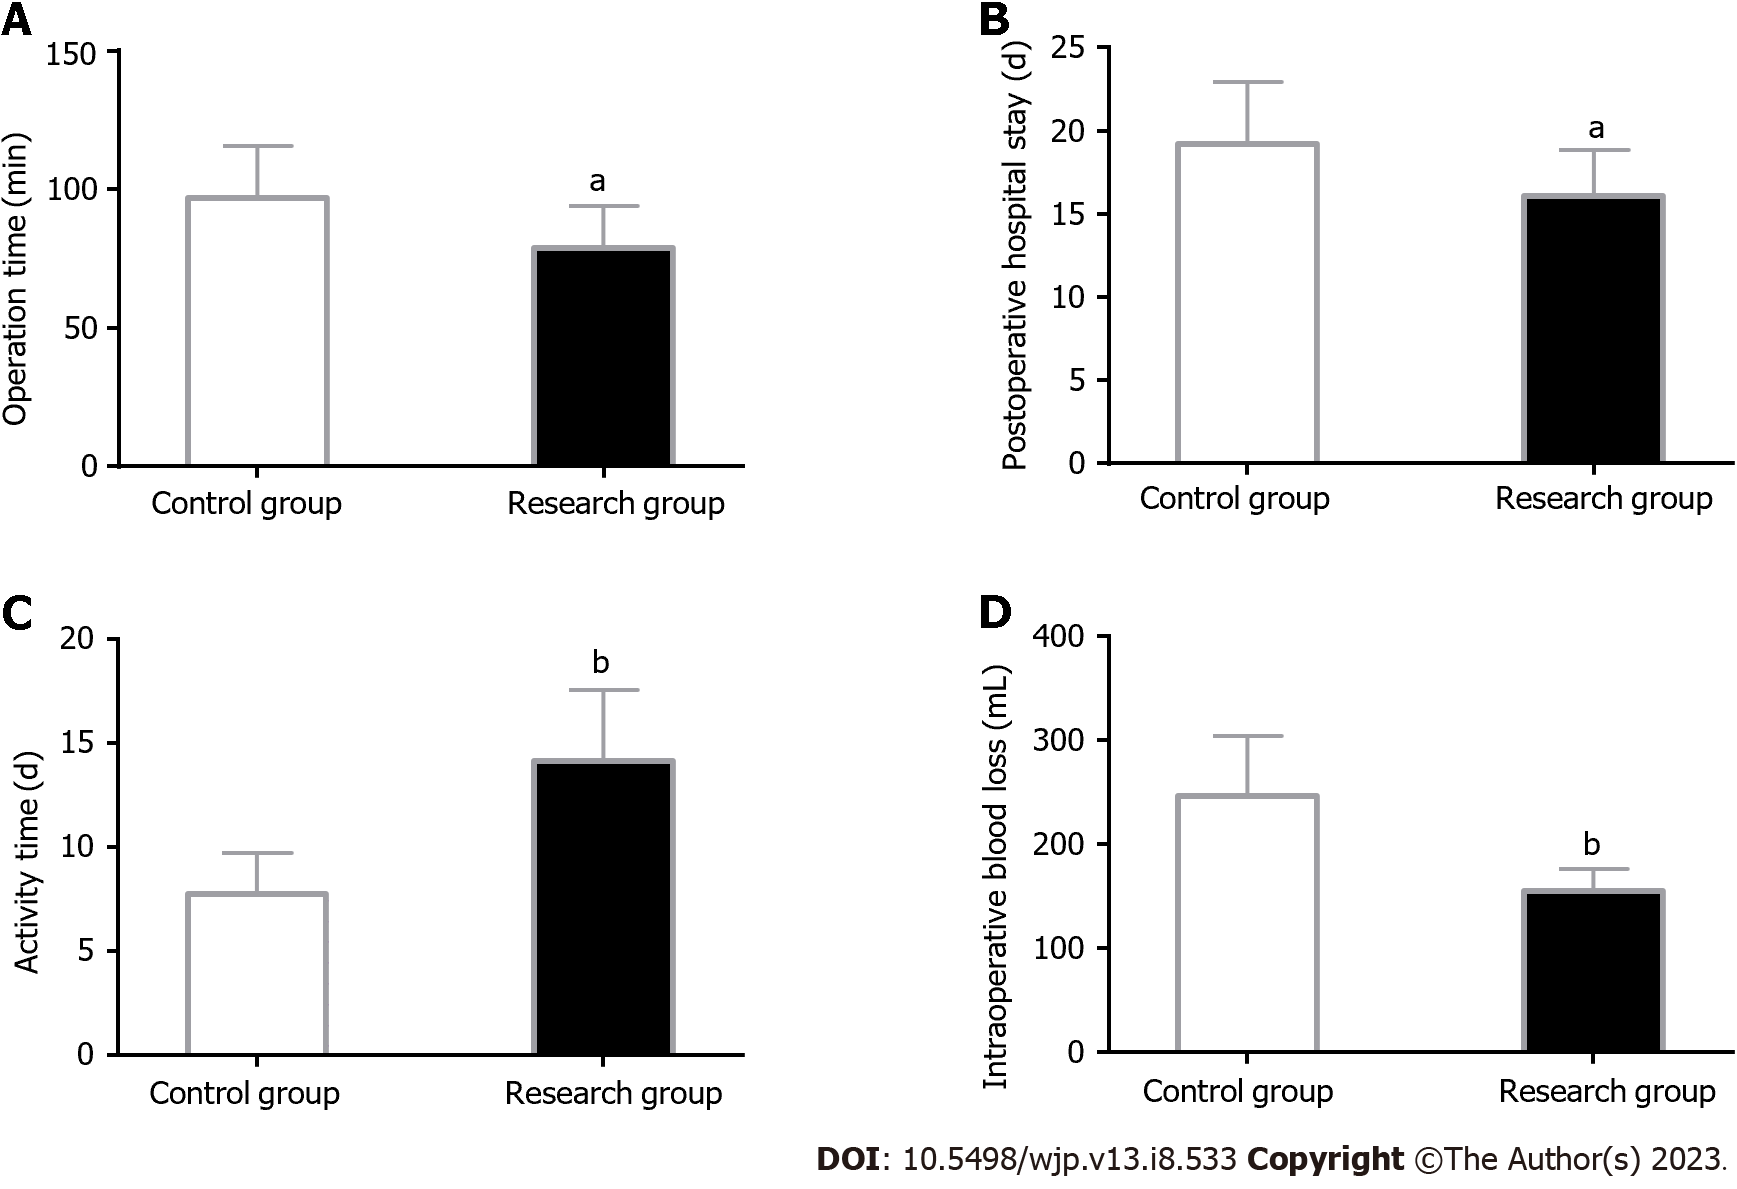
Figure 4 Clinical indicators.
A: Operation time is significantly shorter in the research group than in the control group; B: Postoperative hospital length of stay is significantly shorter in the research group than in the control group; C: Activity time is significantly longer in the research group than in the control group; D: Intraoperative blood loss is statistically less in the research group than in the control group. aP < 0.05 and bP < 0.01 vs control group.
- Citation: Zhou X, Chen XH, Li SH, Li N, Liu F, Wang HM. Effects of surgical treatment modalities on postoperative cognitive function and delirium in elderly patients with extremely unstable hip fractures. World J Psychiatry 2023; 13(8): 533-542
- URL: https://www.wjgnet.com/2220-3206/full/v13/i8/533.htm
- DOI: https://dx.doi.org/10.5498/wjp.v13.i8.533


