Copyright
©The Author(s) 2023.
World J Psychiatry. Aug 19, 2023; 13(8): 511-523
Published online Aug 19, 2023. doi: 10.5498/wjp.v13.i8.511
Published online Aug 19, 2023. doi: 10.5498/wjp.v13.i8.511
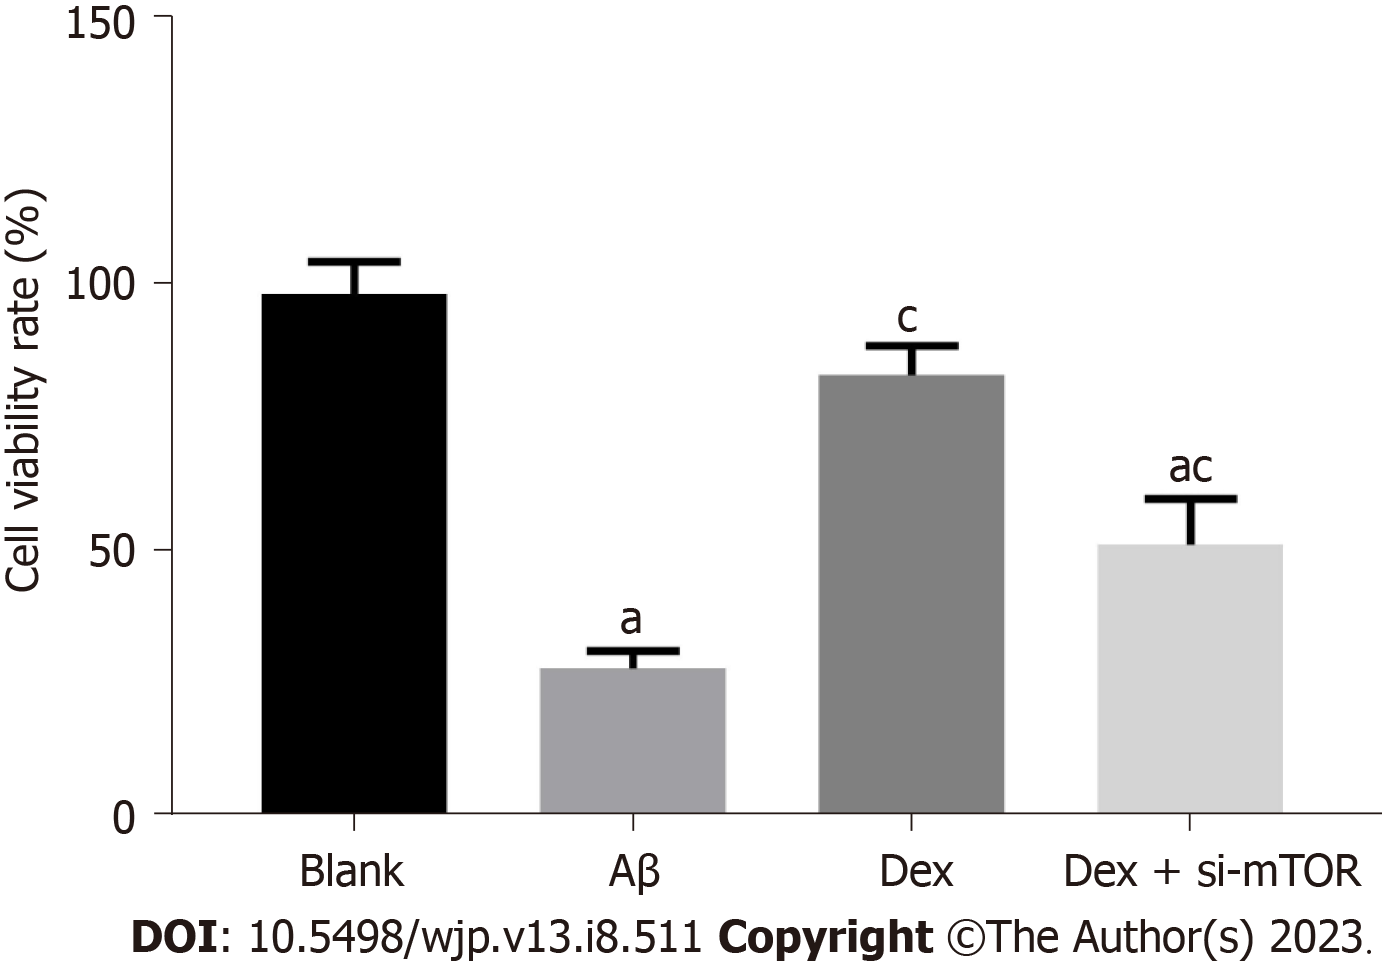
Figure 1 Comparison of the activity levels of hippocampal neurons in mice in the different treatment groups.
aP < 0.05, compared with the blank group; cP < 0.05, compared with the dexmedetomidine group. Aβ: Amyloid β; Dex: Dexmedetomidine; si-mTOR: Mammalian target of rapamycin siRNA.
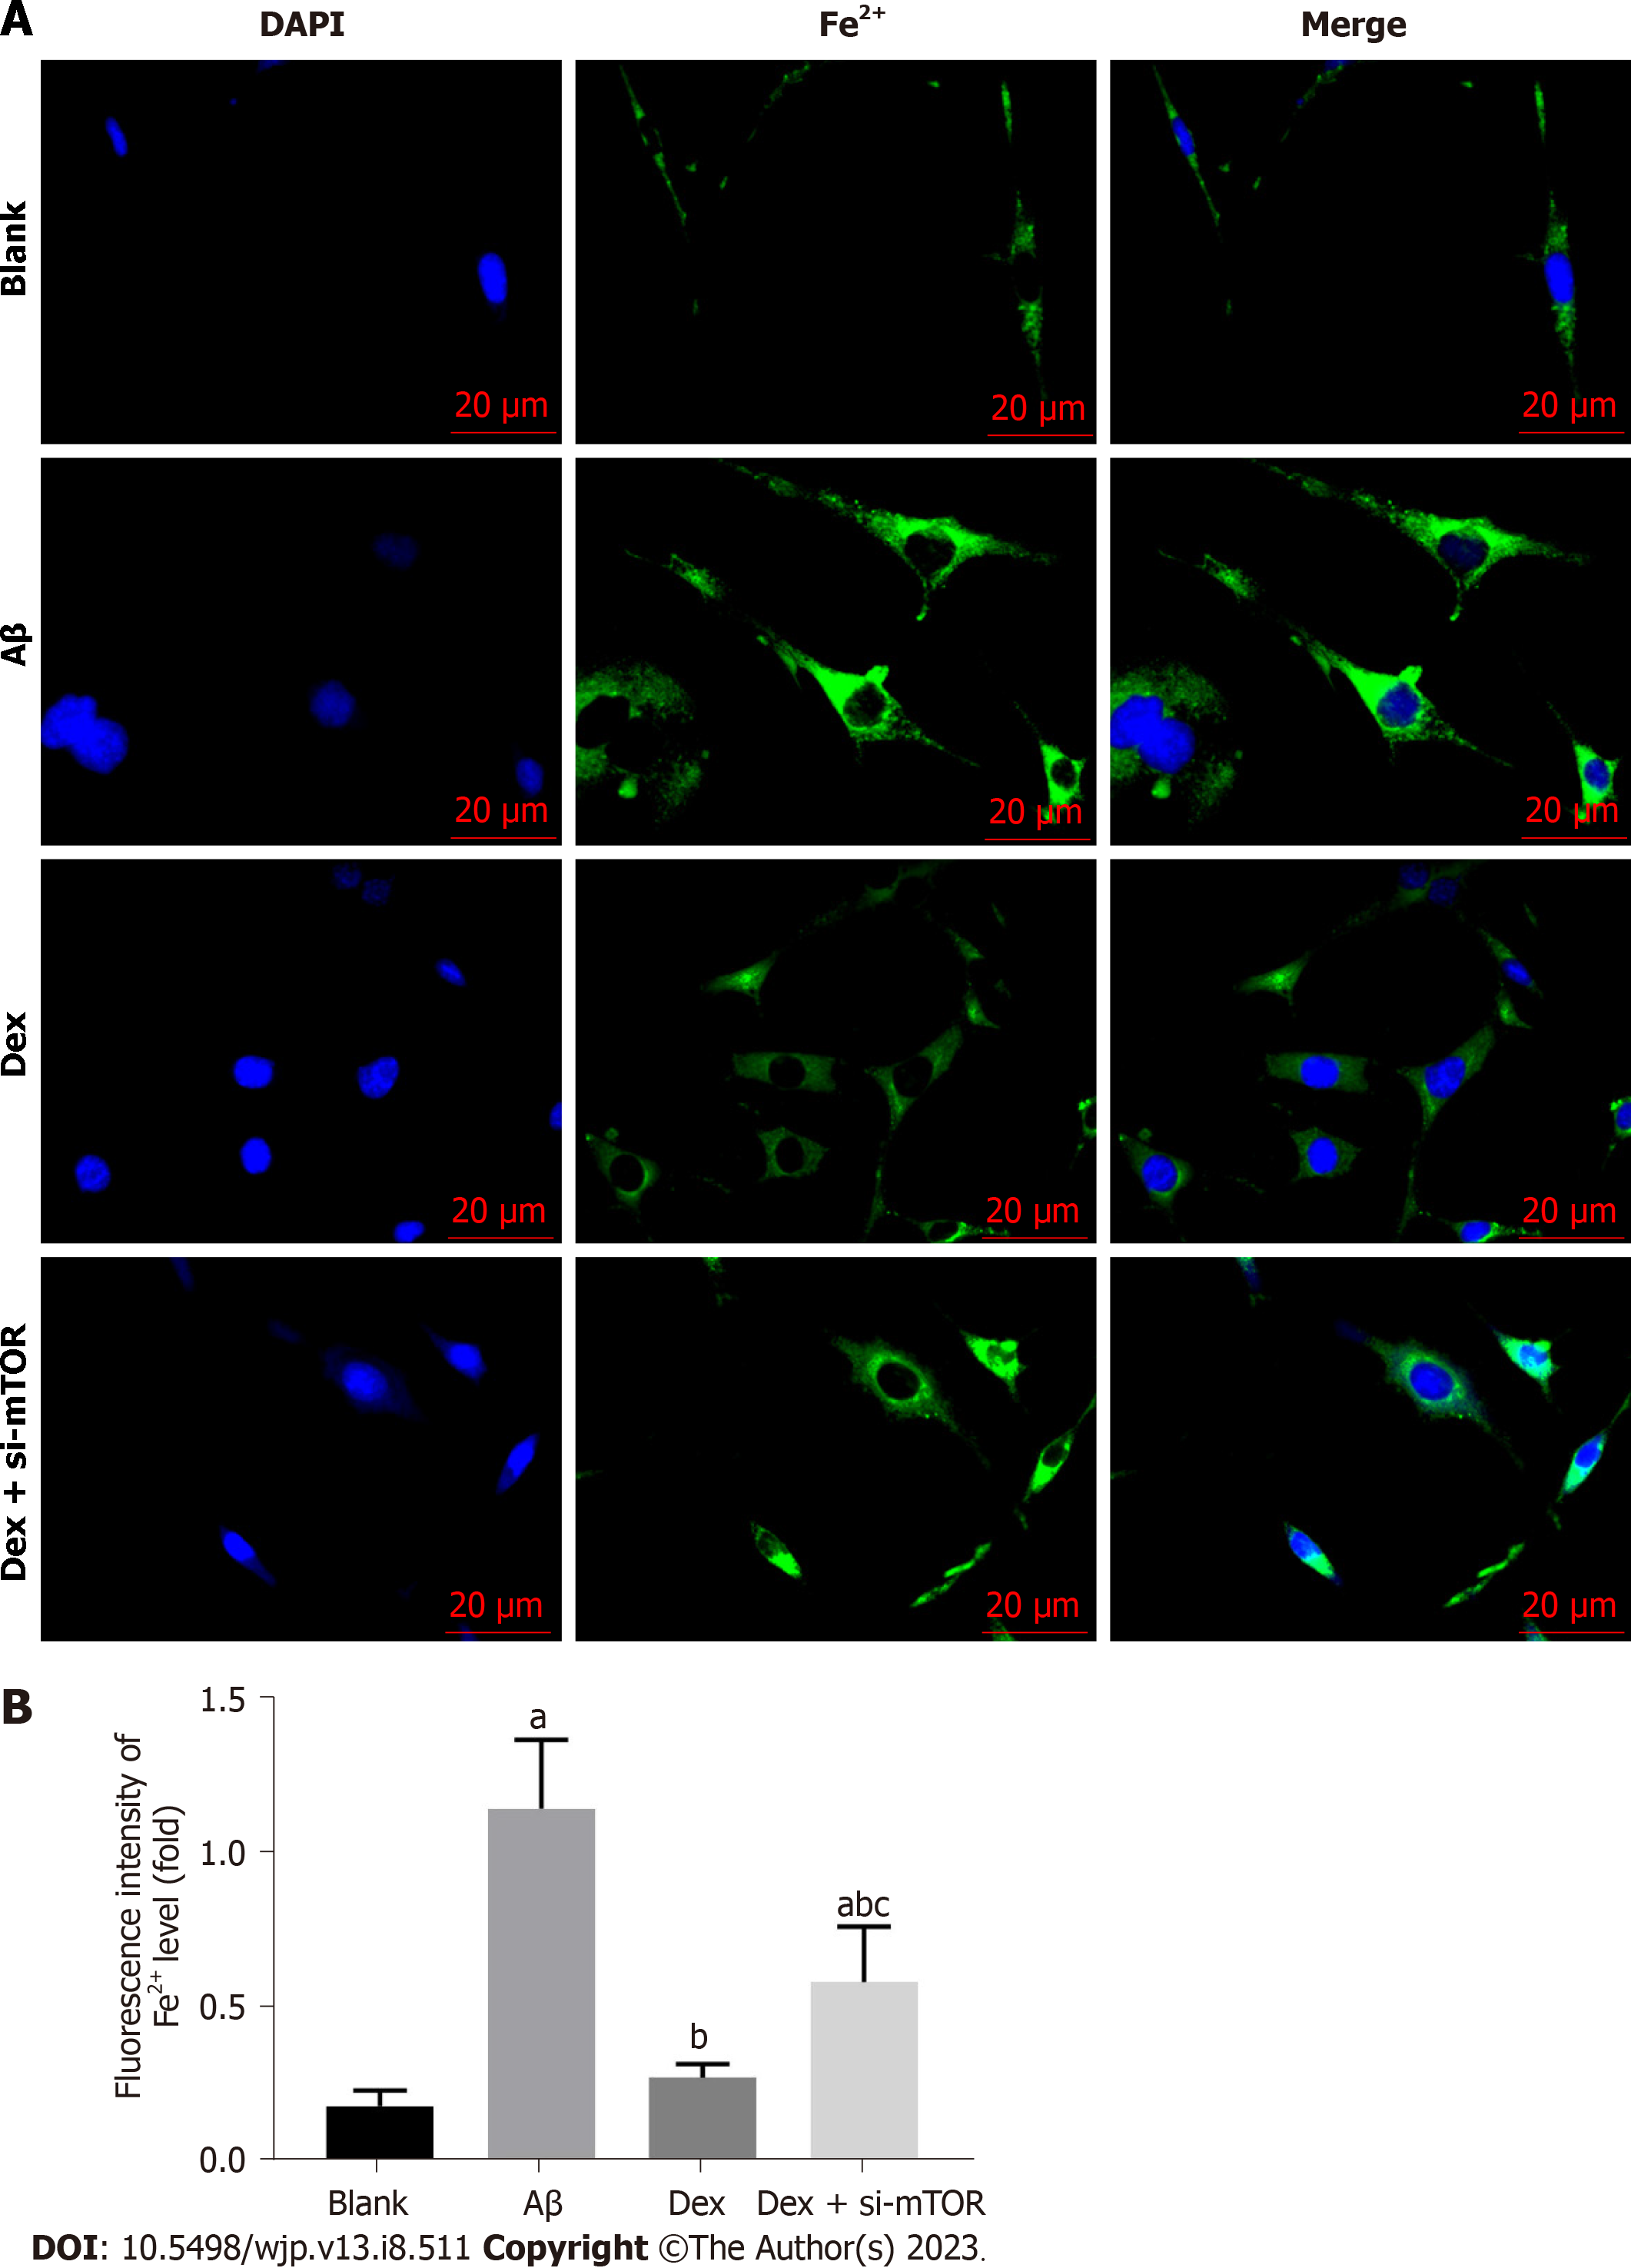
Figure 2 Comparison of the level of Fe2+ in mouse hippocampal neurons in the different treatment groups.
A: Green fluorescence represents intracellular iron levels, and quenching of calcein fluorescence reflects iron uptake by chondrocytes. Scale bar: 20 μm; B: Fluorescence intensity. aP < 0.05, compared with the blank group; bP < 0.05, compared with the amyloid β group; cP < 0.05, compared with the dexmedetomidine group. Aβ: Amyloid β; Dex: Dexmedetomidine; si-mTOR: Mammalian target of rapamycin siRNA; DAPI: 4’,6-diamidino-2-phenylindole.
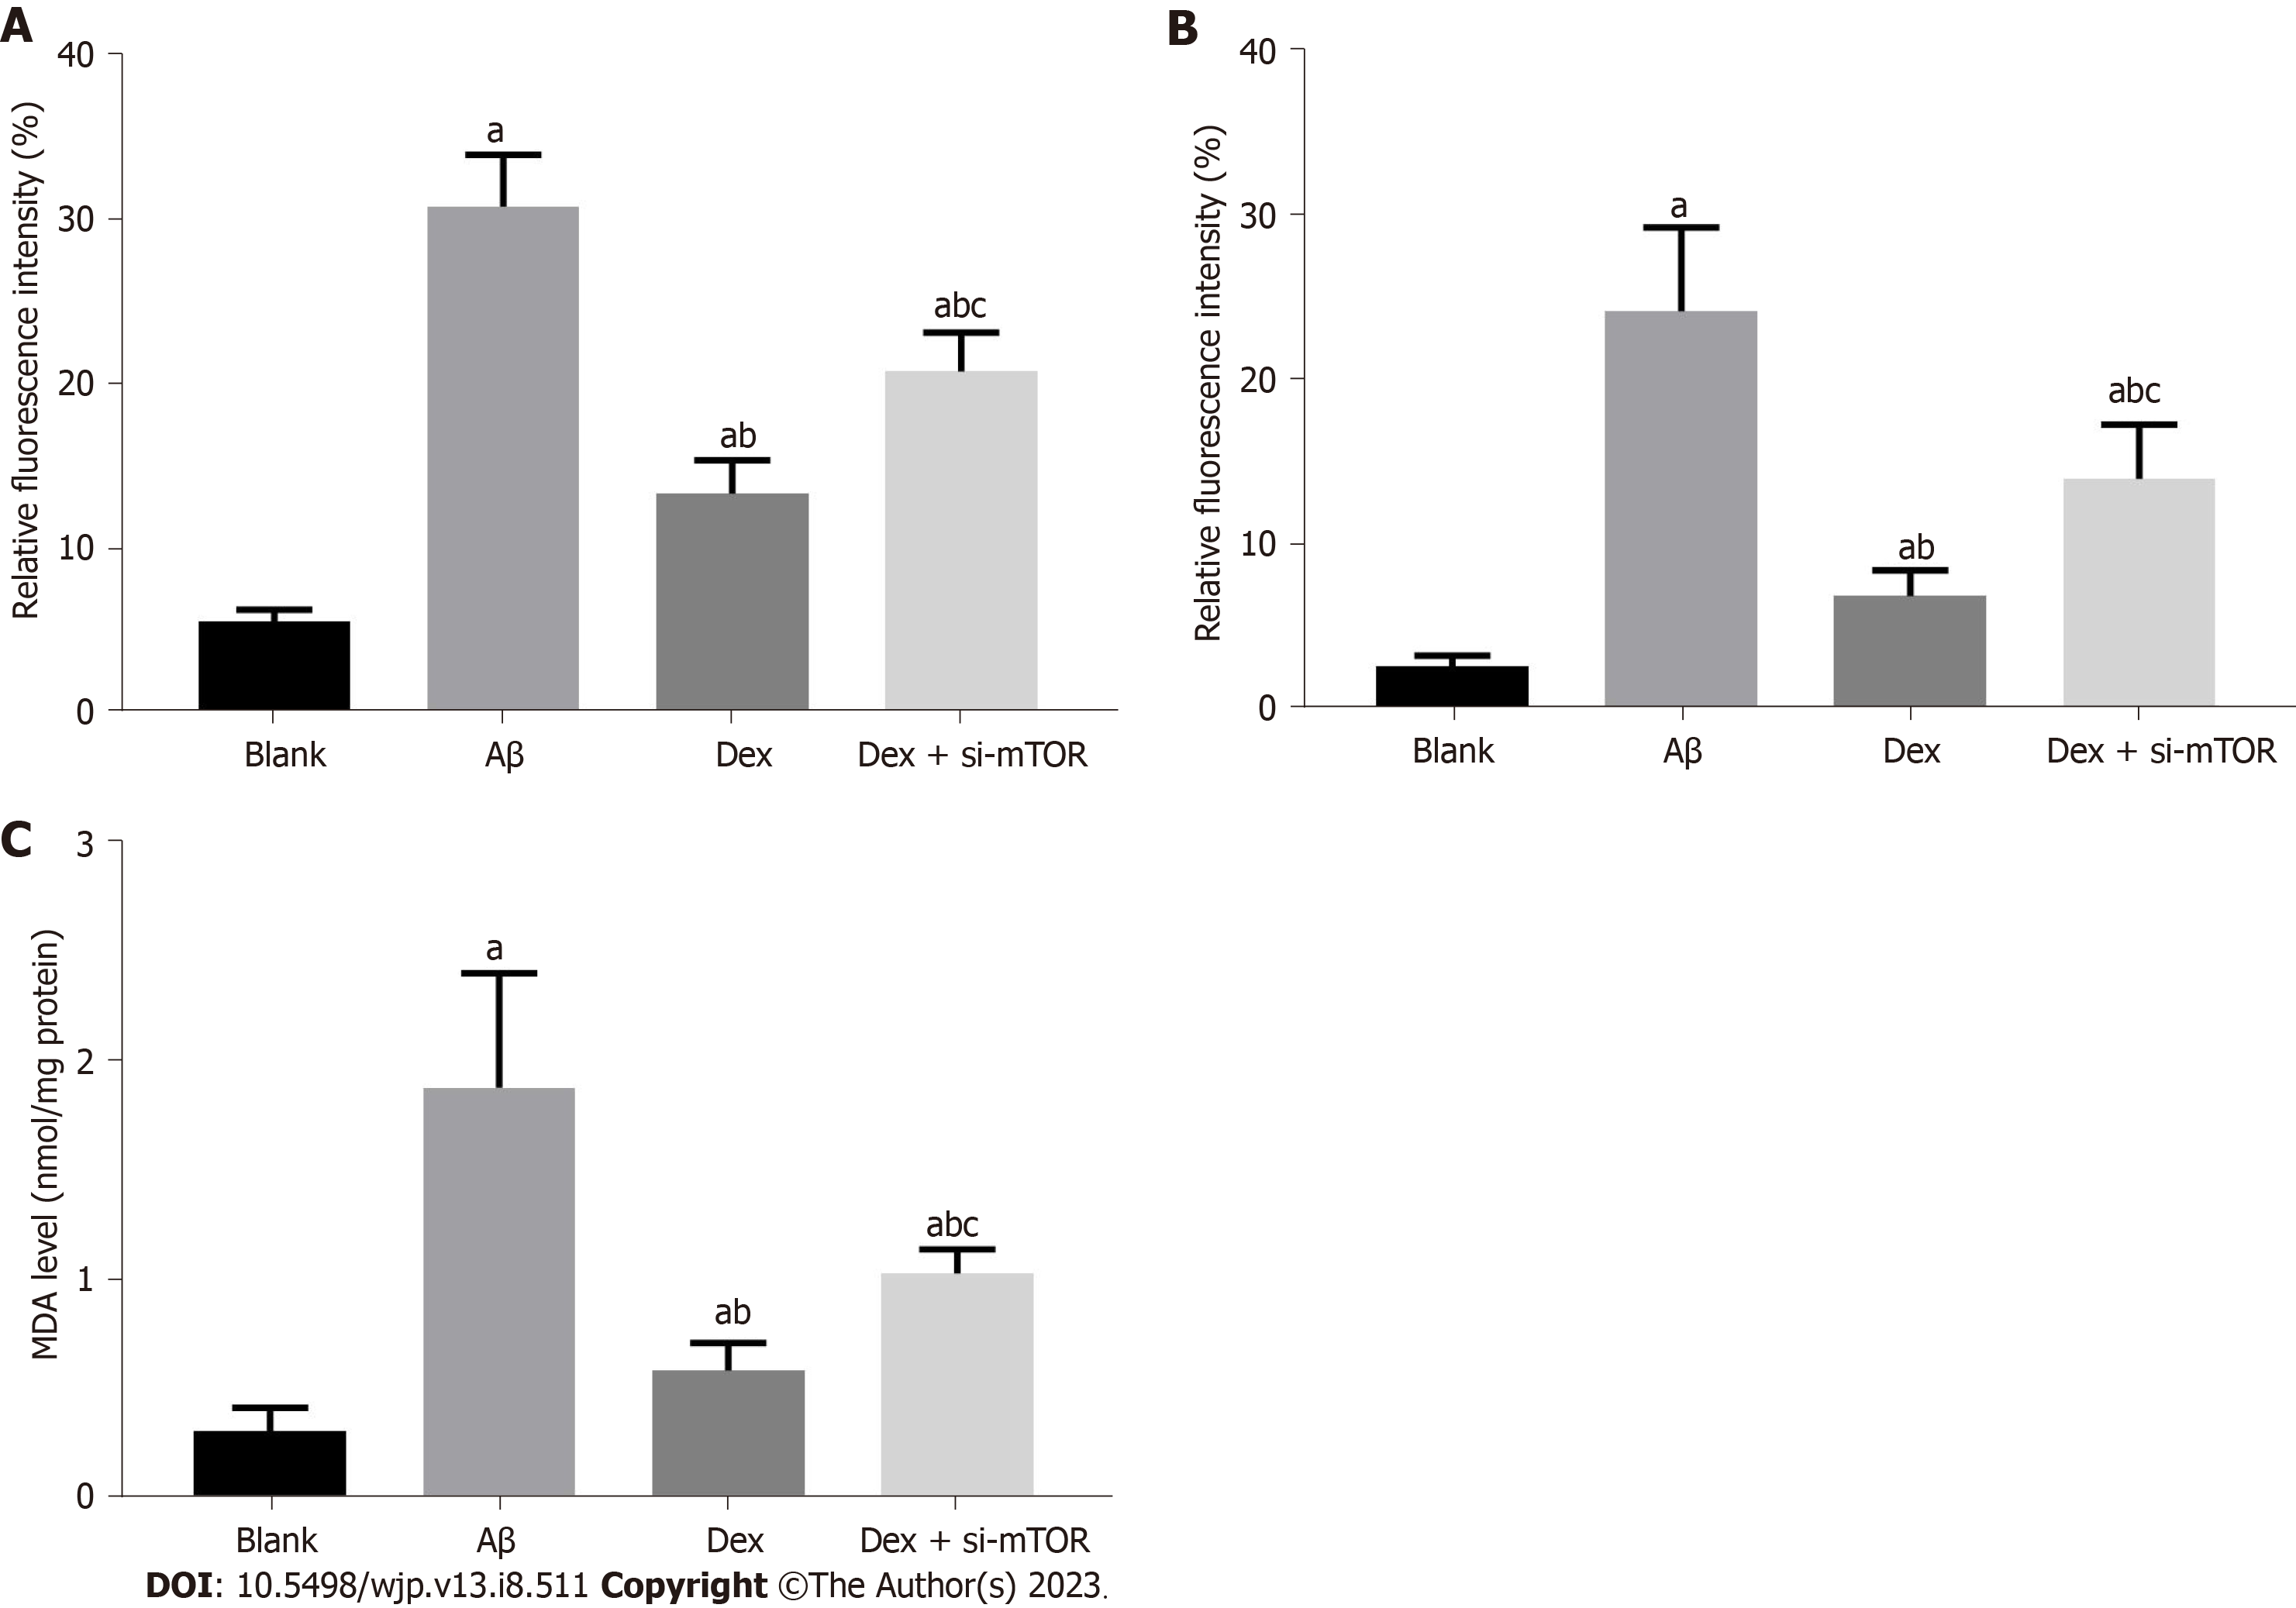
Figure 3 Comparison of oxidative stress index levels in mouse hippocampal neurons in the different treatment groups.
A and B: Hippocampal neurons were stained with DCFH-DA or C11 BODIPY fluorescent probe, reactive oxygen species (A) and lipid peroxidation levels (B) were calculated by measuring fluorescence intensity; C: Absorbance of the oxidation reaction was measured to evaluate the cellular malondialdehyde level using kits. aP < 0.05, compared with the blank group; bP < 0.05, compared with the amyloid β group; cP < 0.05, compared with the dexmedetomidine group. Aβ: Amyloid β; Dex: Dexmedetomidine; si-mTOR: Mammalian target of rapamycin siRNA; MDA: Malondialdehyde.
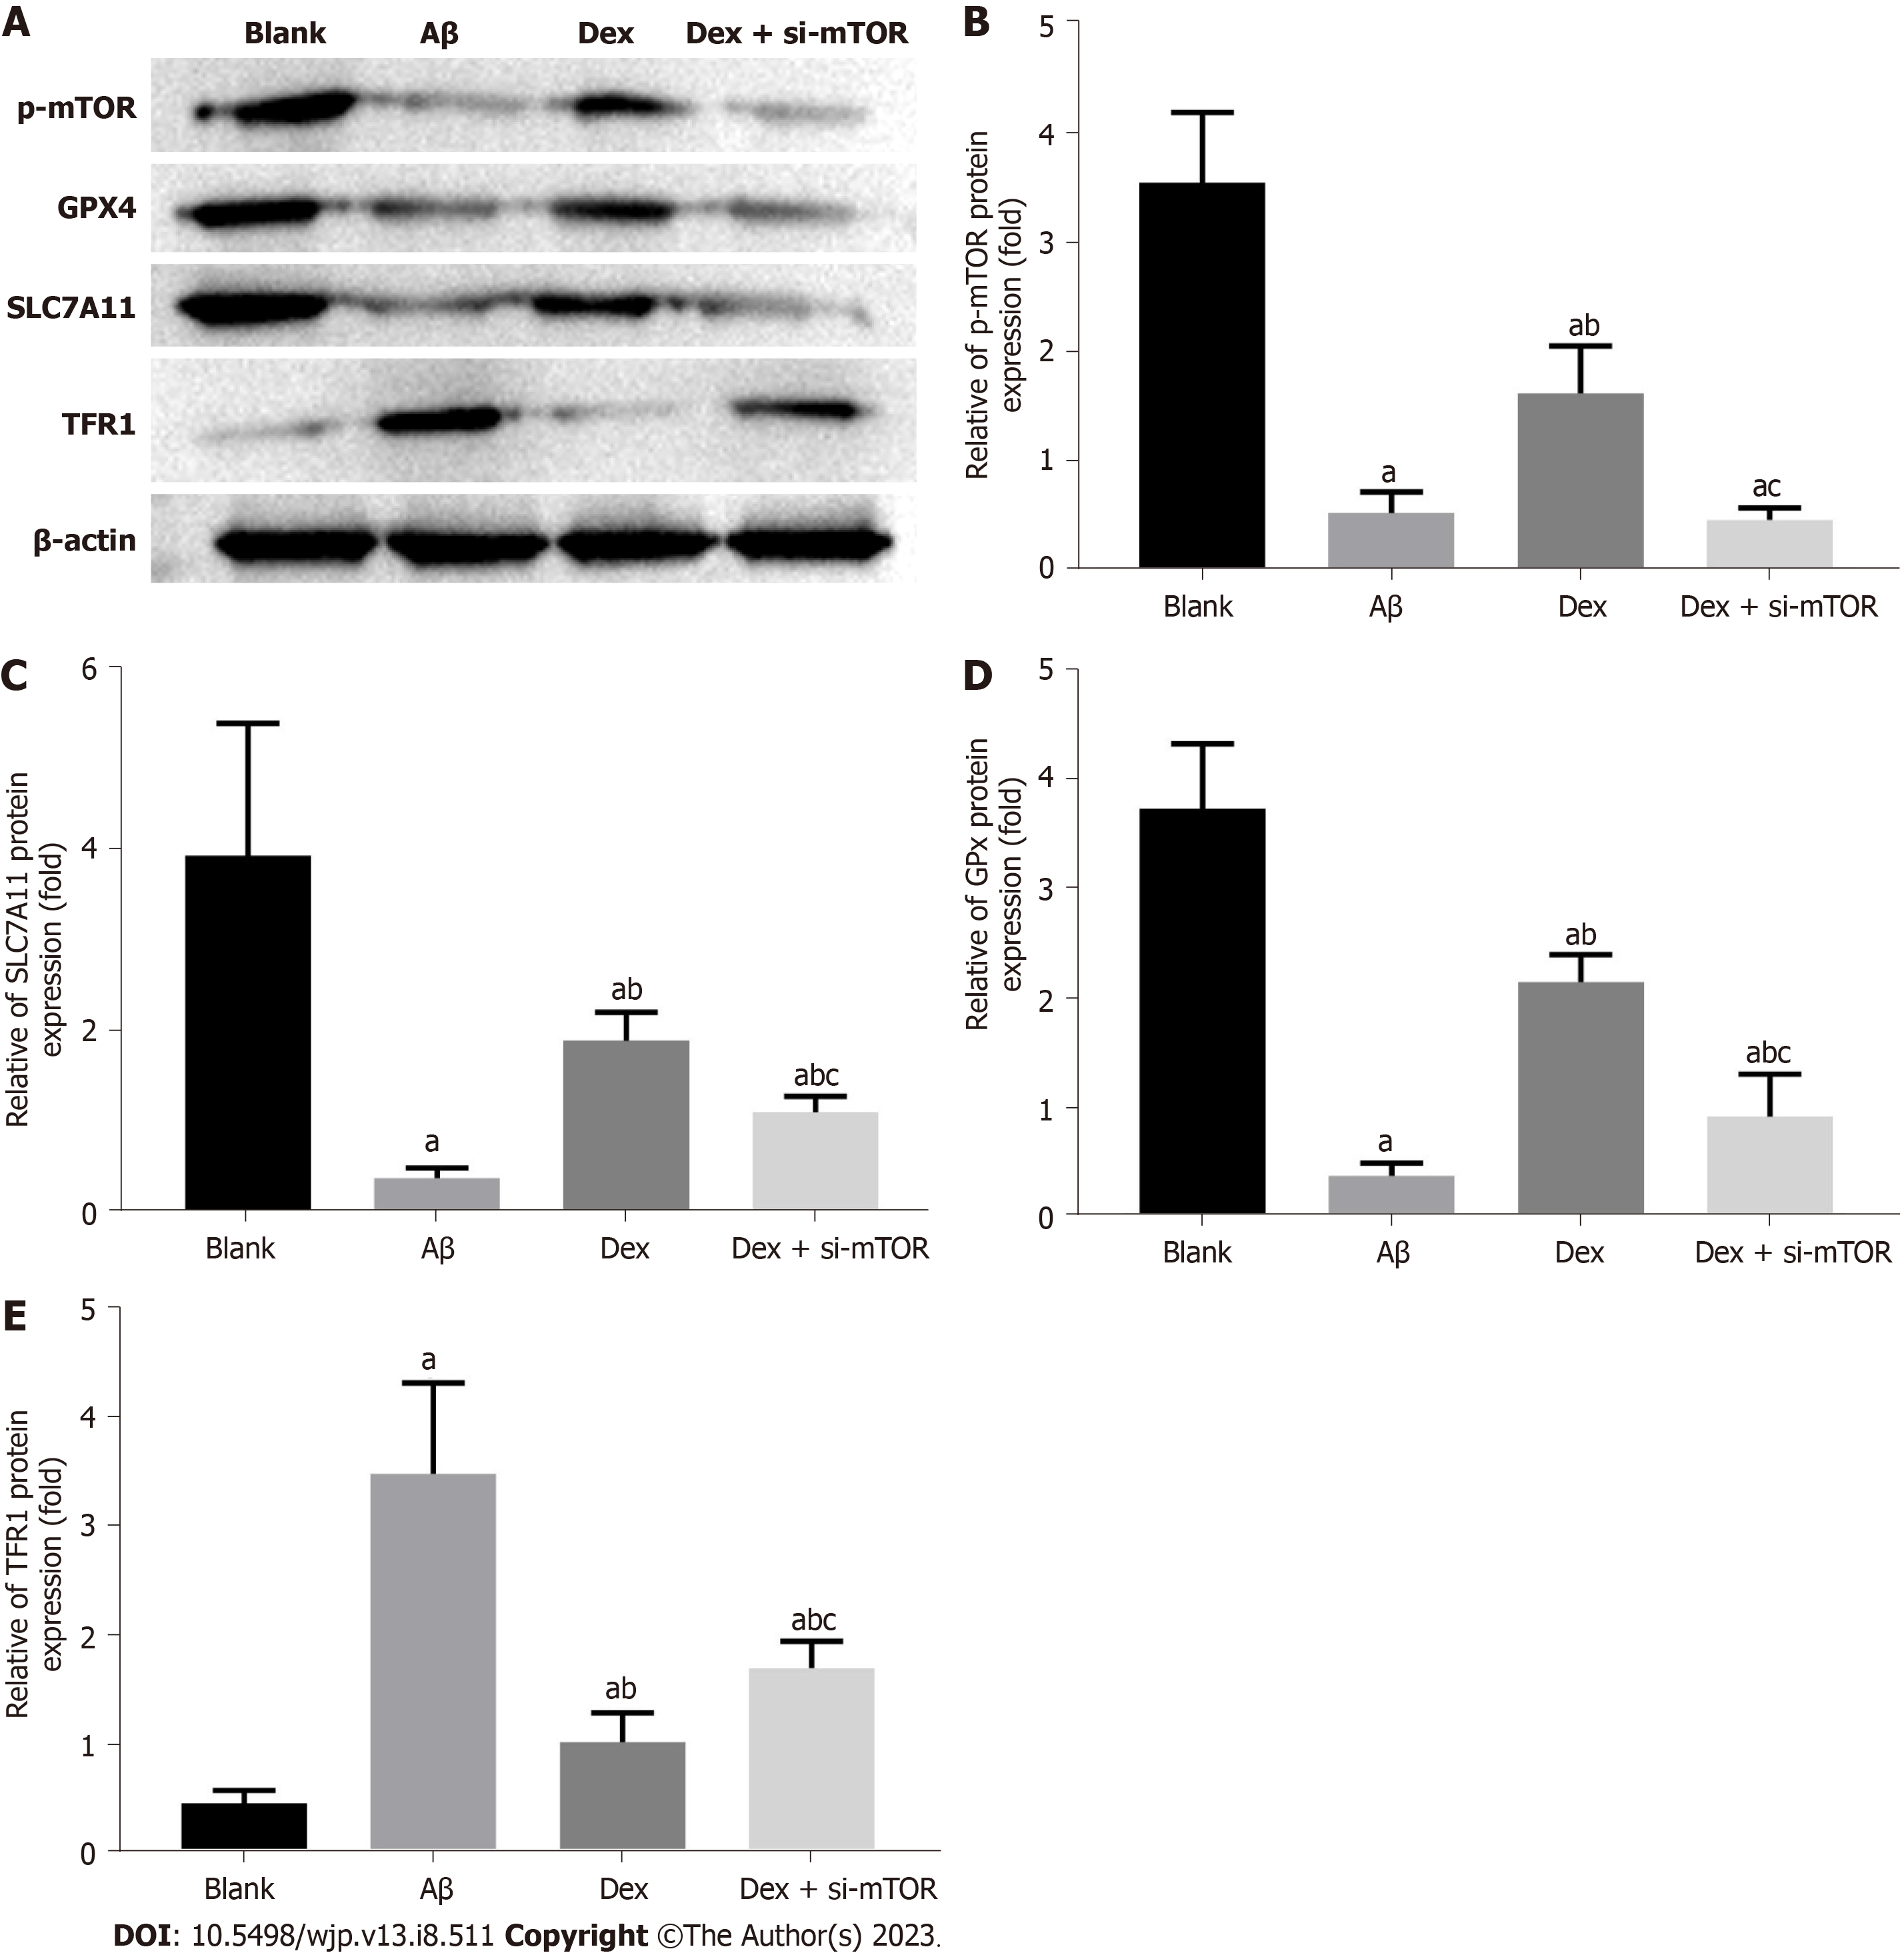
Figure 4 Comparison of iron death-related protein levels in hippocampal neurons of mice in the different treatment groups.
A: Expression levels of p-mammalian target of rapamycin, SLC7A11, glutathione peroxidase 4, and transferrin receptor 1 were detected by western blot; B-E: The relevant data. aP < 0.05, compared with the blank group; bP < 0.05, compared with the amyloid β group; cP < 0.05, compared with the dexmedetomidine group. Aβ: Amyloid β; Dex: Dexmedetomidine; si-mTOR: Mammalian target of rapamycin siRNA; GPX4: Glutathione peroxidase 4; TFR1: Transferrin receptor 1.
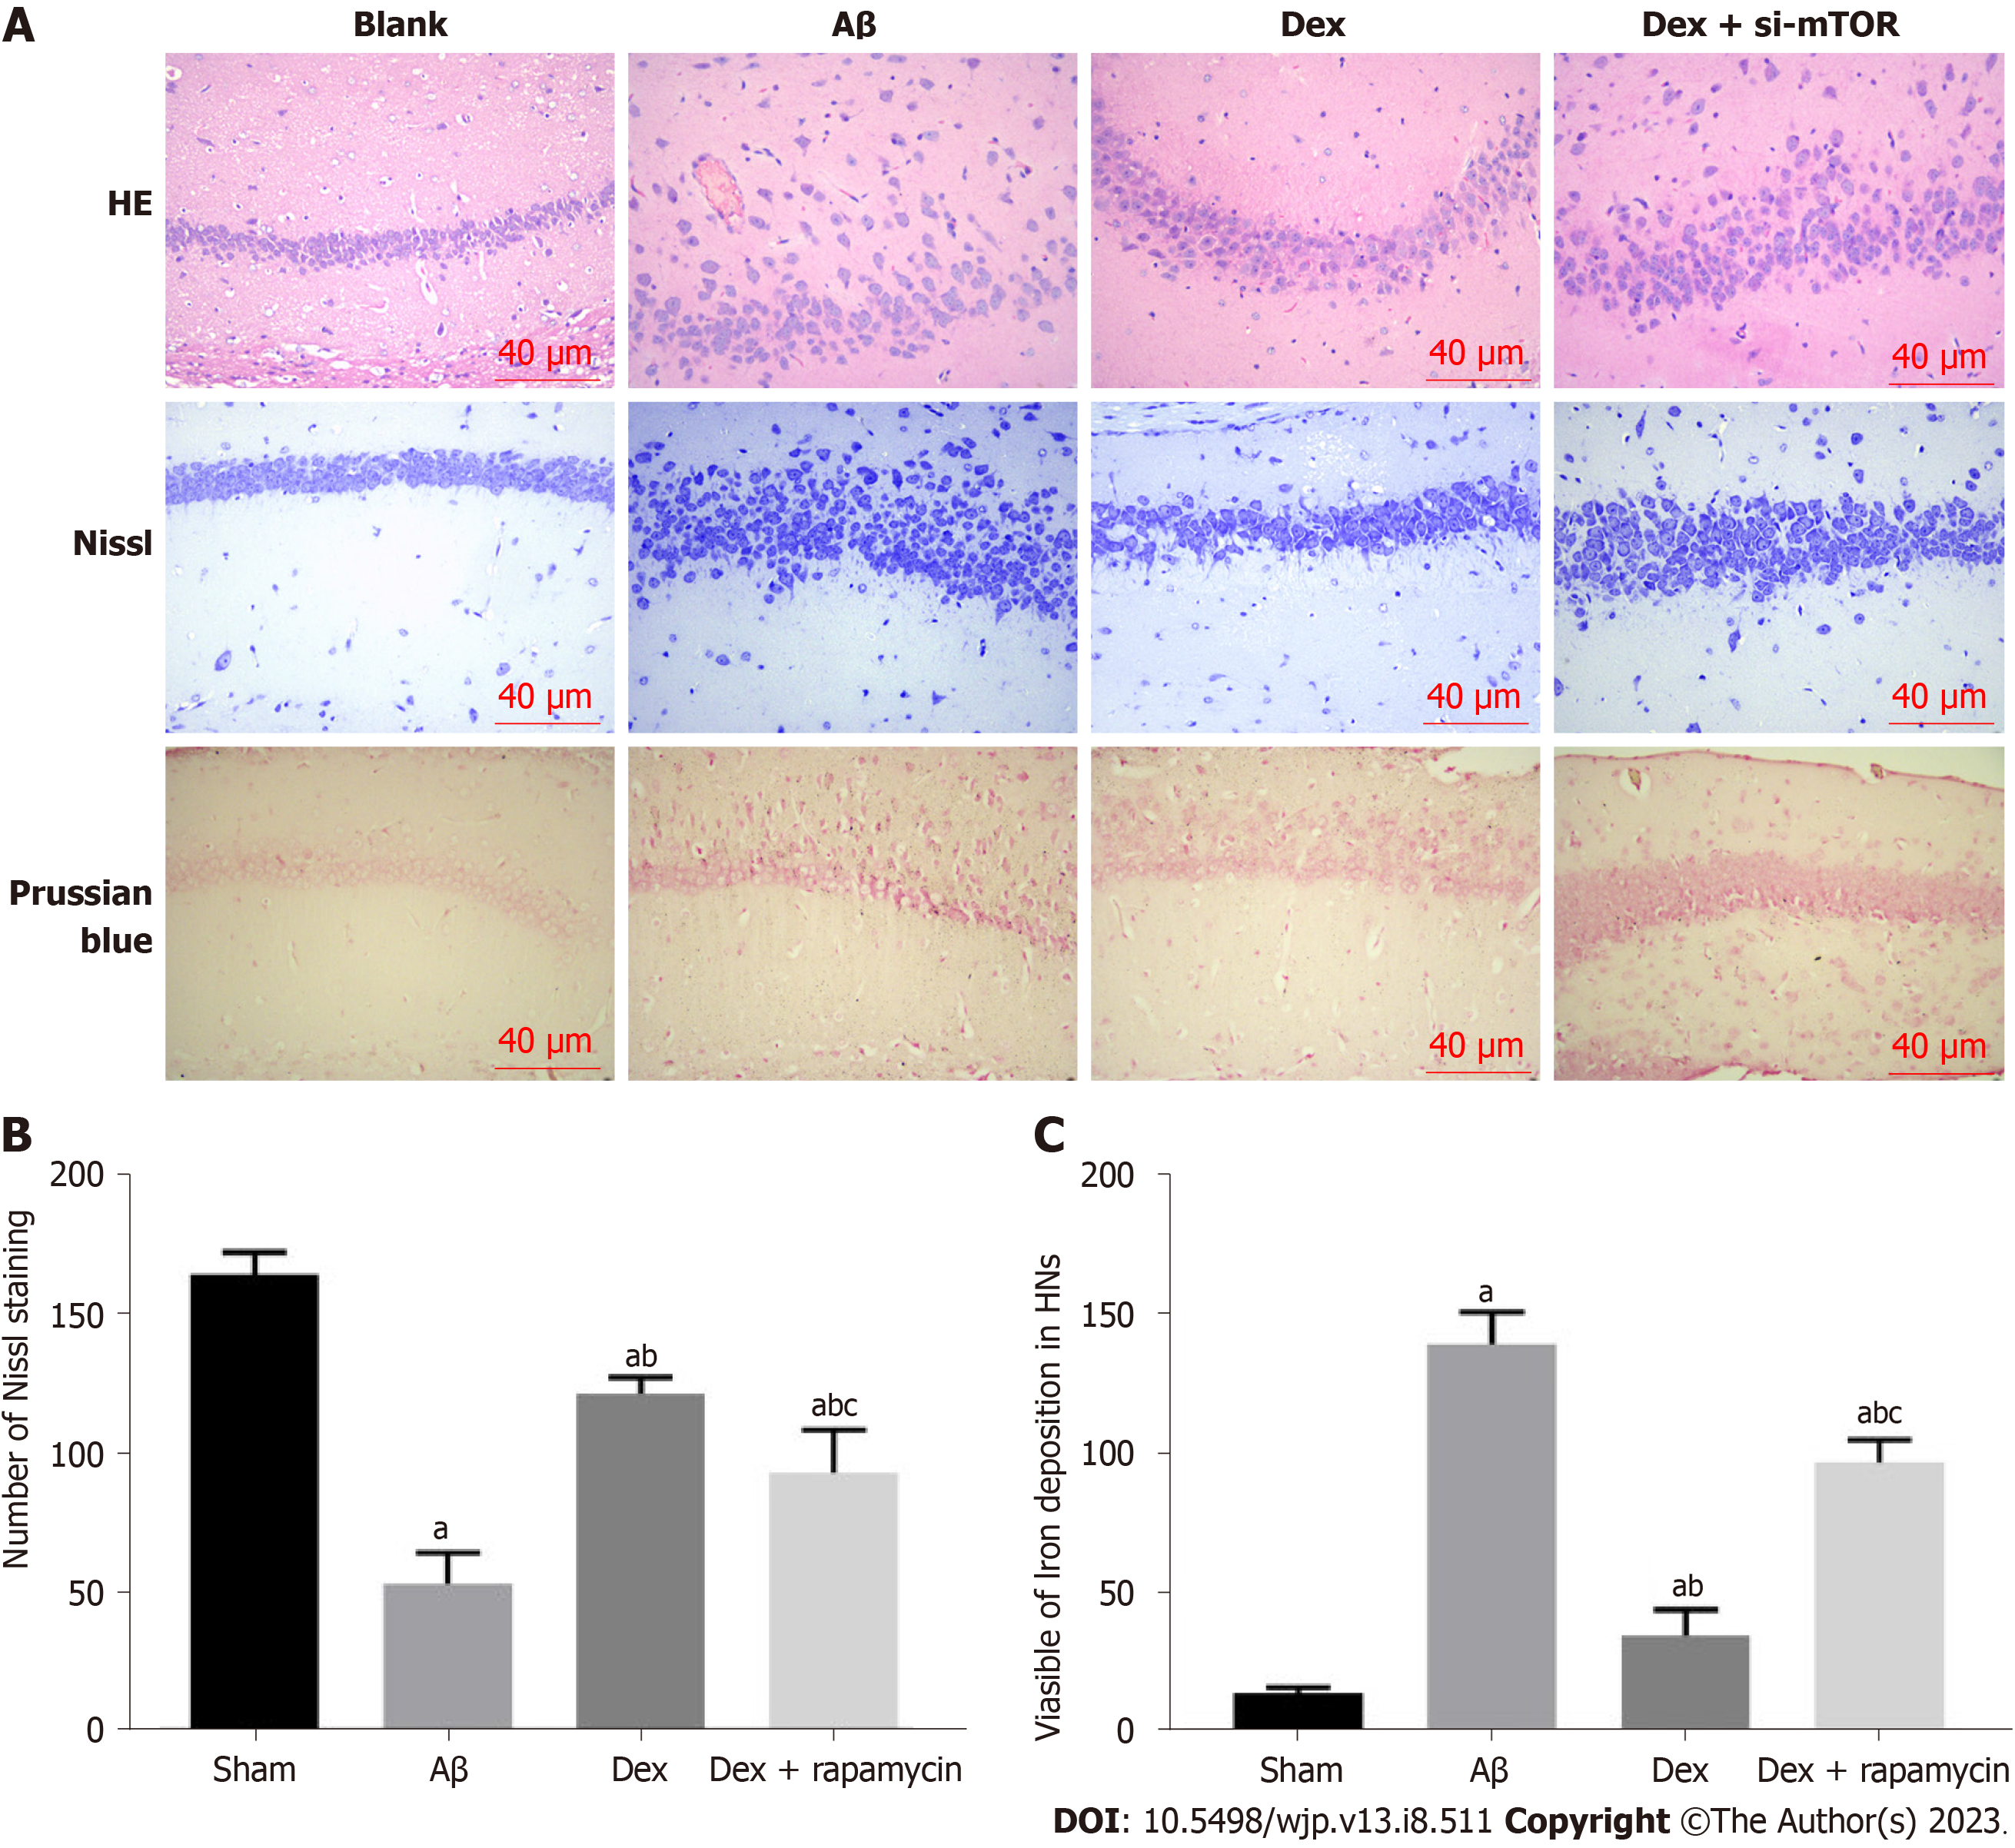
Figure 5 Comparison of pathological changes, nerve cell injury and iron deposition in mouse brain tissue in the different treatment groups.
A: Hematoxylin and eosin, Nissl, and Prussian blue staining for pathological changes, neuronal damage, and iron deposition in the brain tissue of mice in each group. Scale bar, 40 μm; B: Representative photomicrographs of Nissl staining of surviving neurons in the hippocampal region, and statistical analysis of Nissl bodies in each group; C: Representative photomicrographs of Prussian blue staining of surviving neurons in the hippocampal region, and statistical analysis of iron deposition in each group. aP < 0.05, compared with the sham group; bP < 0.05, compared with the amyloid β group; cP < 0.05, compared with the dexmedetomidine group. Aβ: Amyloid β; Dex: Dexmedetomidine; si-mTOR: Mammalian target of rapamycin siRNA; HE: Hematoxylin and eosin; HNs: Hippocampal neurons.
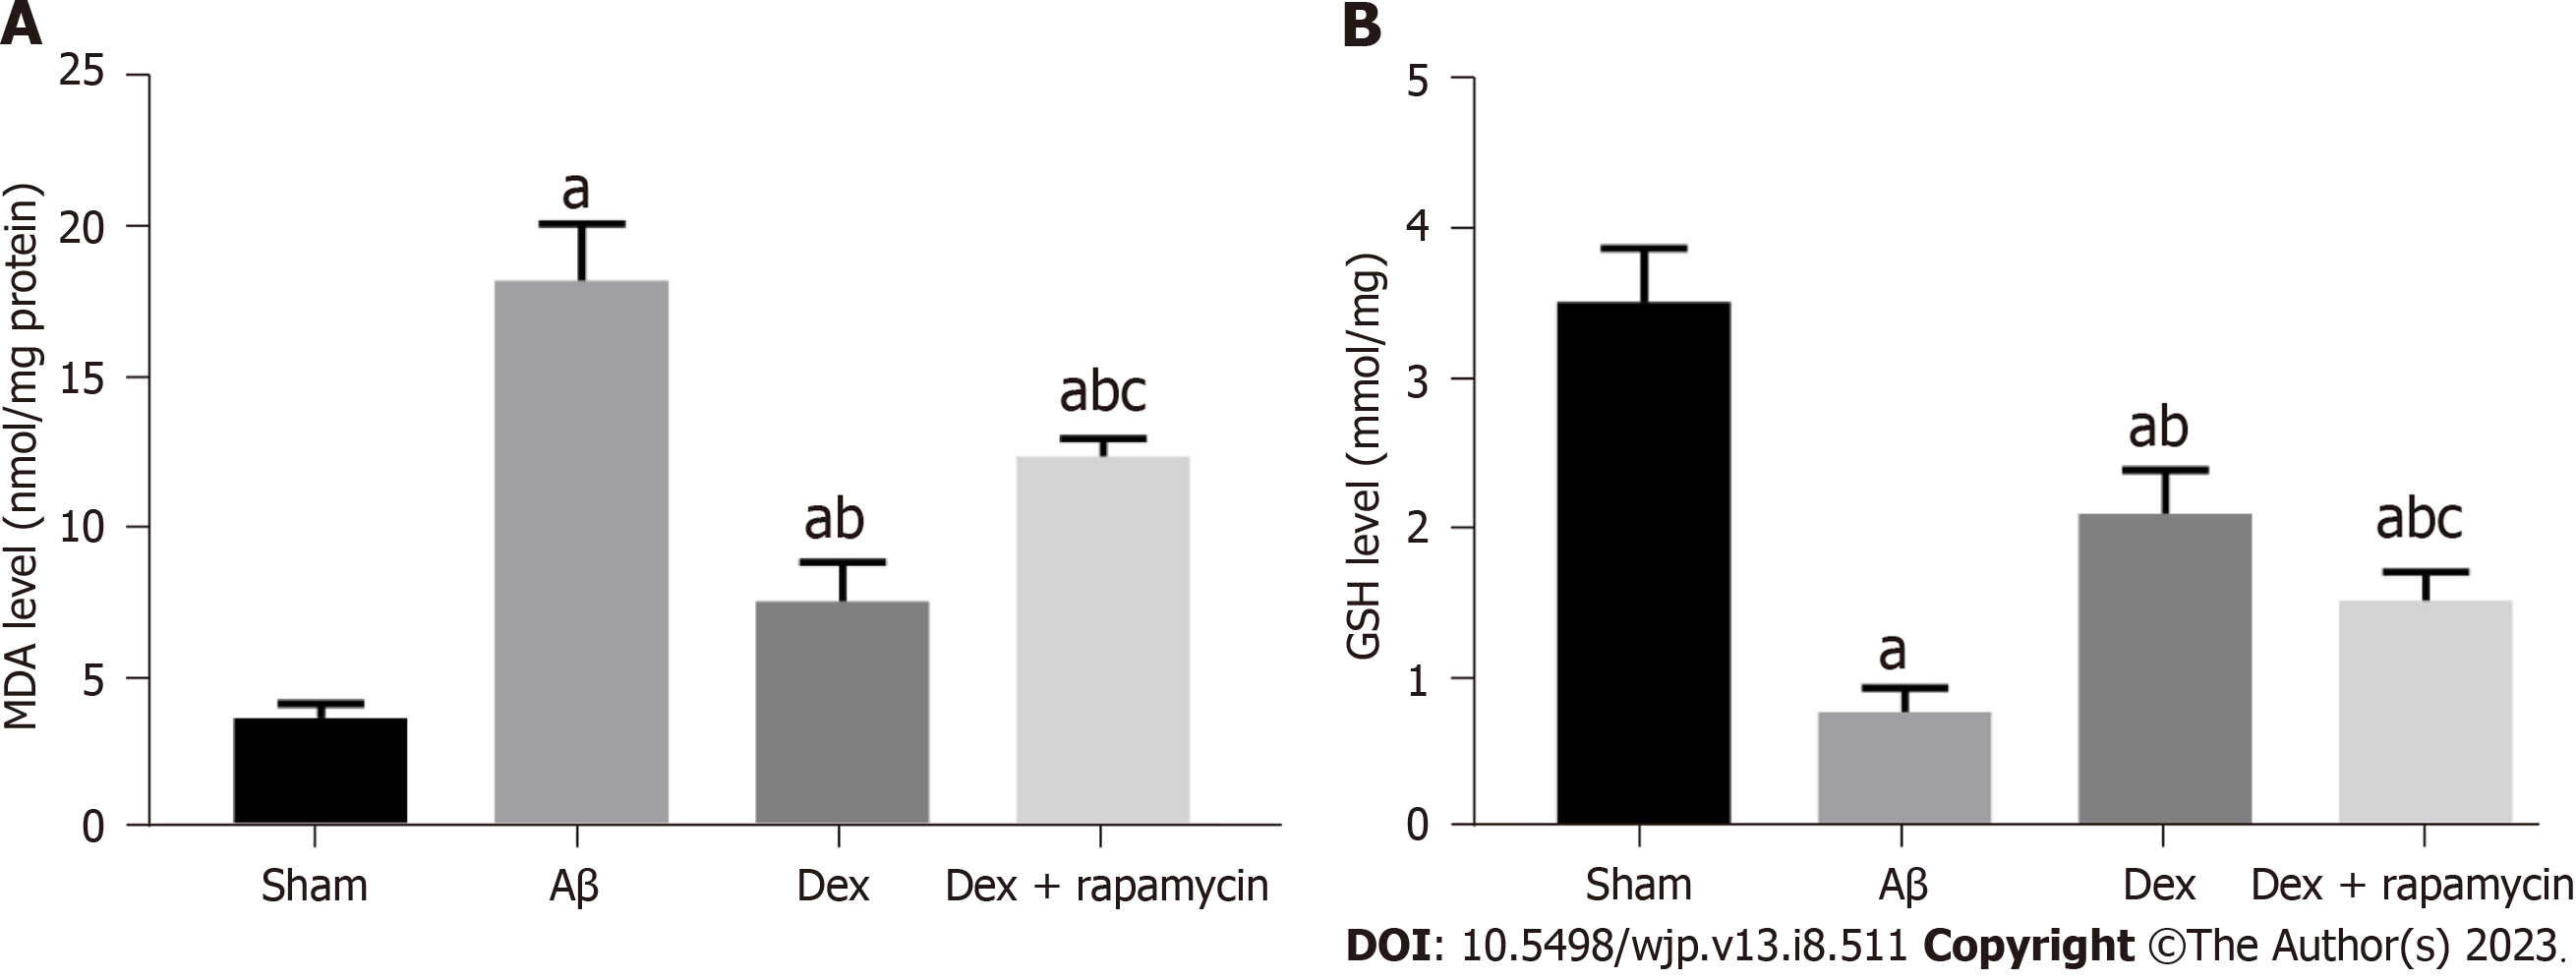
Figure 6 Comparison of oxidative stress index levels in mouse brain tissue in the different treatment groups.
A: Absorbance of the oxidation reaction was measured to evaluate the cellular malondialdehyde level using kits; B: The activity levels of glutathione enzyme activity was measured using kits according to a colorimetric method. aP < 0.05, compared with the sham group; bP < 0.05, compared with the amyloid β group; cP < 0.05, compared with the dexmedetomidine group. Aβ: Amyloid β; Dex: Dexmedetomidine; MDA: Malondialdehyde; GSH: Glutathione.
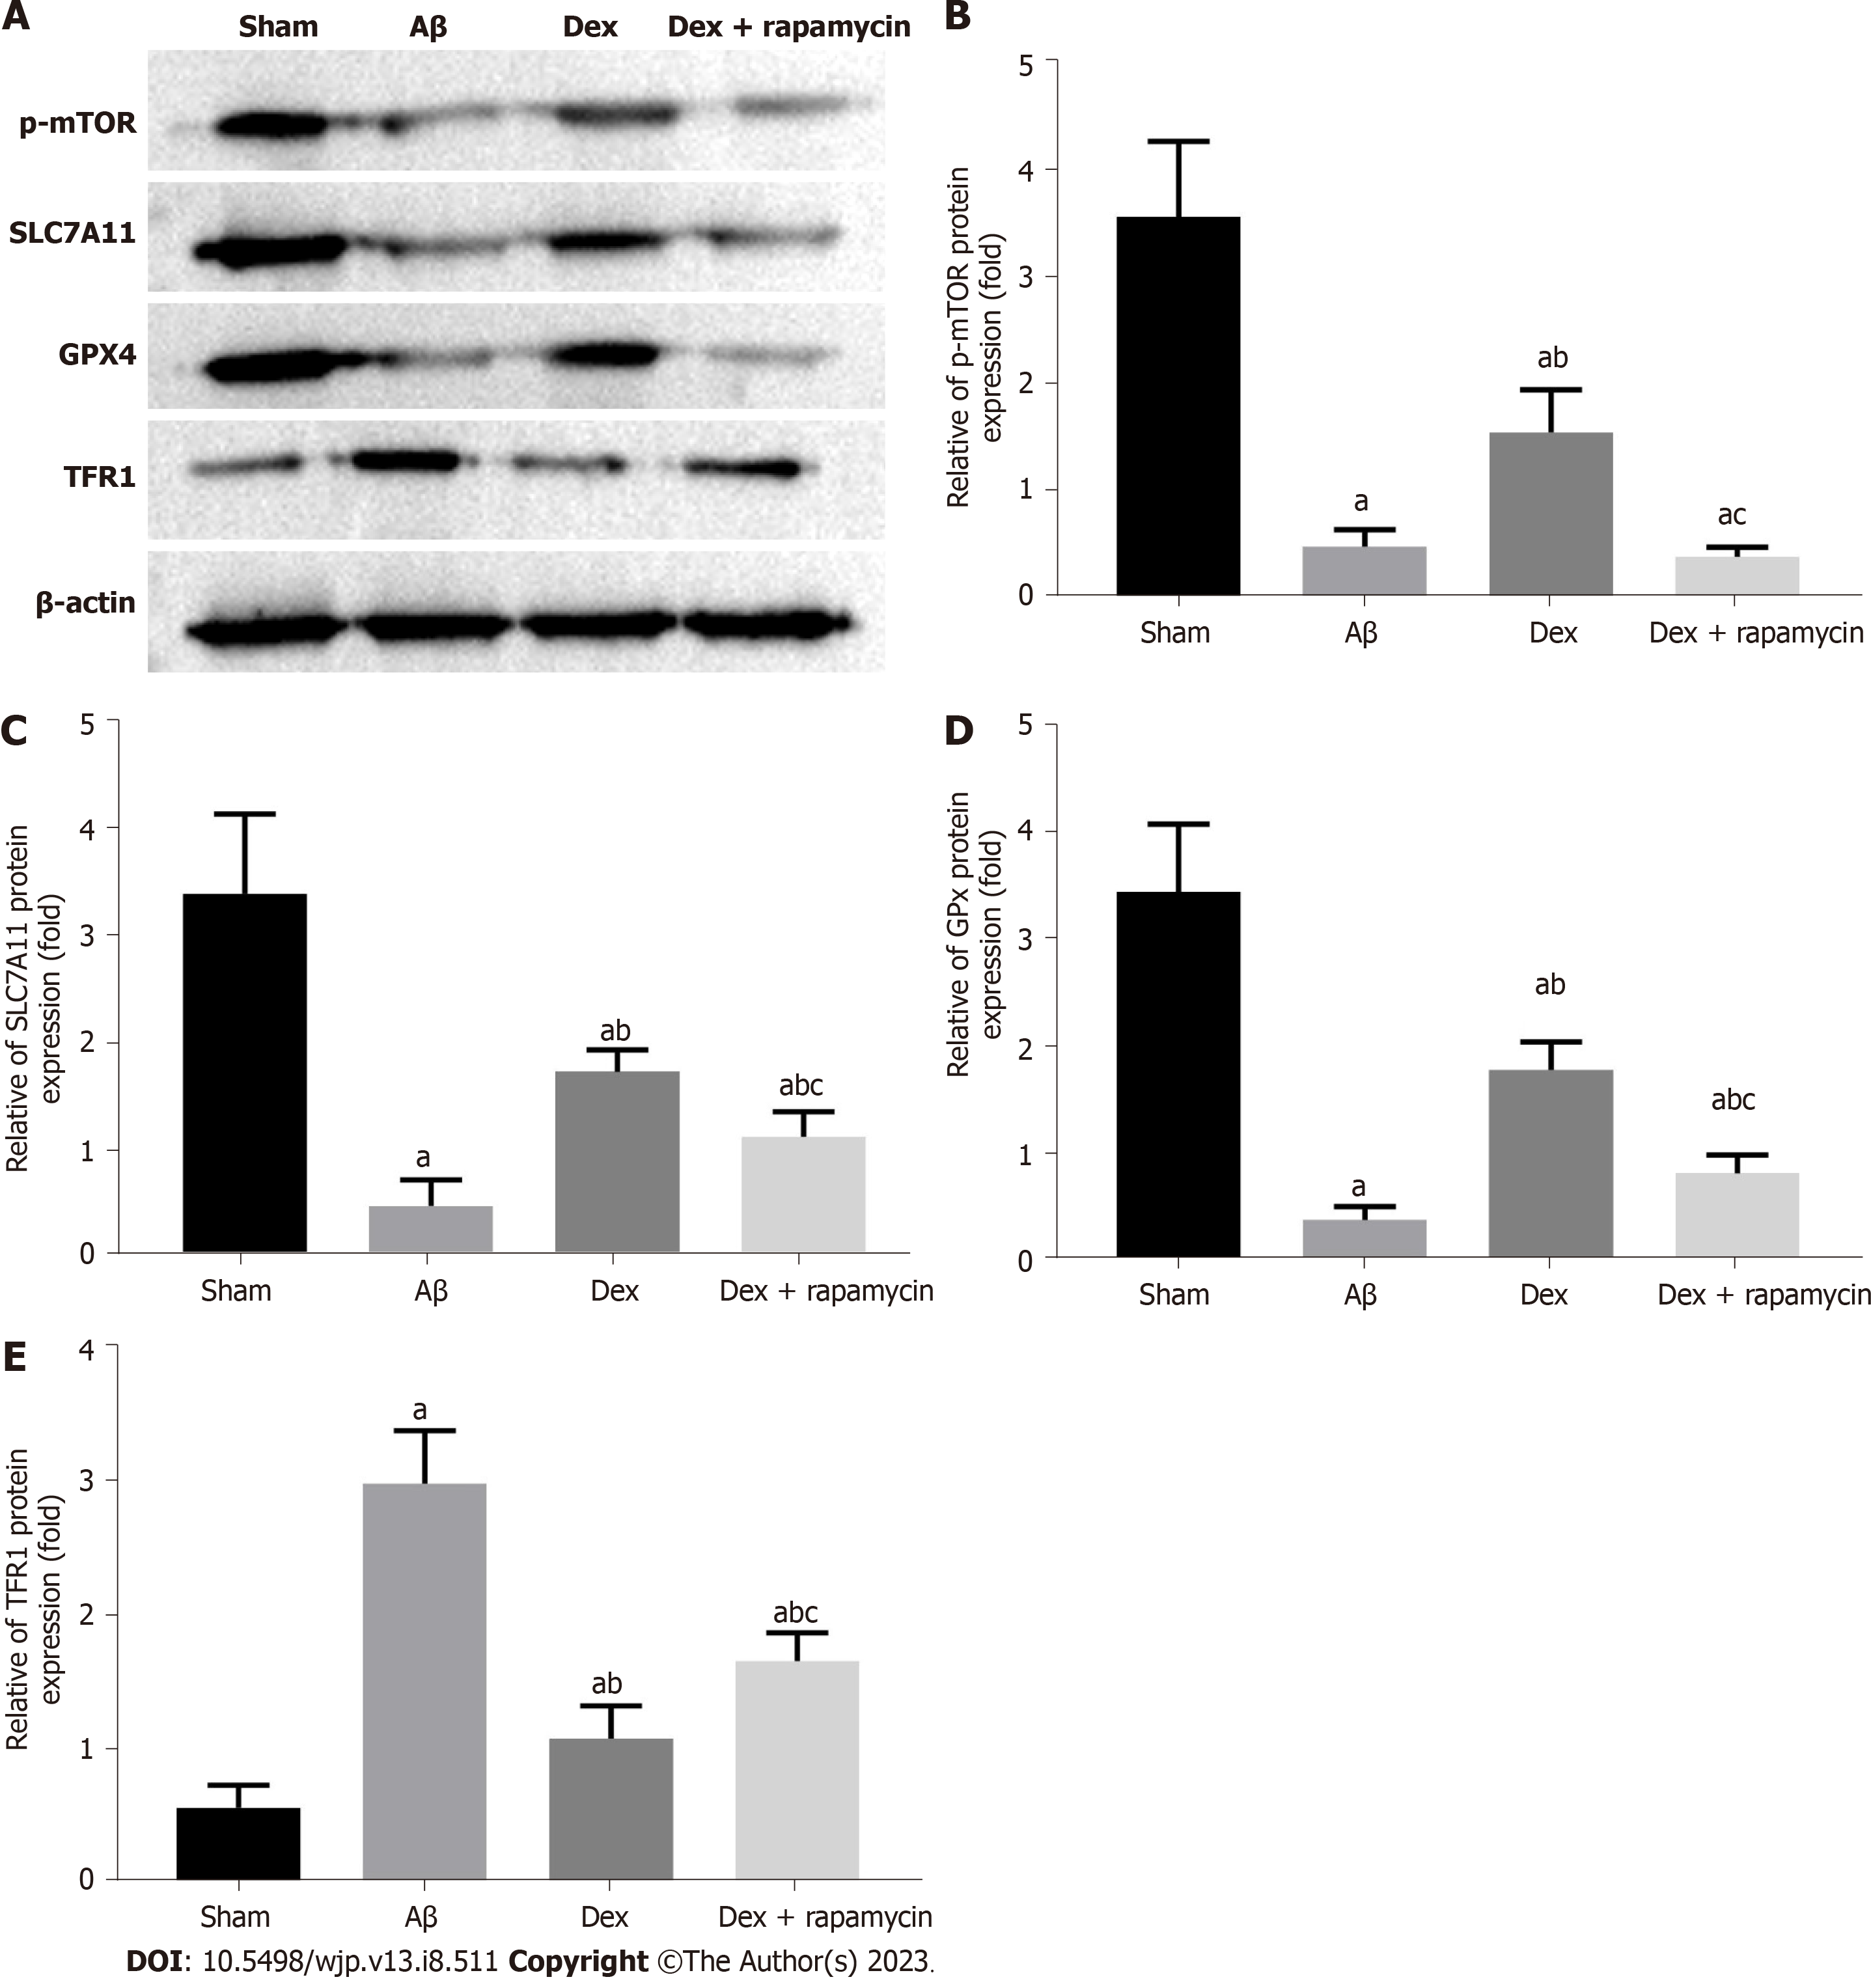
Figure 7 Comparison of iron death-related protein levels in mouse brain tissue in the different treatment groups.
A: Expression levels of p-mammalian target of rapamycin, SLC7A11, glutathione peroxidase 4, and transferrin receptor 1 in mouse brain tissue were detected by western blot; B-E: The relevant data. aP < 0.05, compared with the sham group; bP < 0.05, compared with the amyloid β group; cP < 0.05, compared with the dexmedetomidine group. Aβ: Amyloid β; Dex: Dexmedetomidine; mTOR: Mammalian target of rapamycin; GPX4: Glutathione peroxidase 4; TFR1: Transferrin receptor 1.
- Citation: Qiao L, Li G, Yuan HX. Dexmedetomidine mediates the mechanism of action of ferroptosis in mice with Alzheimer’s disease by regulating the mTOR-TFR1 pathway. World J Psychiatry 2023; 13(8): 511-523
- URL: https://www.wjgnet.com/2220-3206/full/v13/i8/511.htm
- DOI: https://dx.doi.org/10.5498/wjp.v13.i8.511


