Copyright
©The Author(s) 2023.
World J Psychiatry. Nov 19, 2023; 13(11): 838-847
Published online Nov 19, 2023. doi: 10.5498/wjp.v13.i11.838
Published online Nov 19, 2023. doi: 10.5498/wjp.v13.i11.838
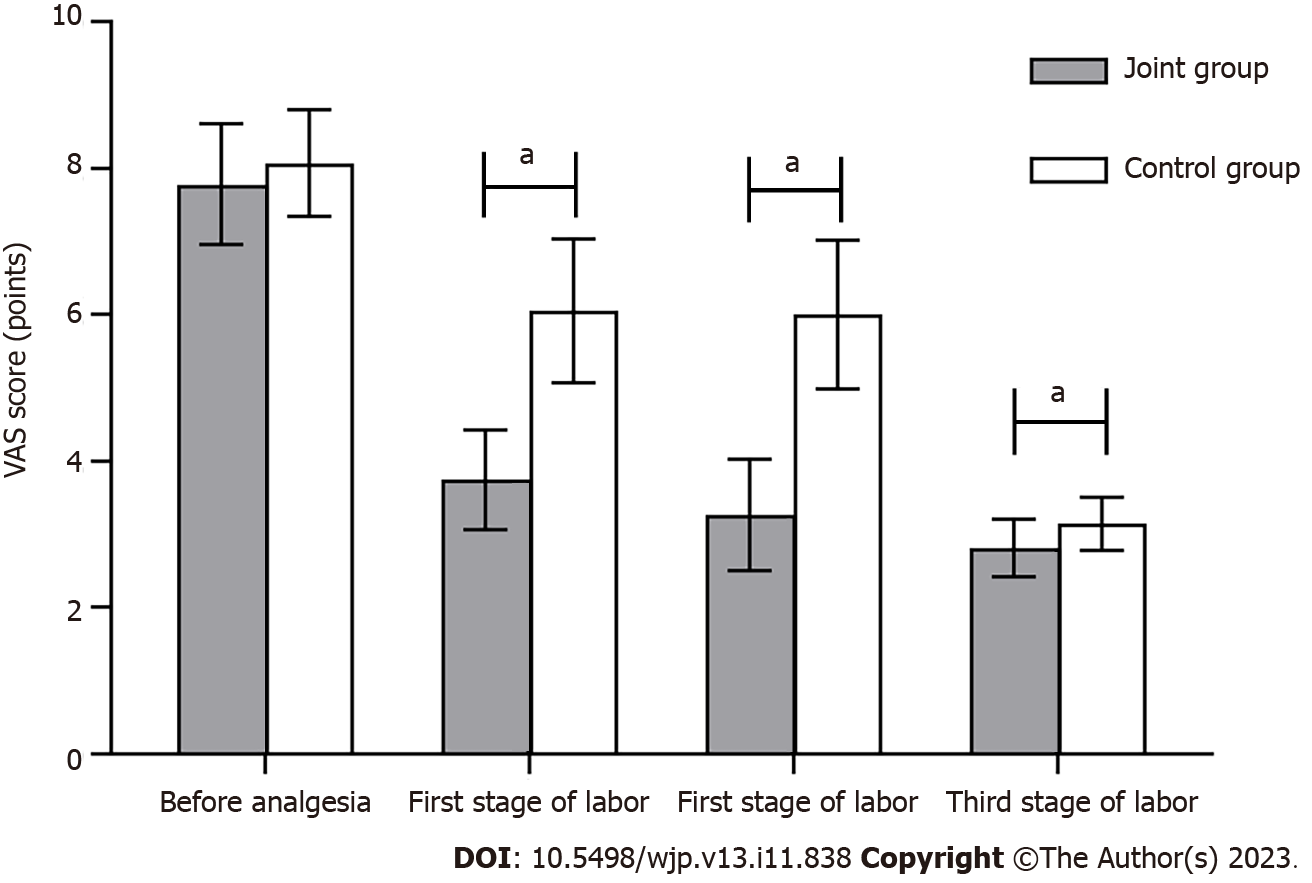
Figure 1 Comparison of visual analog scale scores between the two groups (scores).
aP < 0.05, comparison with the joint group in the same period. VAS: Visual analog scale.
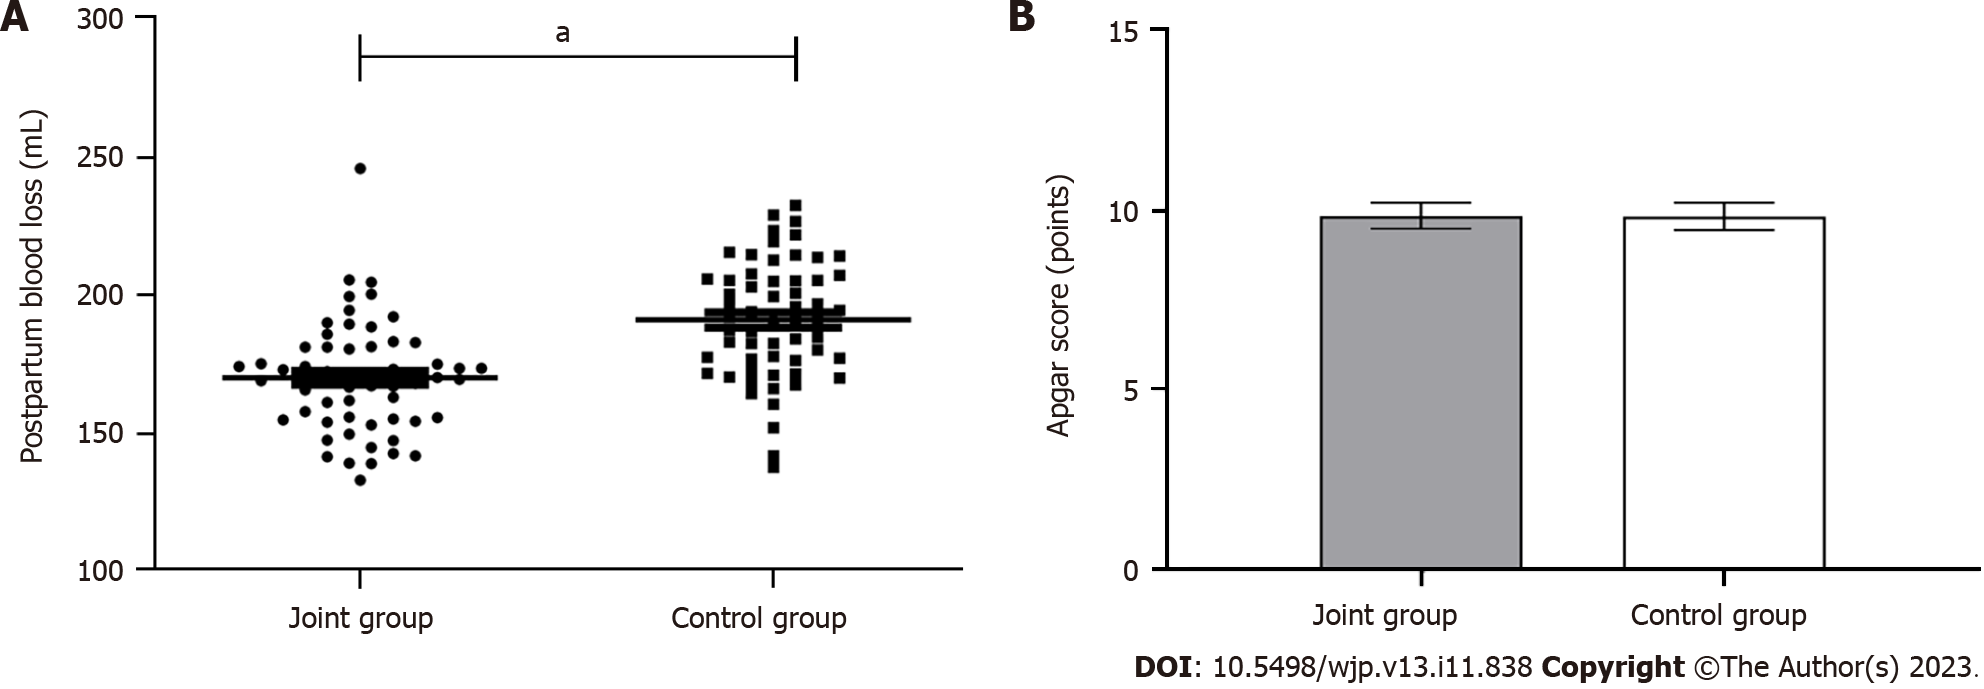
Figure 2 Comparison of childbirth-related conditions between the two groups.
A: Comparison of postpartum blood loss between the two groups; B: Comparison of apgar score between the two groups. aP < 0.05, comparison with the joint group.
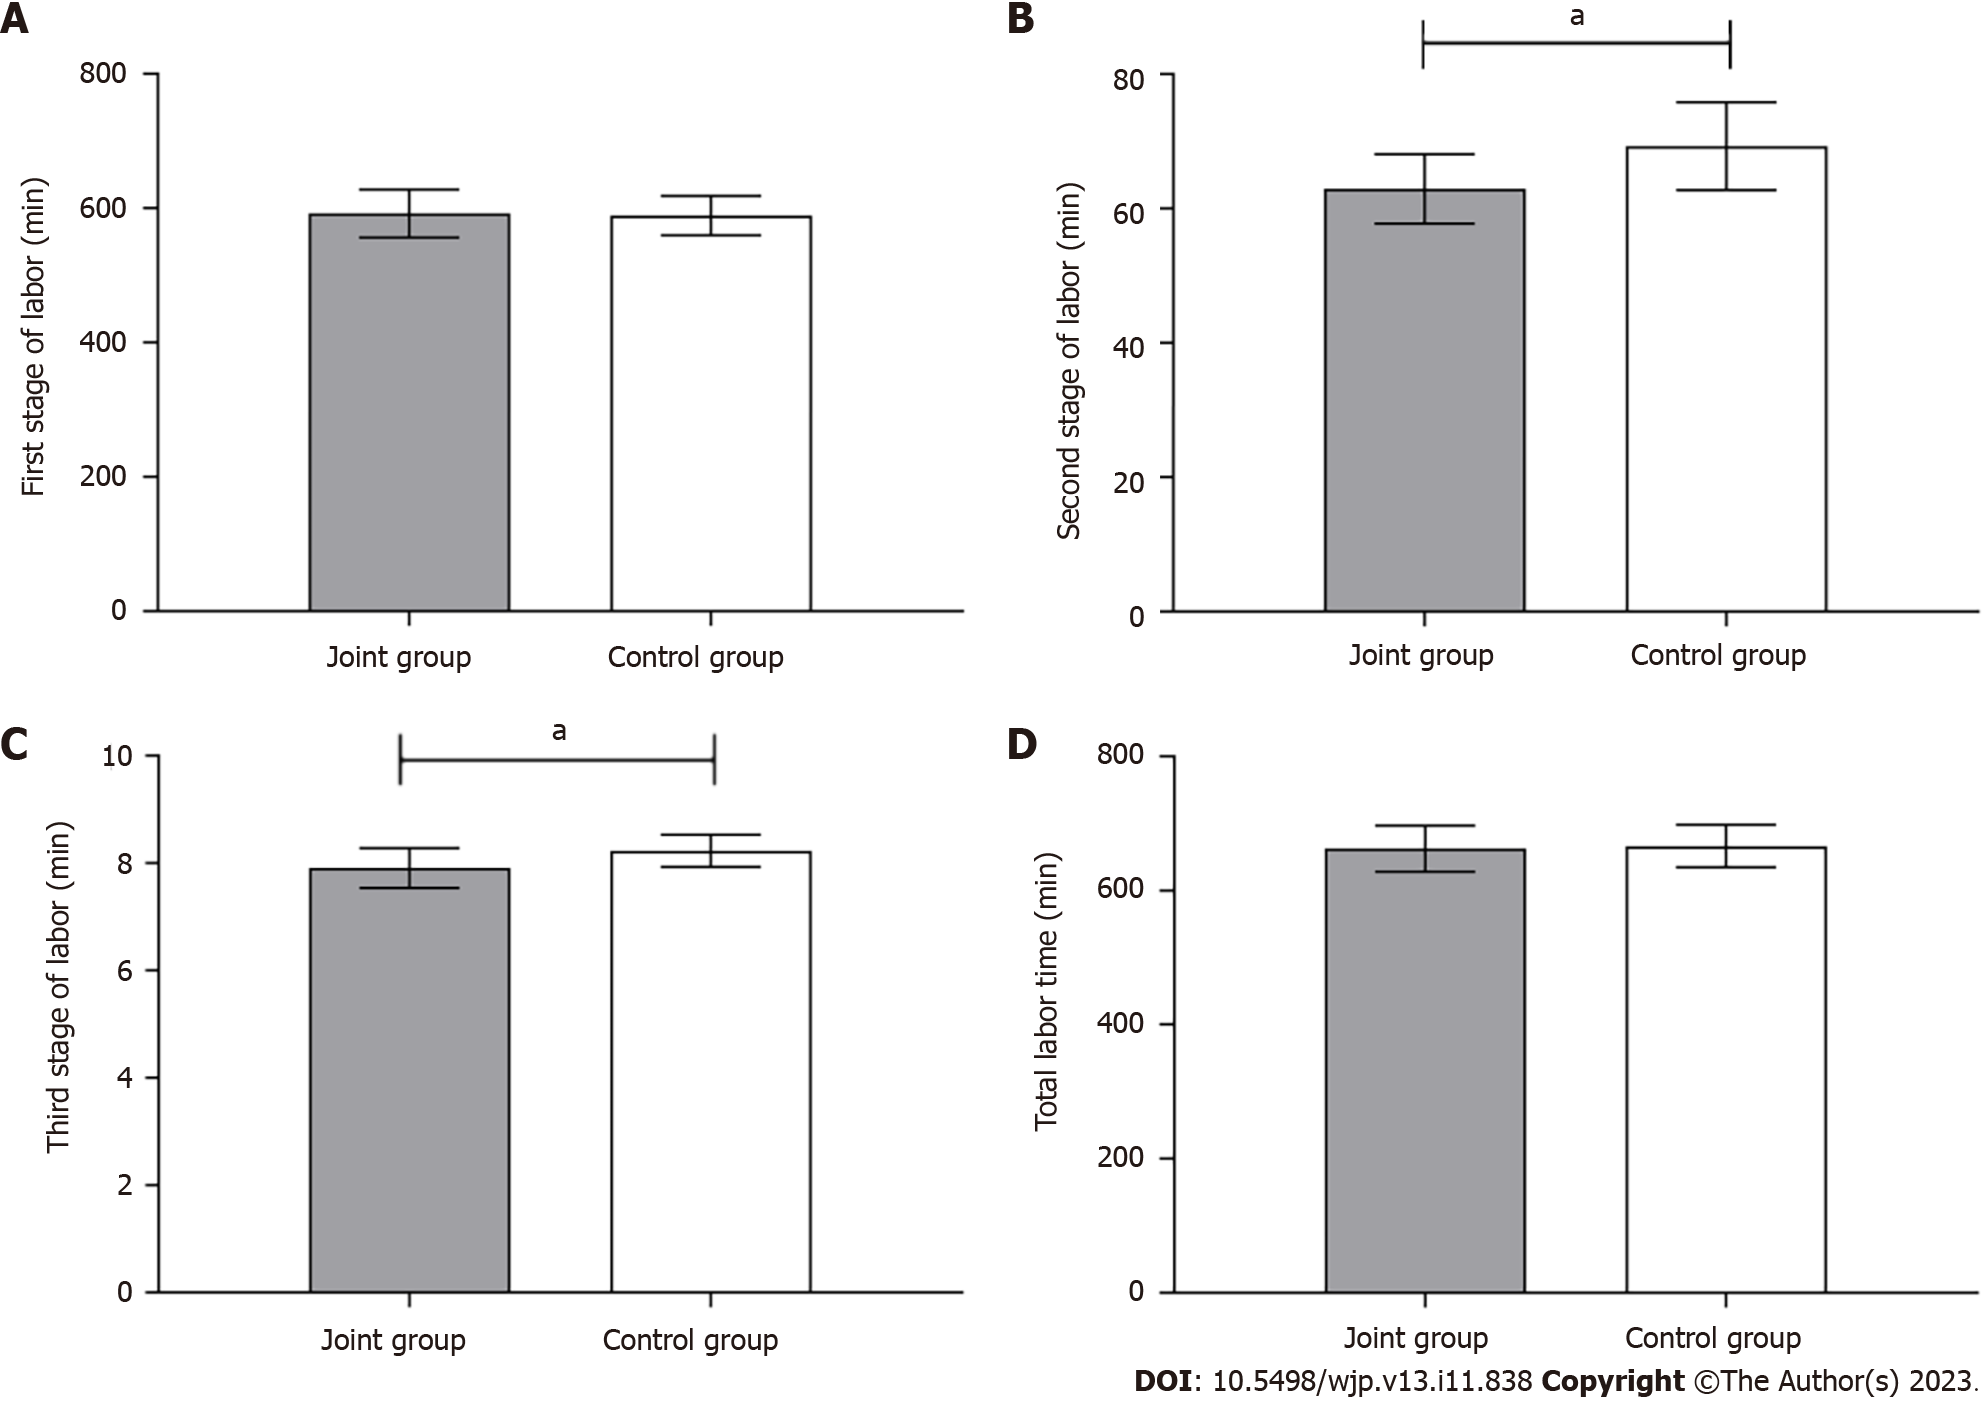
Figure 3 Comparison of labor duration between the two groups.
A: Comparison of the first stage of labor between the two groups; B: Comparison of the second stage of labor between the two groups; C: Comparison of the third stage of labor between the two groups; D: Comparison of the total stage of labor between the two groups. aP < 0.05, comparison with the joint group.
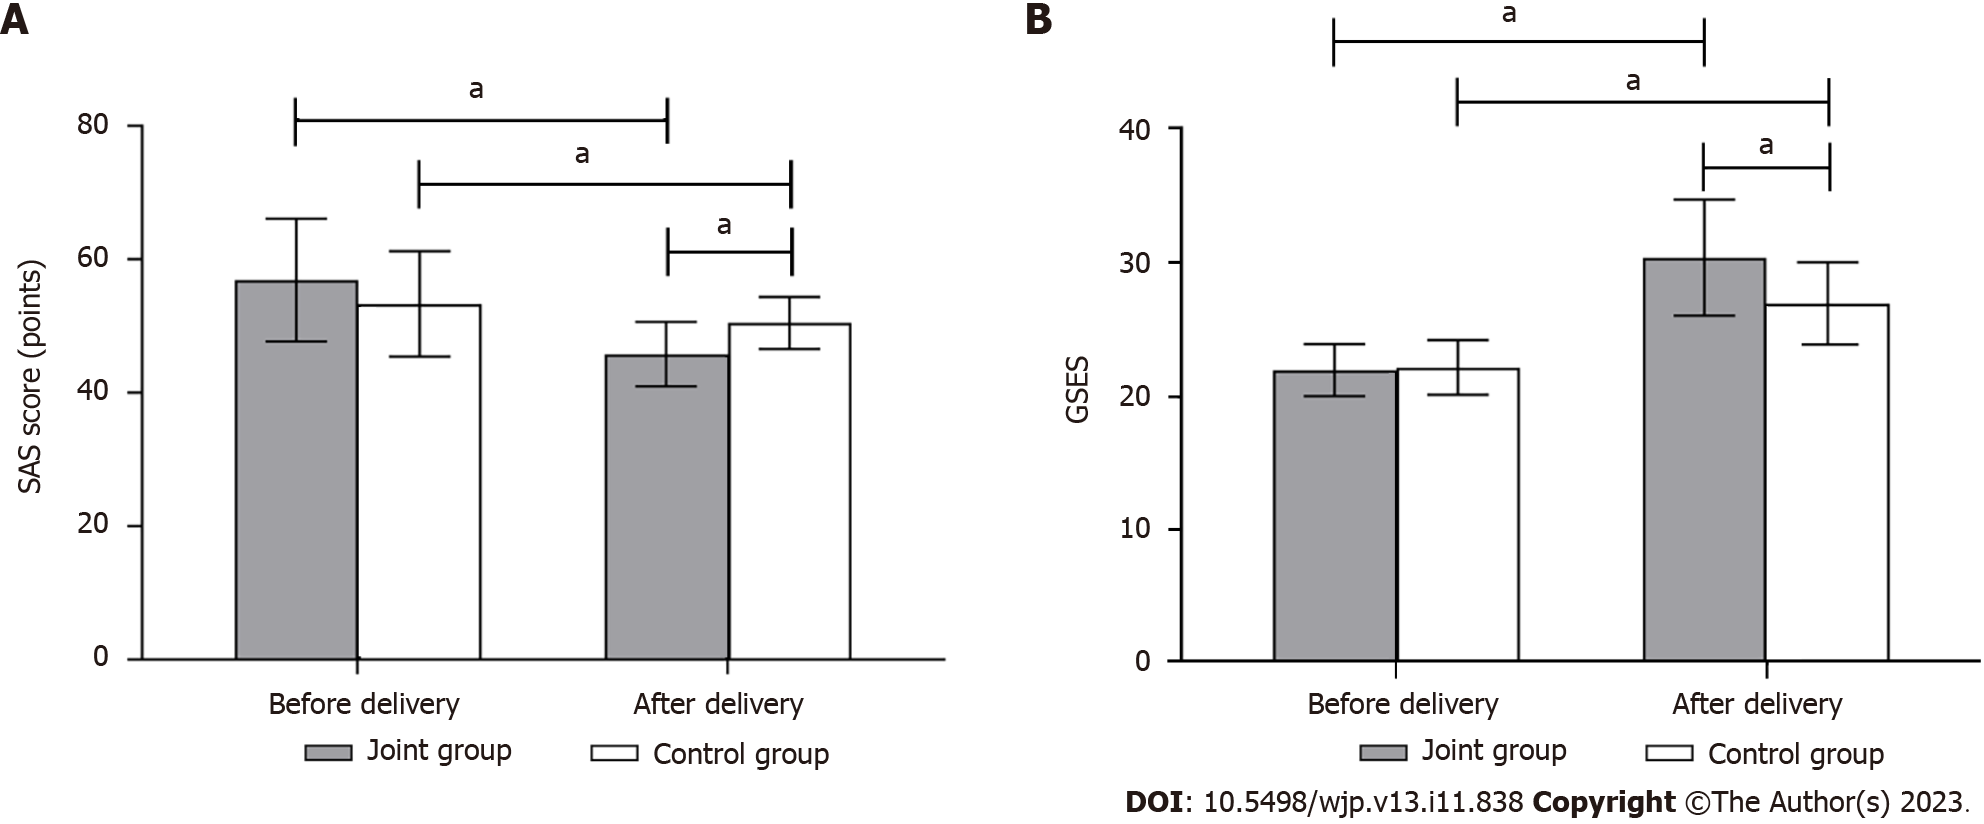
Figure 4 Comparison of anxiety and depression between the two groups.
A: Comparison of Self-rating Anxiety Scale score between the two groups; B: Comparison of General Self-Efficacy Scale between the two groups. aP < 0.05, comparison with the joint group. SAS: Self-rating Anxiety Scale; GSES: General Self-Efficacy Scale.
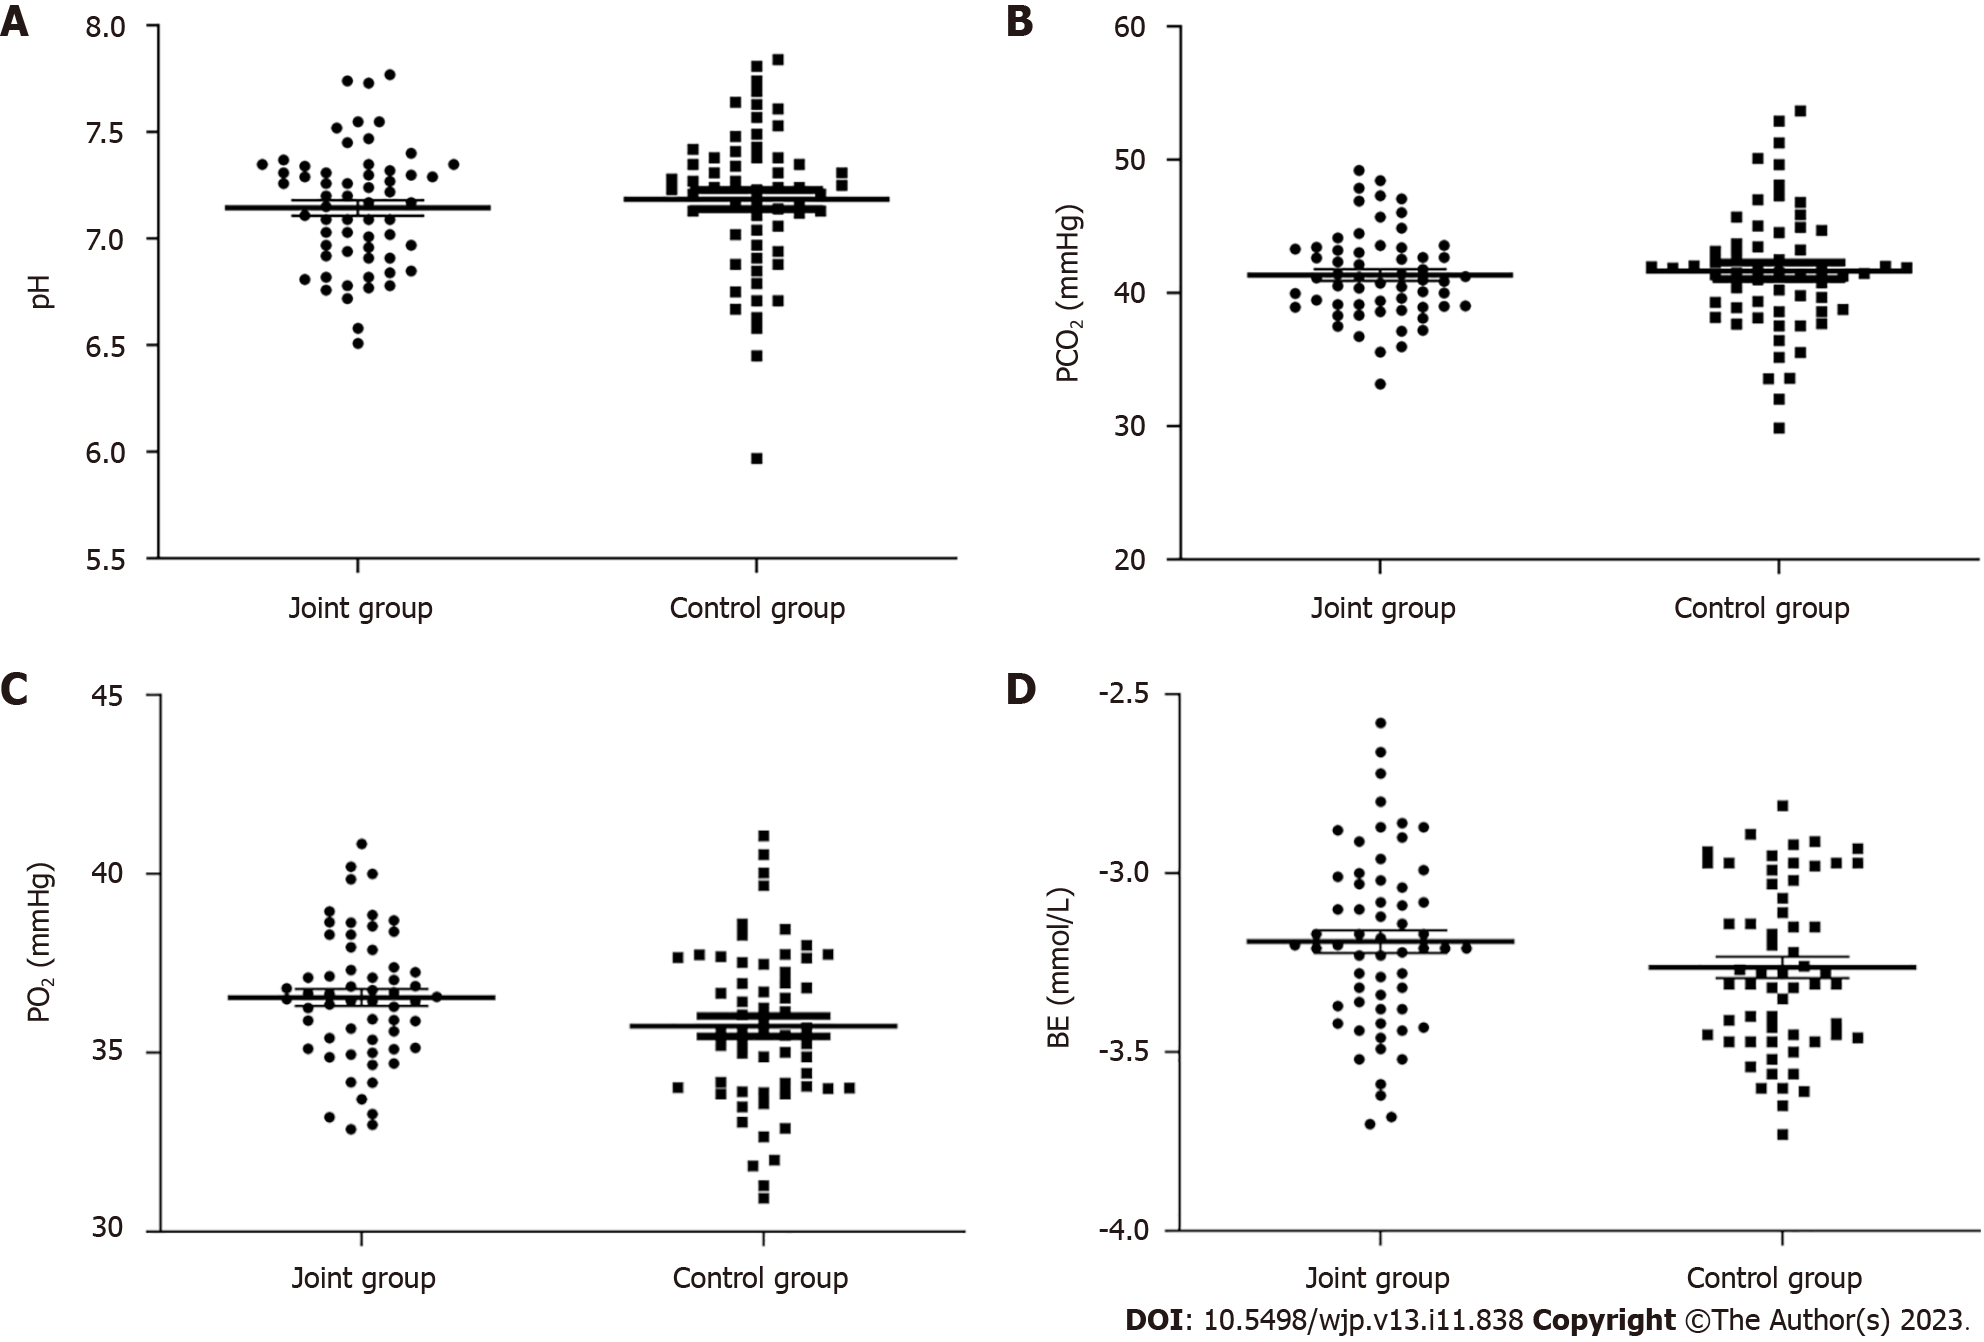
Figure 5 Comparison of blood gas analysis indices of the umbilical artery between the two groups.
A: Comparison of pH value between the two groups; B: Comparison of pCO2 value between the two groups; C: Comparison of pO2 value between the two groups; D: Comparison of BE value between the two groups.
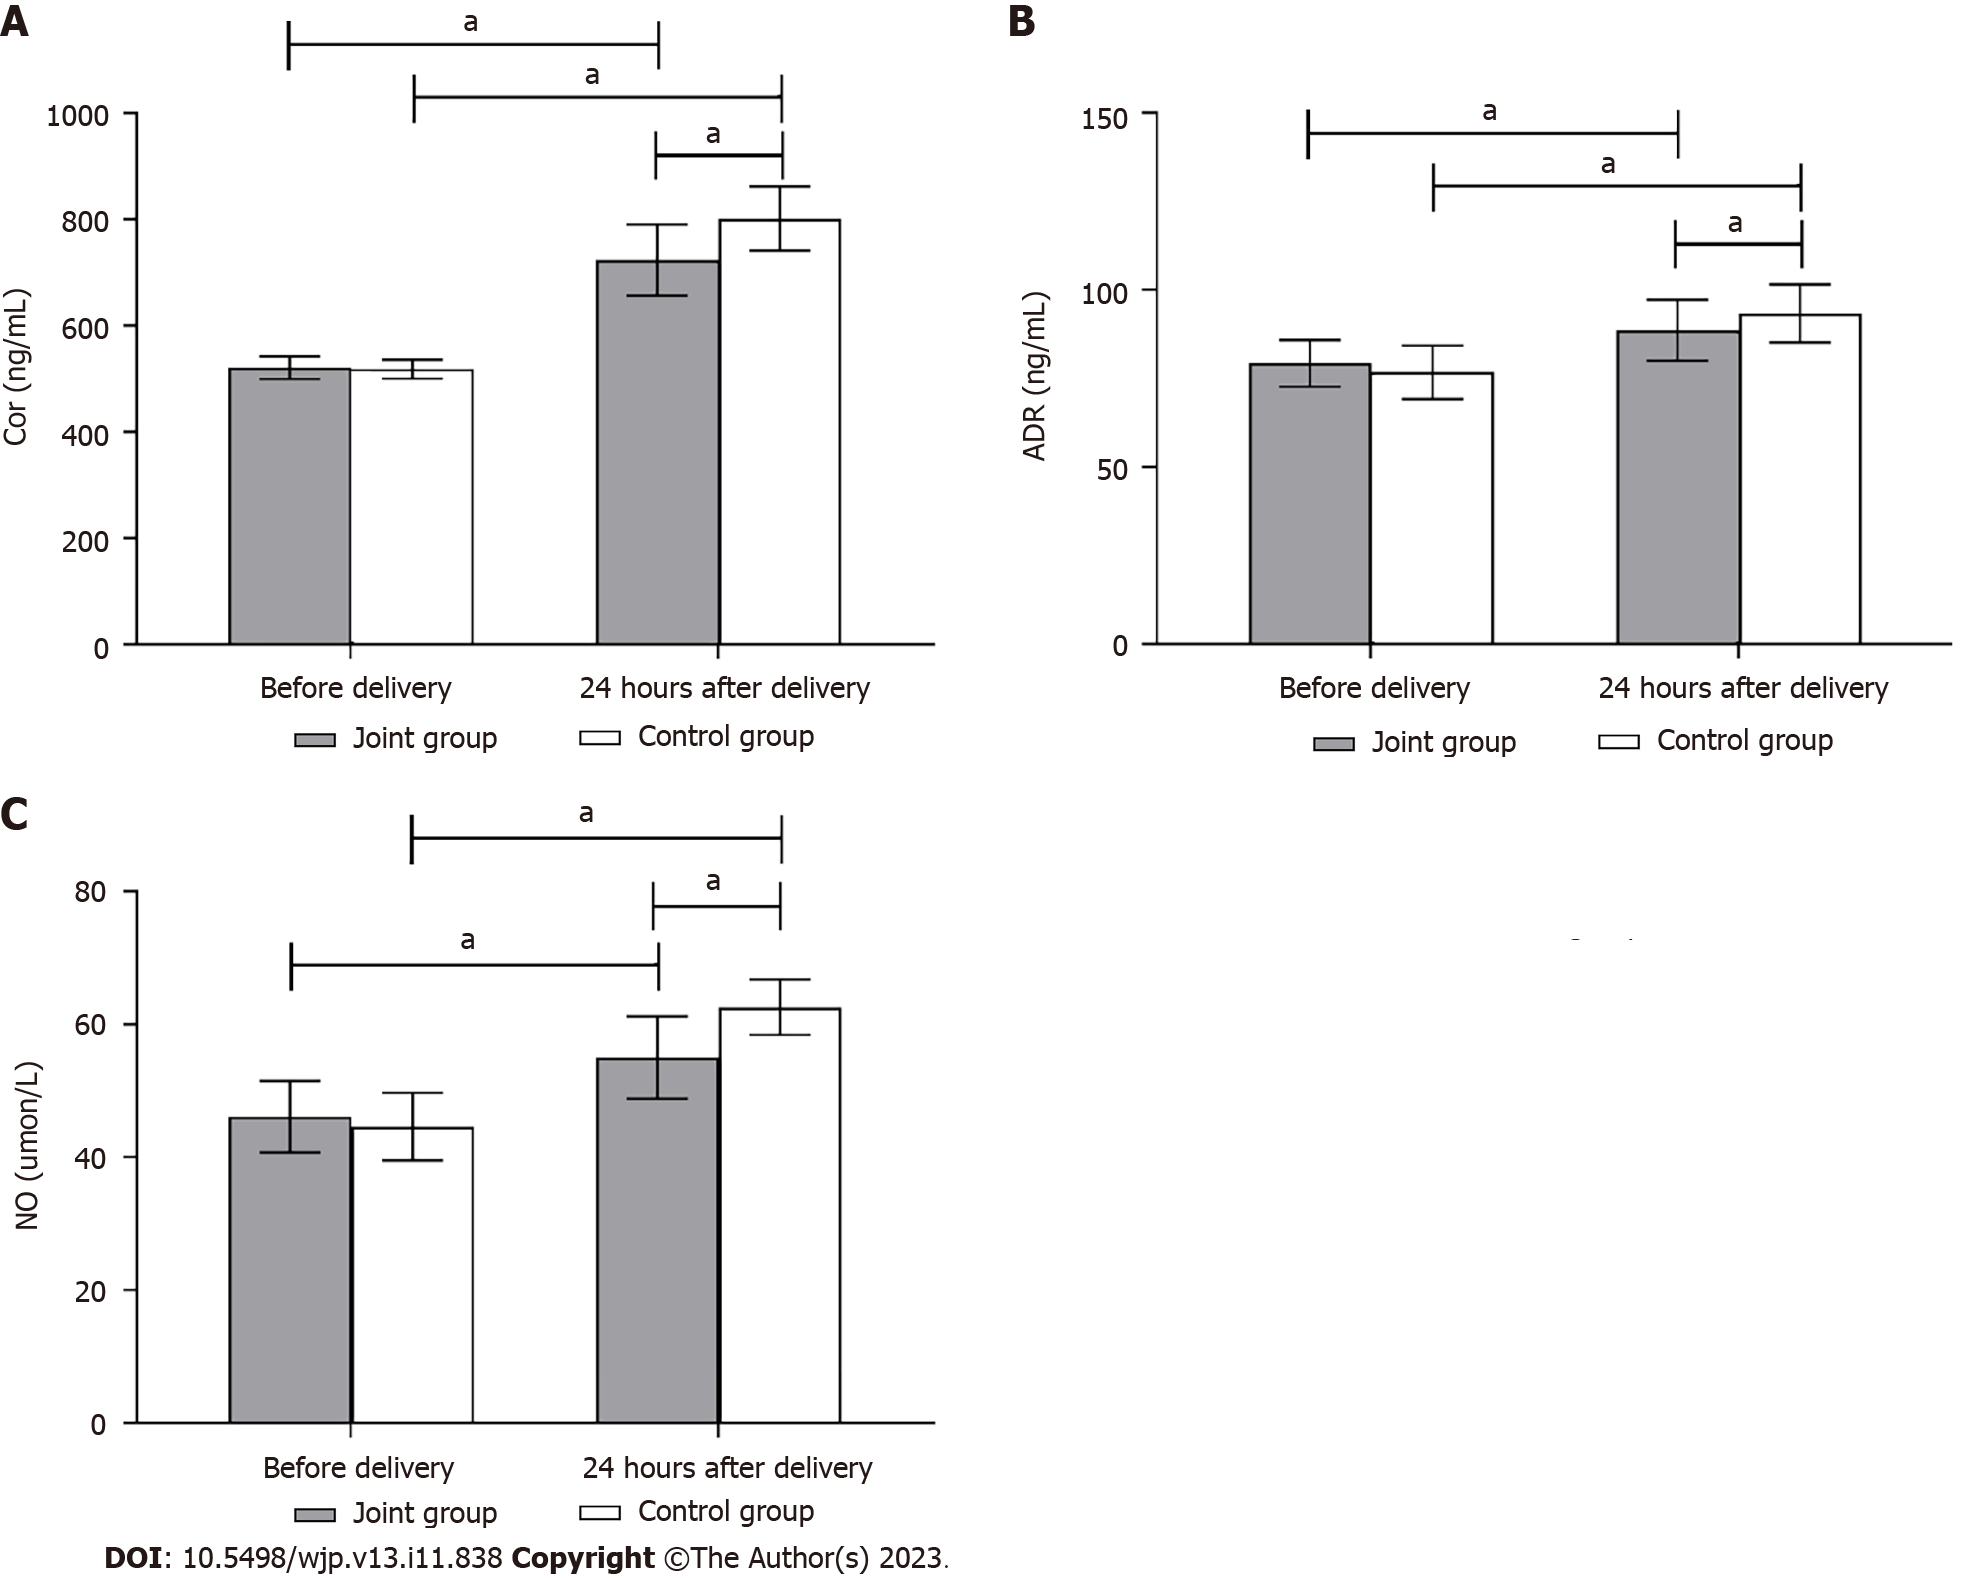
Figure 6 Comparison of stress indices between the two groups.
A: Comparison of cortisol value between the two groups; B: Comparison of adrenaline value between the two groups; C: Comparison of nitric oxide value between the two groups. aP < 0.05, comparison with the joint group. Cor: Cortisol; ADR: Adrenaline; NO: Nitric oxide.
- Citation: Cai L, Jiang JJ, Wang TT, Cao S. Effects of combined spinal-epidural anesthesia on anxiety, labor analgesia and motor blocks in women during natural delivery. World J Psychiatry 2023; 13(11): 838-847
- URL: https://www.wjgnet.com/2220-3206/full/v13/i11/838.htm
- DOI: https://dx.doi.org/10.5498/wjp.v13.i11.838


