Copyright
©The Author(s) 2023.
World J Psychiatry. Jan 19, 2023; 13(1): 1-14
Published online Jan 19, 2023. doi: 10.5498/wjp.v13.i1.1
Published online Jan 19, 2023. doi: 10.5498/wjp.v13.i1.1
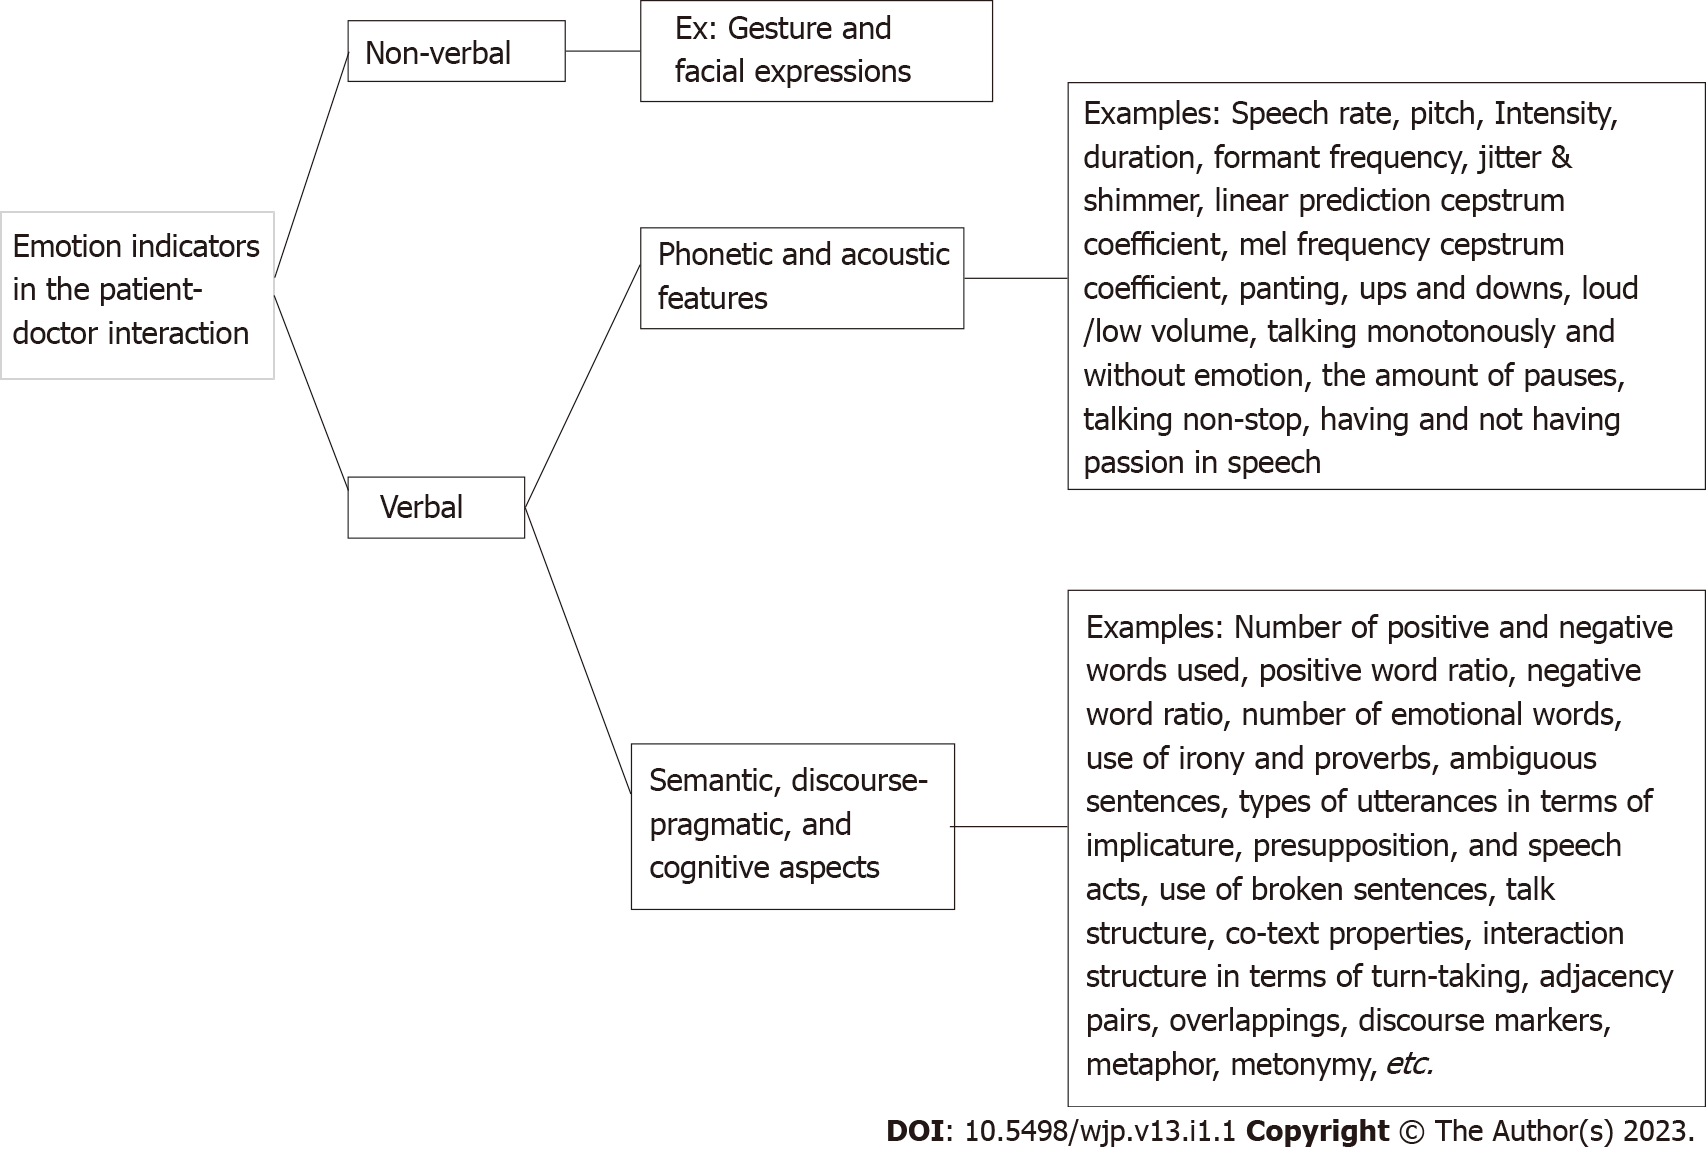
Figure 1 Emotion indicators in the patient-doctor interaction.
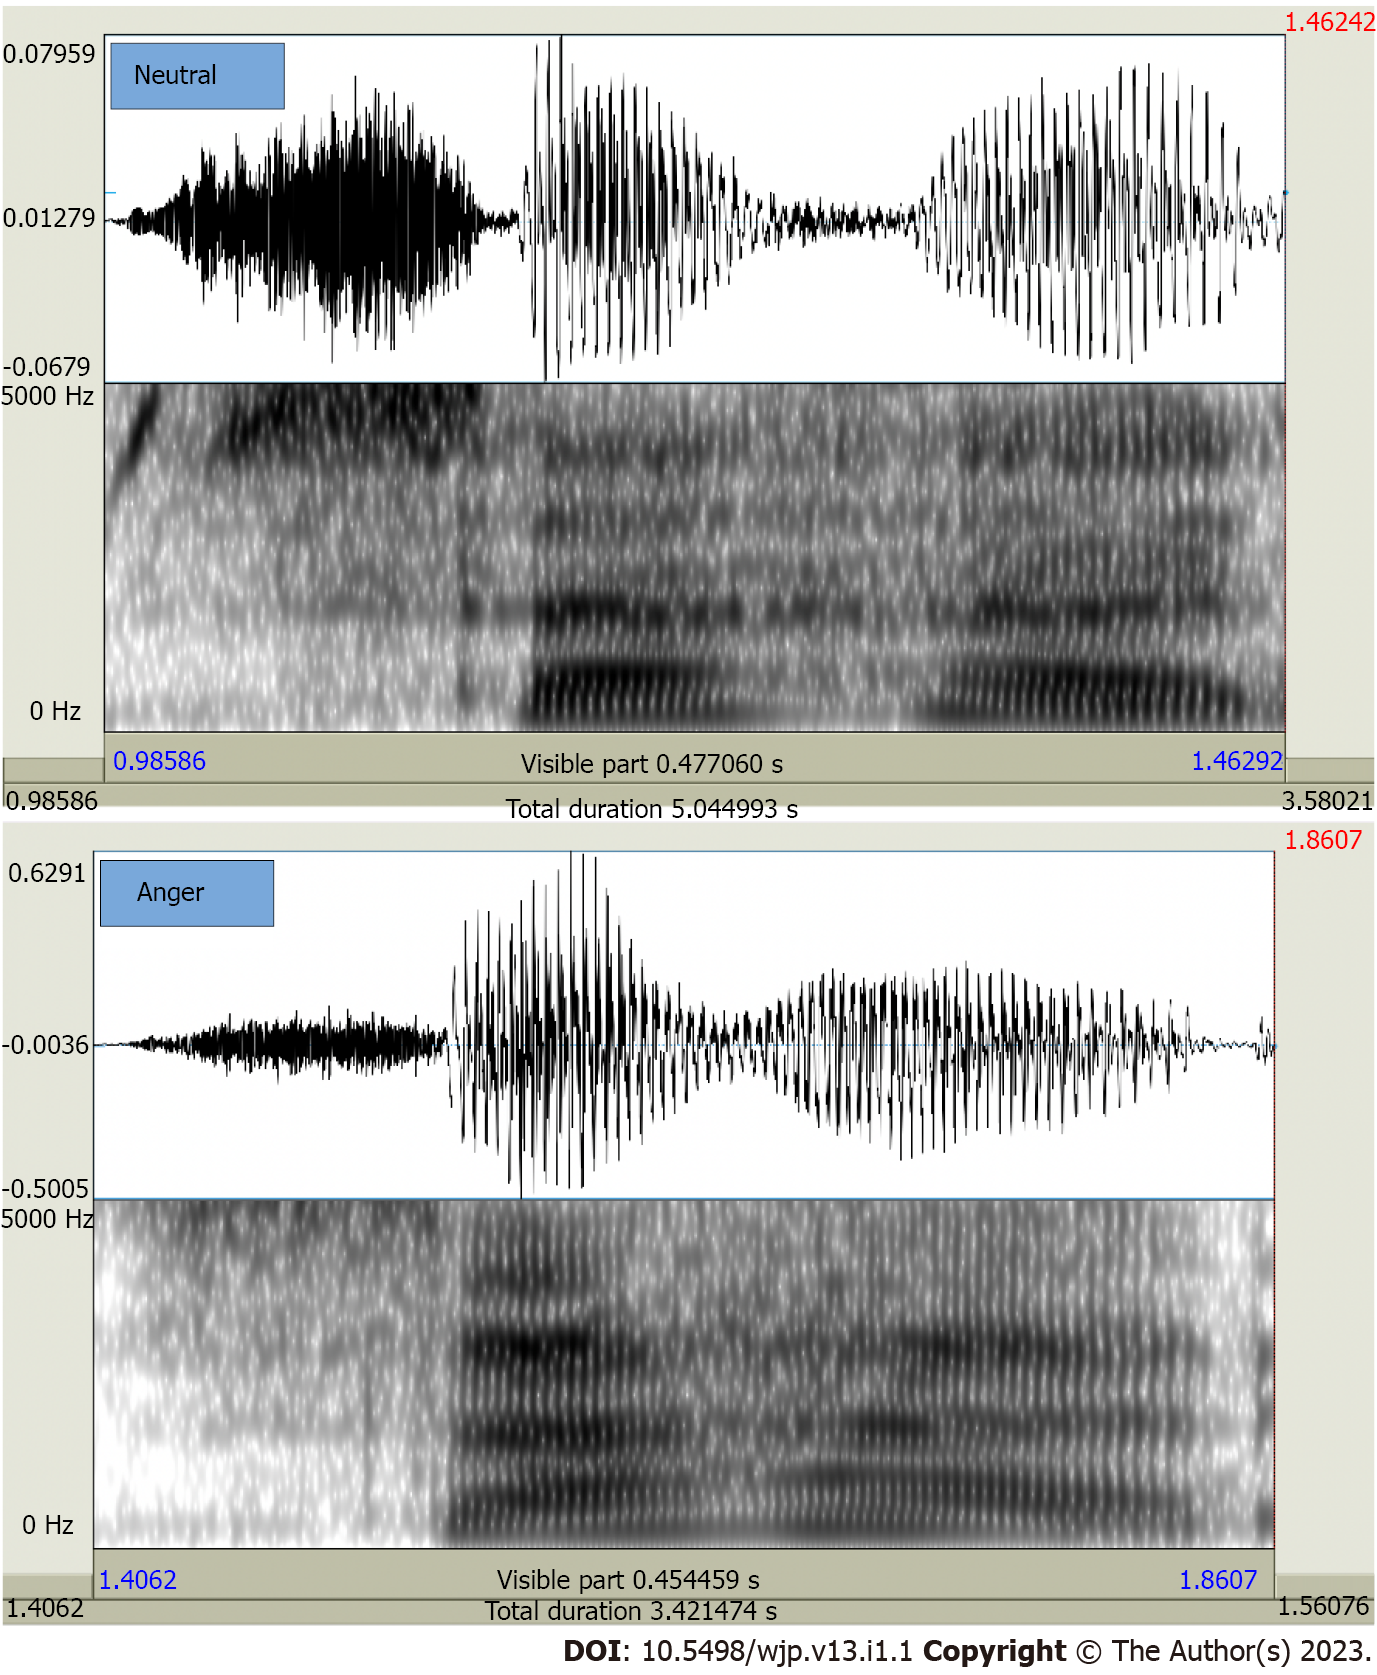
Figure 2 Spectrograms of the Persian word (sahar) pronounced by a Persian female speaker in neutral (top) and anger (down) situations.
Figure 2 shows spectrograms of the word (sahar), spoken by a native female speaker of Persian. The figure illustrates a couple of important differences between acoustic representations of the produced speech sounds. For example, the mean fundamental frequency in anger situations is higher (225 Hz) than that observed for neutral situations (200 Hz). Additionally, acoustic features such as mean formant frequencies (e.g. F1, F2, F3, and F4), minimum and maximum of the fundamental frequency, and mean intensity are lower in neutral situations. More details are provided in Table 1.
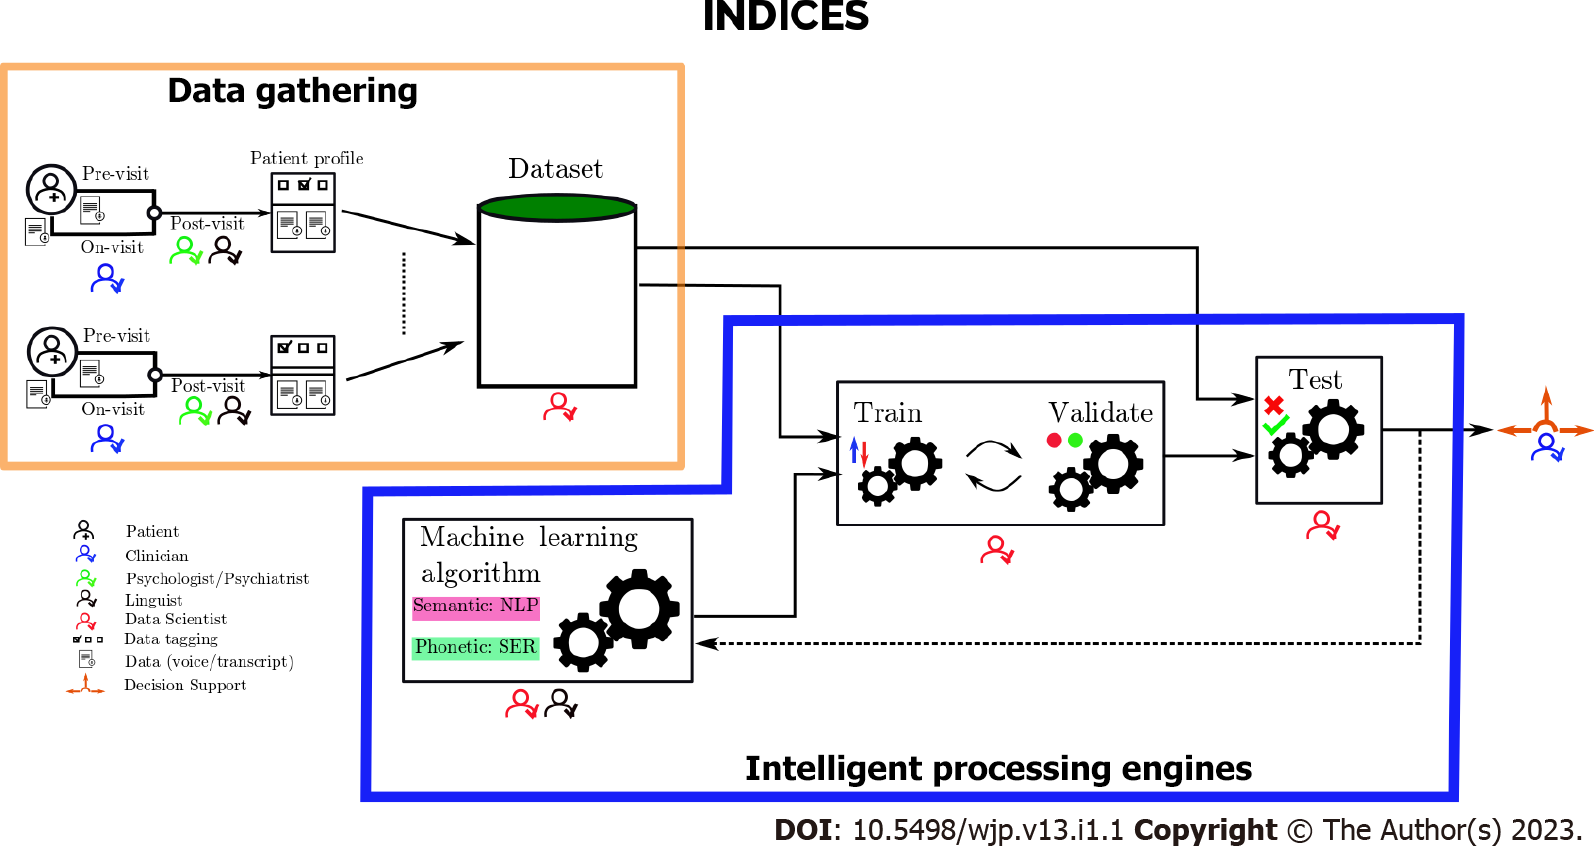
Figure 3 Integrated platform for patient emotion recognition and decision support.
It consists of the data gathering platform and the intelligent processing engines. Each patient’s data, in the form of voice/transcripts is captured, labeled, and stored in the dataset. The resulting dataset feeds the machine language training/validation and test engines. The entire process of intelligent processing may iterate several times for further fine tuning. It is crucial to have collaboration among the three relevant expertise in different parts of the proposed solution.
- Citation: Adibi P, Kalani S, Zahabi SJ, Asadi H, Bakhtiar M, Heidarpour MR, Roohafza H, Shahoon H, Amouzadeh M. Emotion recognition support system: Where physicians and psychiatrists meet linguists and data engineers. World J Psychiatry 2023; 13(1): 1-14
- URL: https://www.wjgnet.com/2220-3206/full/v13/i1/1.htm
- DOI: https://dx.doi.org/10.5498/wjp.v13.i1.1


