Copyright
©The Author(s) 2022.
World J Psychiatry. Sep 19, 2022; 12(9): 1233-1254
Published online Sep 19, 2022. doi: 10.5498/wjp.v12.i9.1233
Published online Sep 19, 2022. doi: 10.5498/wjp.v12.i9.1233
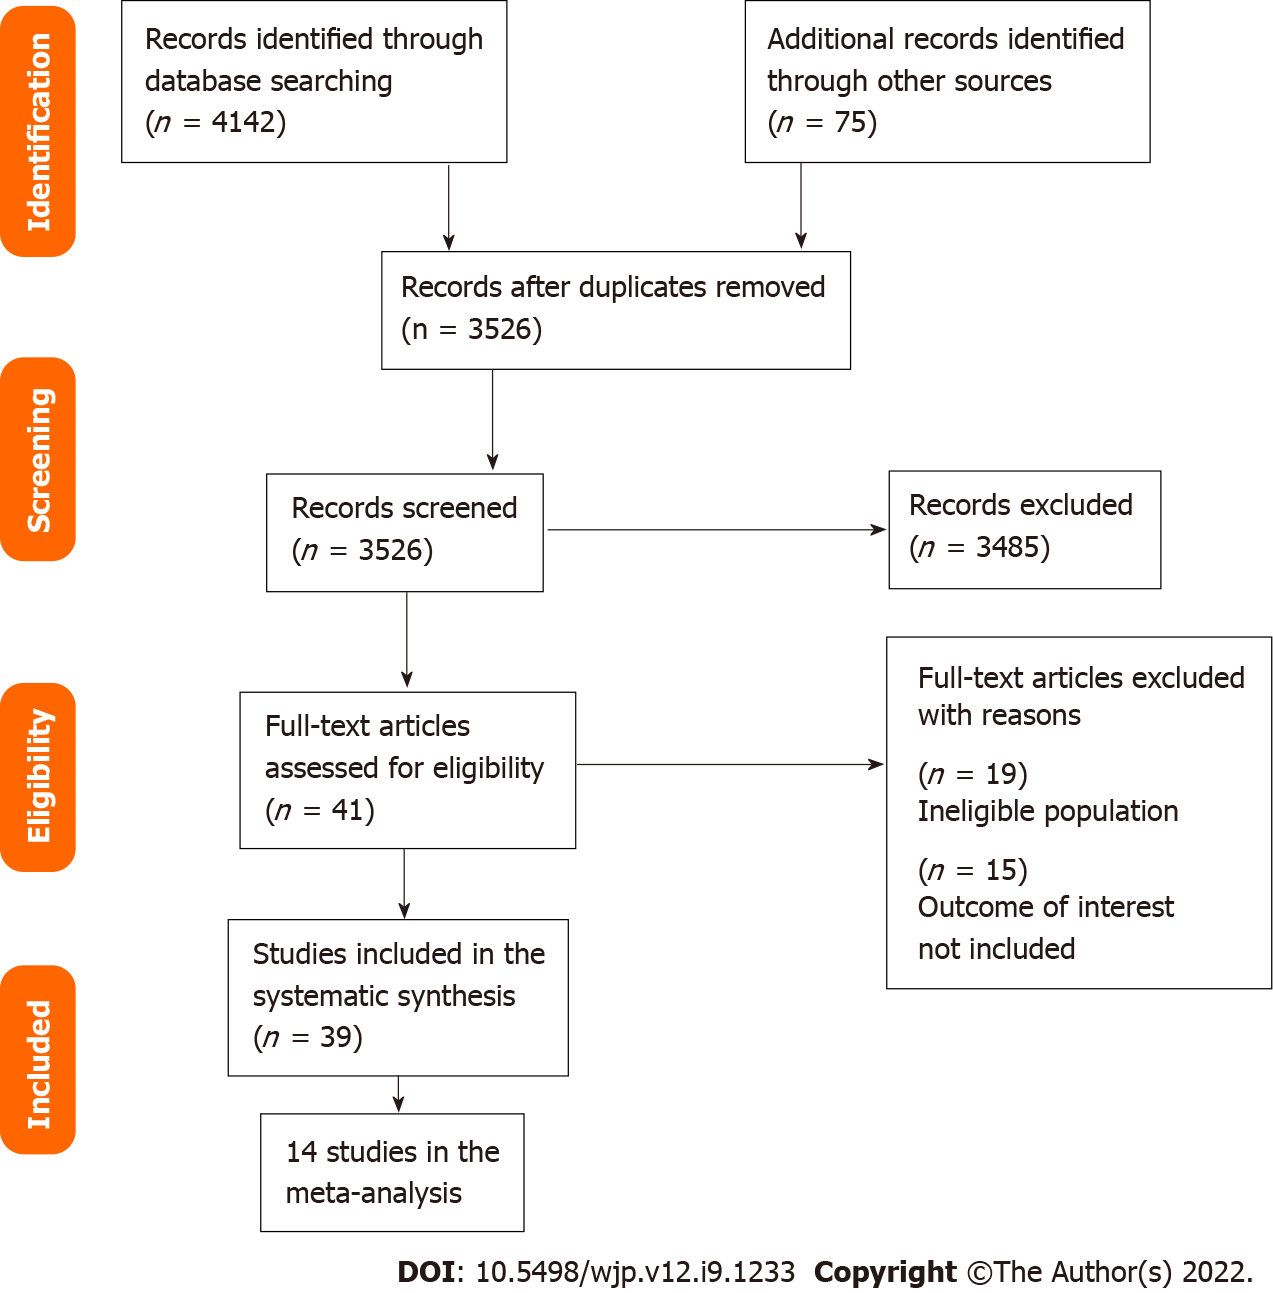
Figure 1 PRISMA diagram.
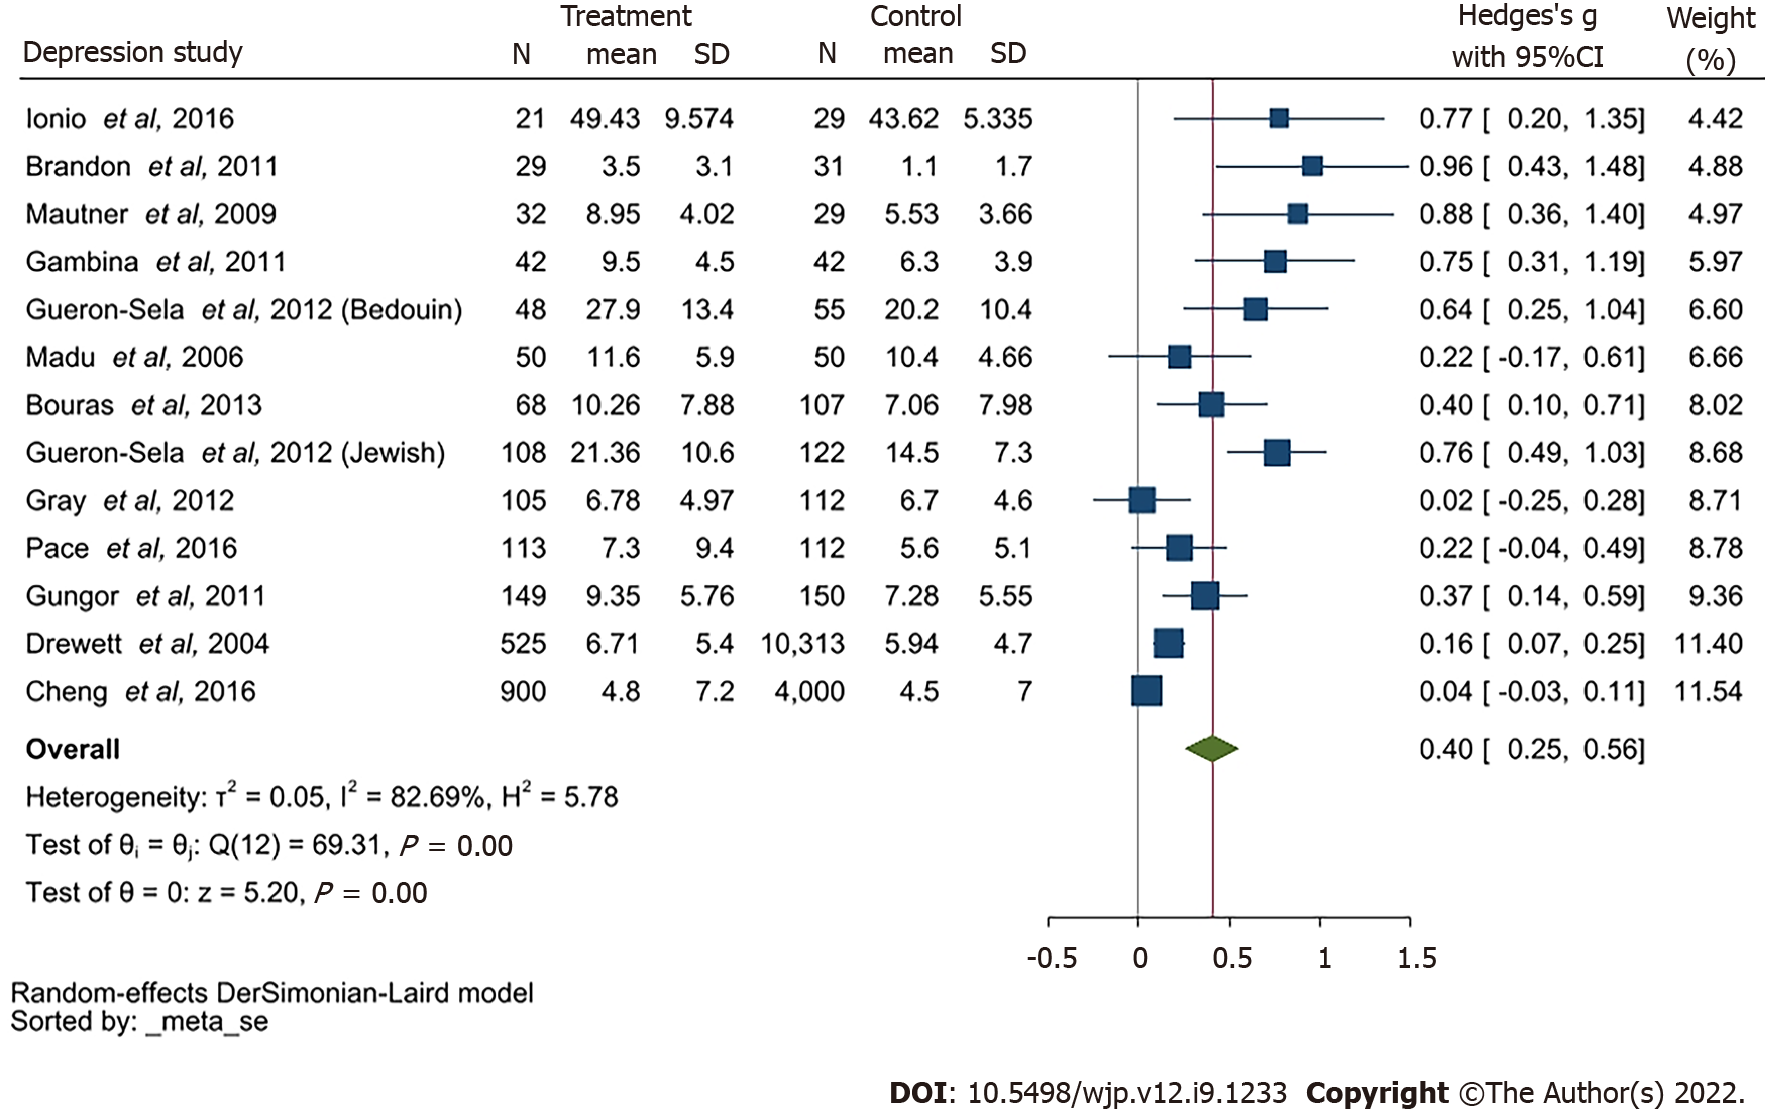
Figure 2 Forest plot for depression (full term vs preterm birth).
CI: Confidence interval.
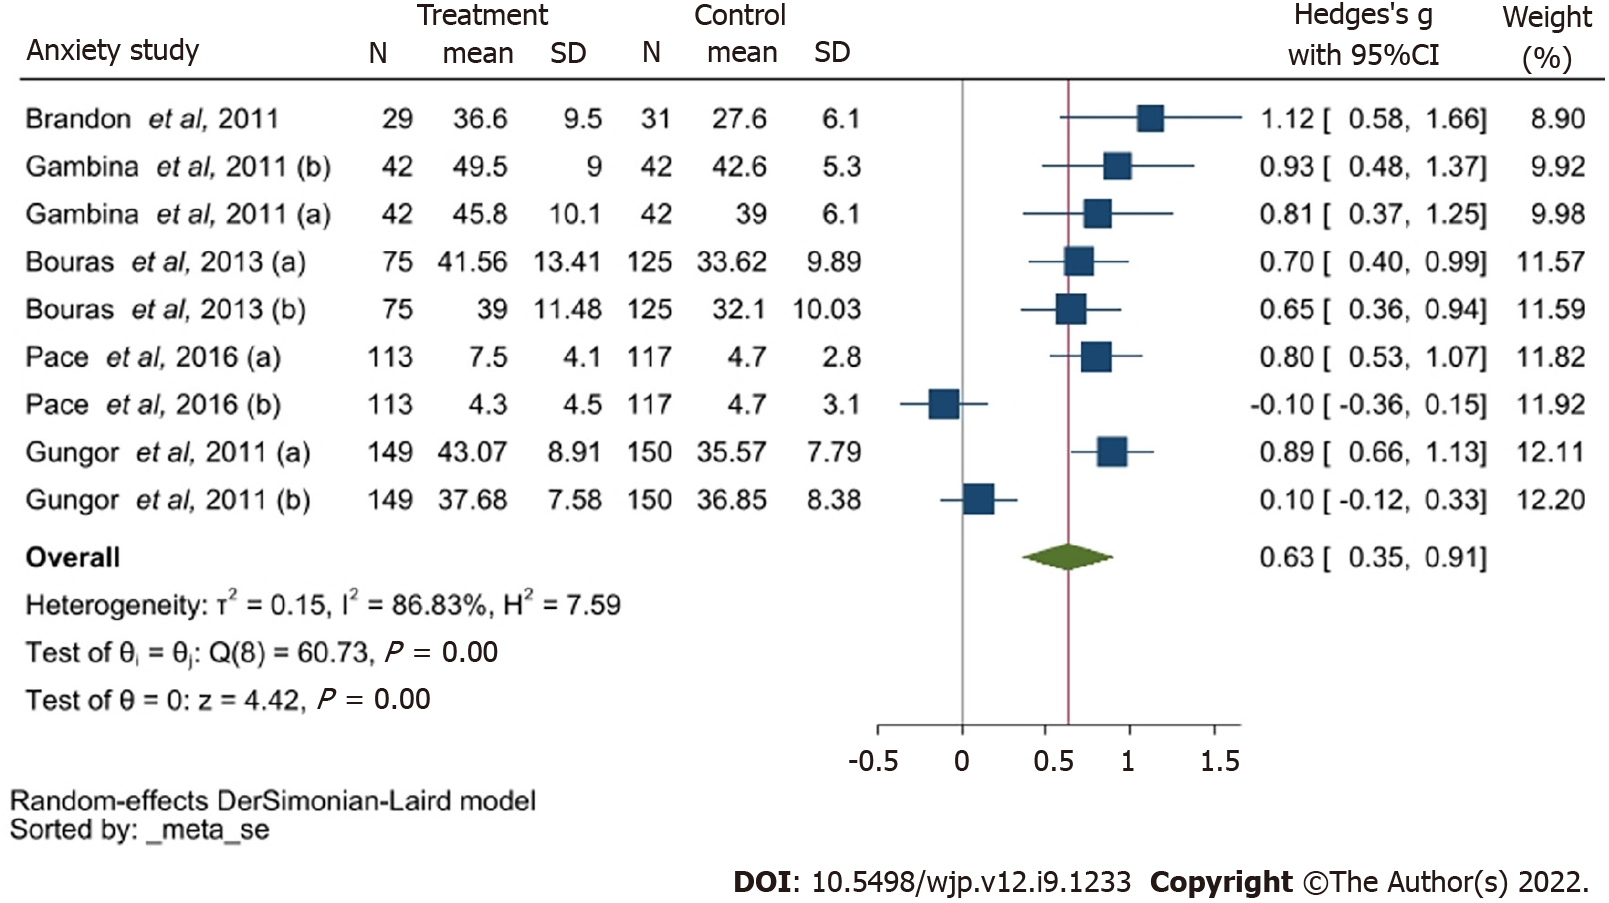
Figure 3 Forest plot for anxiety (full term vs preterm birth).
CI: Confidence interval.
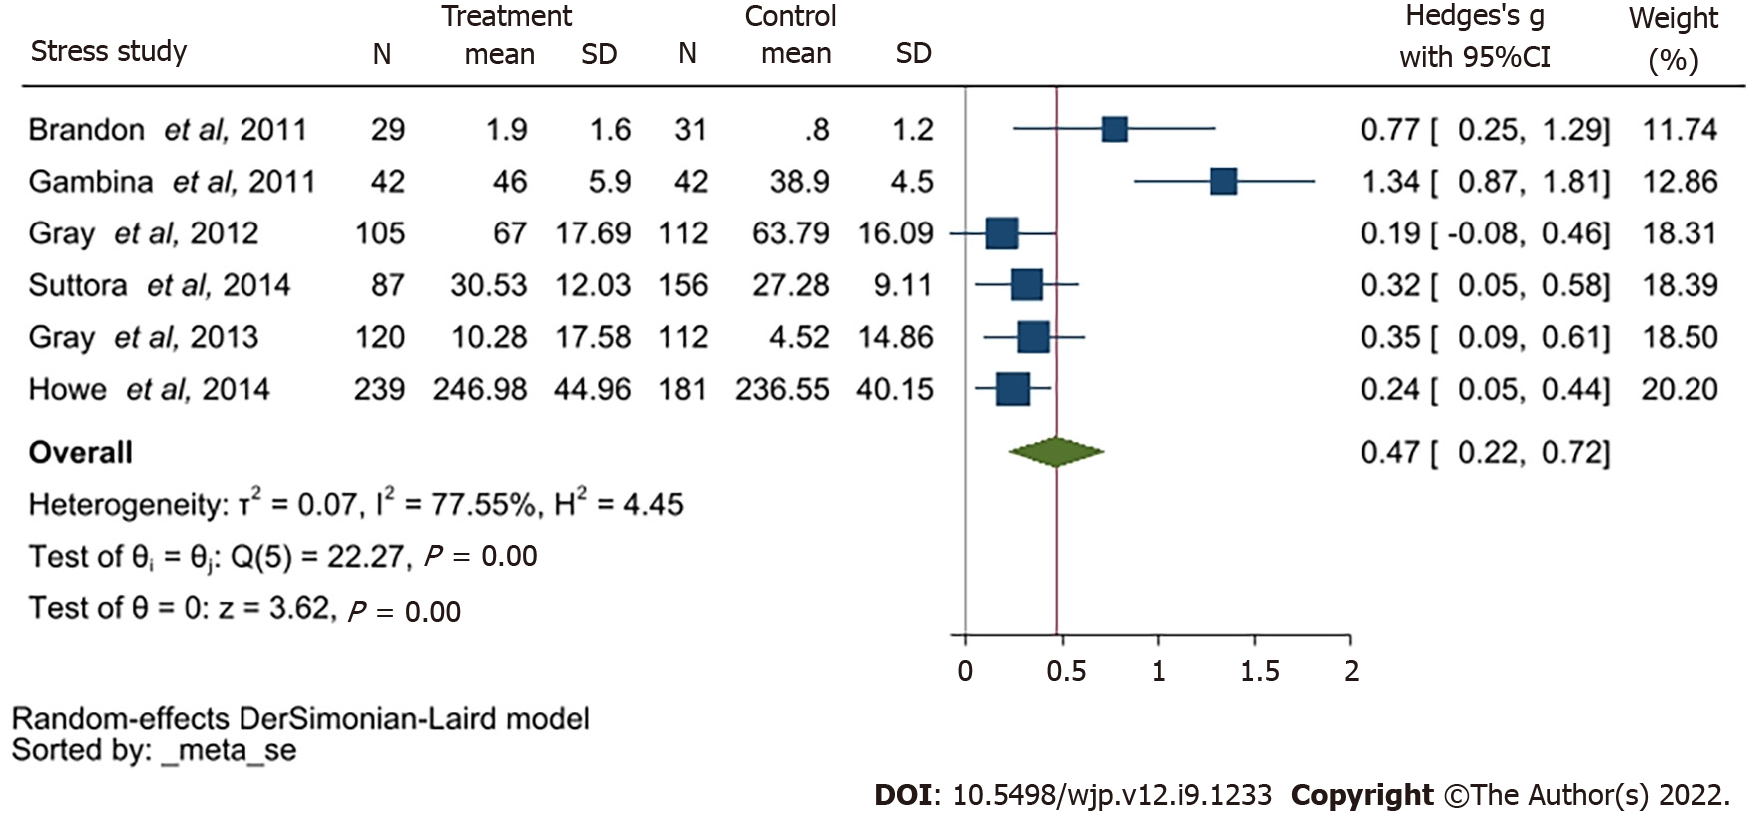
Figure 4 Forest plot for stress (full term vs preterm birth).
CI: Confidence interval.
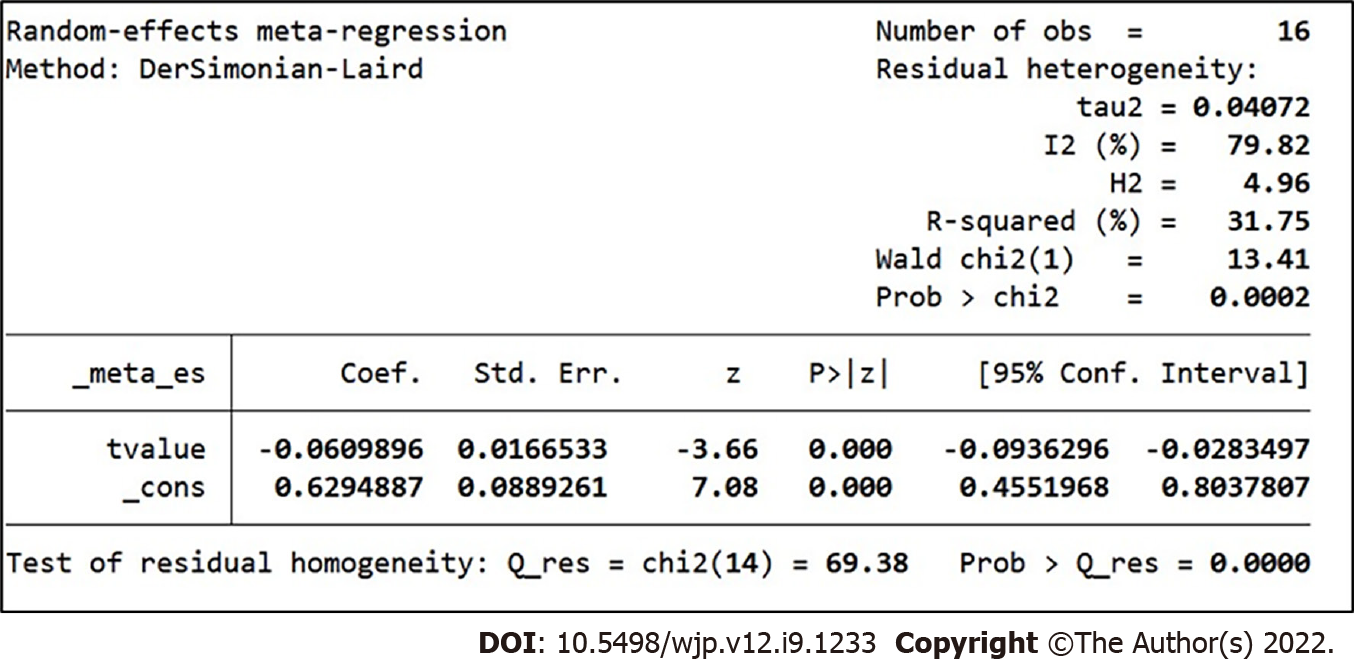
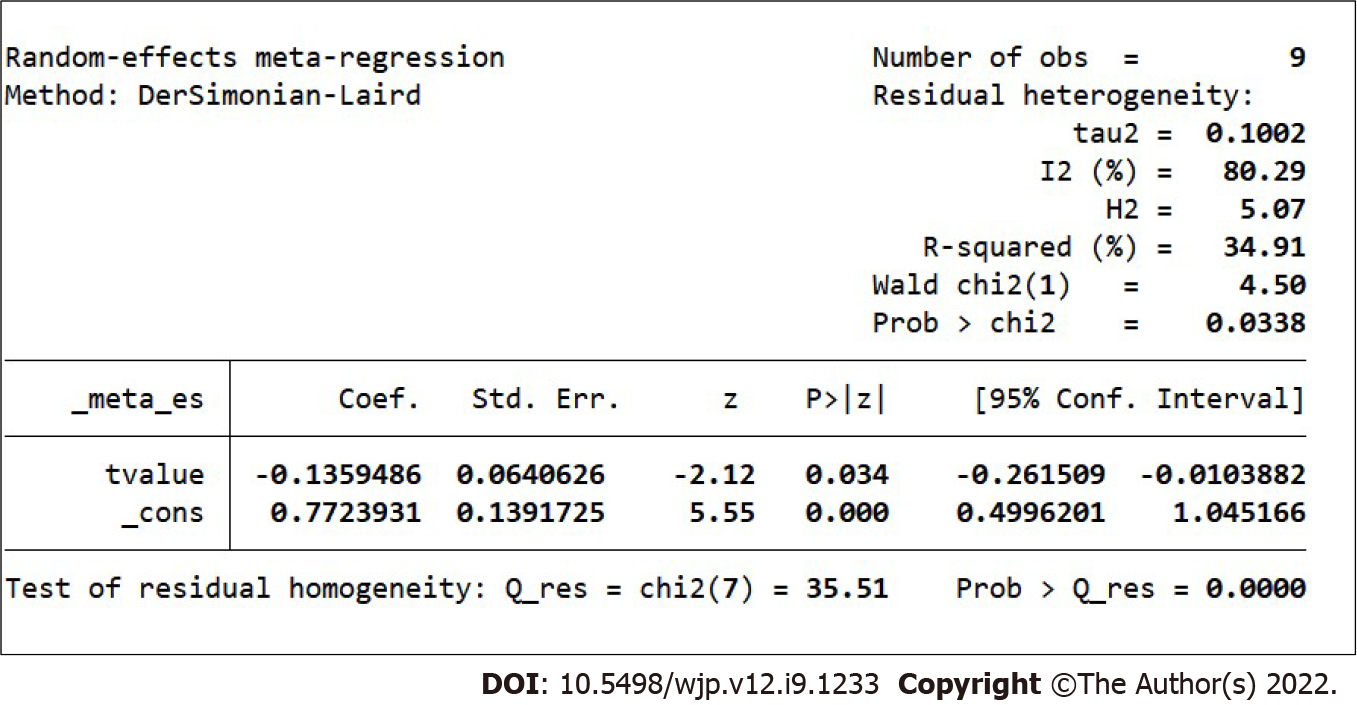
Figure 5 Meta regression conducted by time for depression.
Figure 6 Meta regression conducted by time for anxiety.
- Citation: Delanerolle G, Zeng YT, Phiri P, Phan T, Tempest N, Busuulwa P, Shetty A, Raymont V, Rathod S, Shi JQ, Hapangama DK. Mental health impact on Black, Asian and Minority Ethnic populations with preterm birth: A systematic review and meta-analysis. World J Psychiatry 2022; 12(9): 1233-1254
- URL: https://www.wjgnet.com/2220-3206/full/v12/i9/1233.htm
- DOI: https://dx.doi.org/10.5498/wjp.v12.i9.1233


