Copyright
©The Author(s) 2022.
World J Psychiatry. Jul 19, 2022; 12(7): 944-957
Published online Jul 19, 2022. doi: 10.5498/wjp.v12.i7.944
Published online Jul 19, 2022. doi: 10.5498/wjp.v12.i7.944
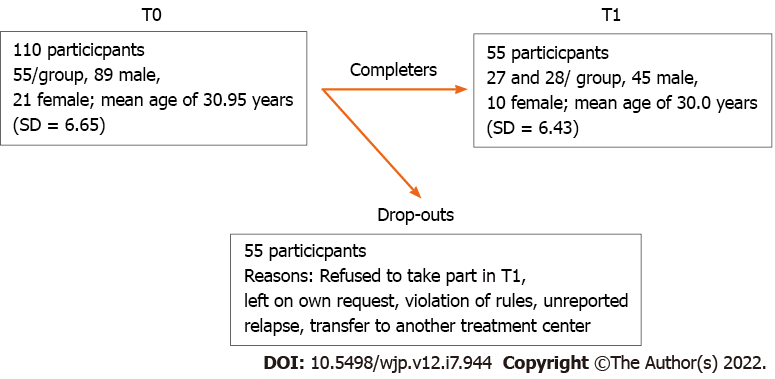
Figure 1 Characteristics of participants at each time point (T0 and T1).
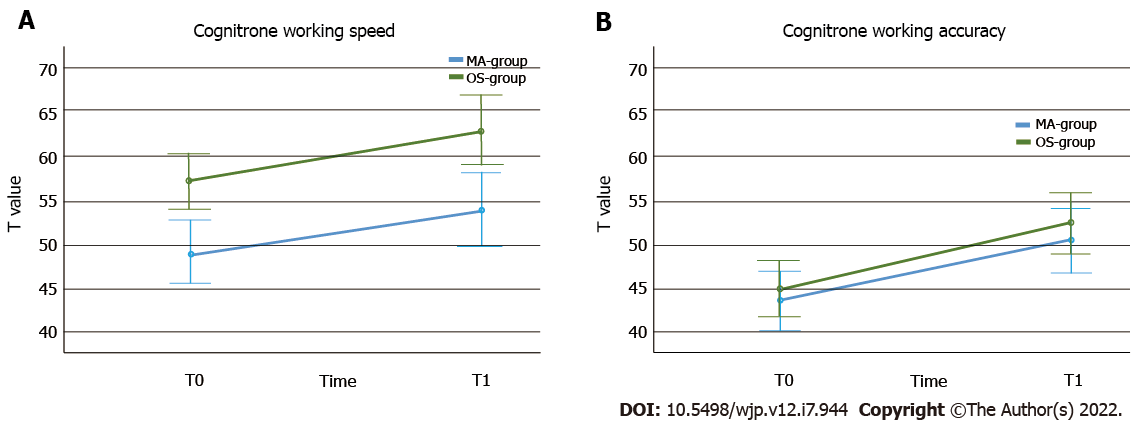
Figure 2 Working speed (A) over time and between groups (error bars represent 95% confidence interval) and working accuracy (B) over time and between groups (error bars represent 95% confidence interval).
MA: Methamphetamine; OS: Other substances.
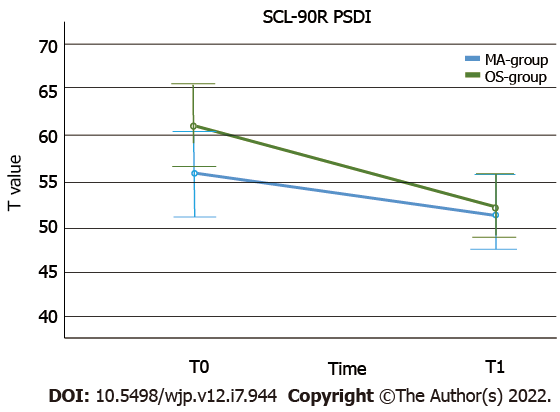
Figure 3 Positive Symptom Distress Index over time and between groups (error bars represent 95%CI).
MA: Methamphetamine; OS: Other substances; SCL-90-R: Positive symptom distress index.
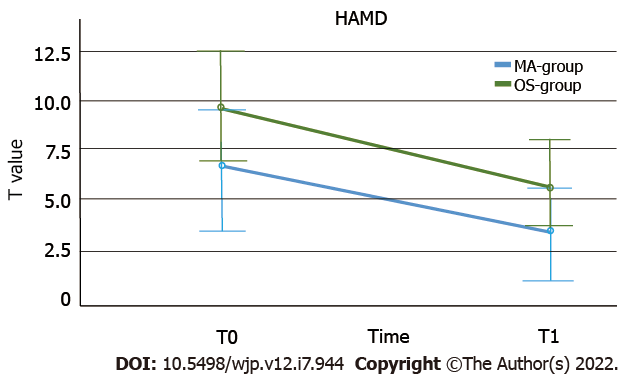
Figure 4 Hamilton Depressive Rating Scale scores over time and between groups (error bars represent 95% confidence interval).
HAMD: Hamilton Depression Rating Scale; MA: Methamphetamine; OS: Other substances.
- Citation: Behle N, Kamp F, Proebstl L, Hager L, Riebschläger M, Schacht-Jablonowsky M, Hamdorf W, Neumann S, Krause D, Manz K, Franke AG, Koller G, Soyka M. Treatment outcome, cognitive function, and psychopathology in methamphetamine users compared to other substance users. World J Psychiatry 2022; 12(7): 944-957
- URL: https://www.wjgnet.com/2220-3206/full/v12/i7/944.htm
- DOI: https://dx.doi.org/10.5498/wjp.v12.i7.944


