Copyright
©The Author(s) 2022.
World J Psychiatry. Mar 19, 2022; 12(3): 410-424
Published online Mar 19, 2022. doi: 10.5498/wjp.v12.i3.410
Published online Mar 19, 2022. doi: 10.5498/wjp.v12.i3.410
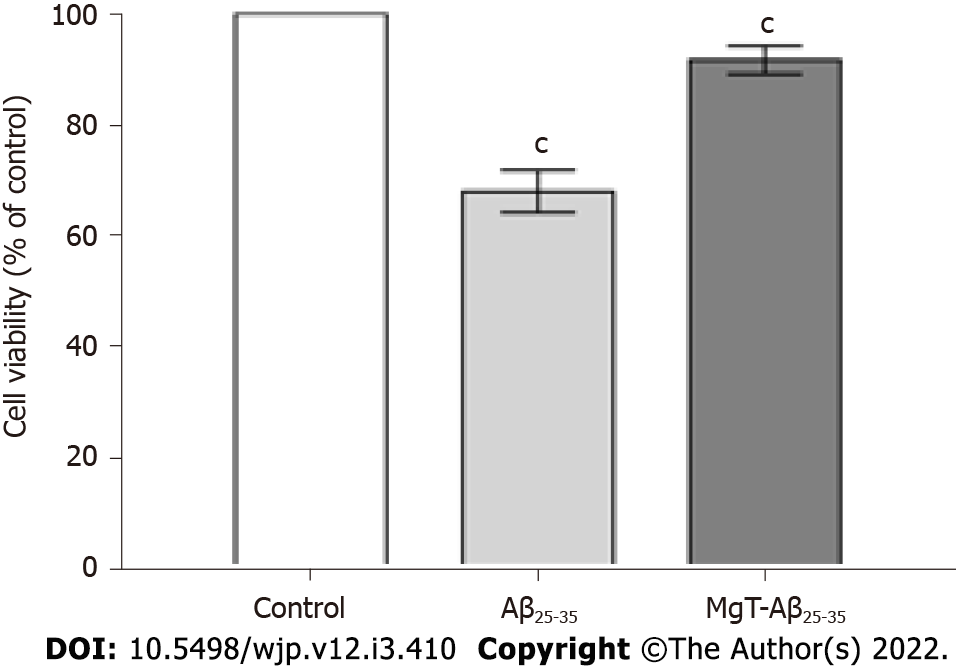
Figure 1 Magnesium-L-threonate administration inhibited the cytotoxicity in the amyloid β25-35-administrated HT22 cells.
n = 3. cP < 0.001 vs former group. Aβ: Amyloid β; MgT: Magnesium-L-threonate.
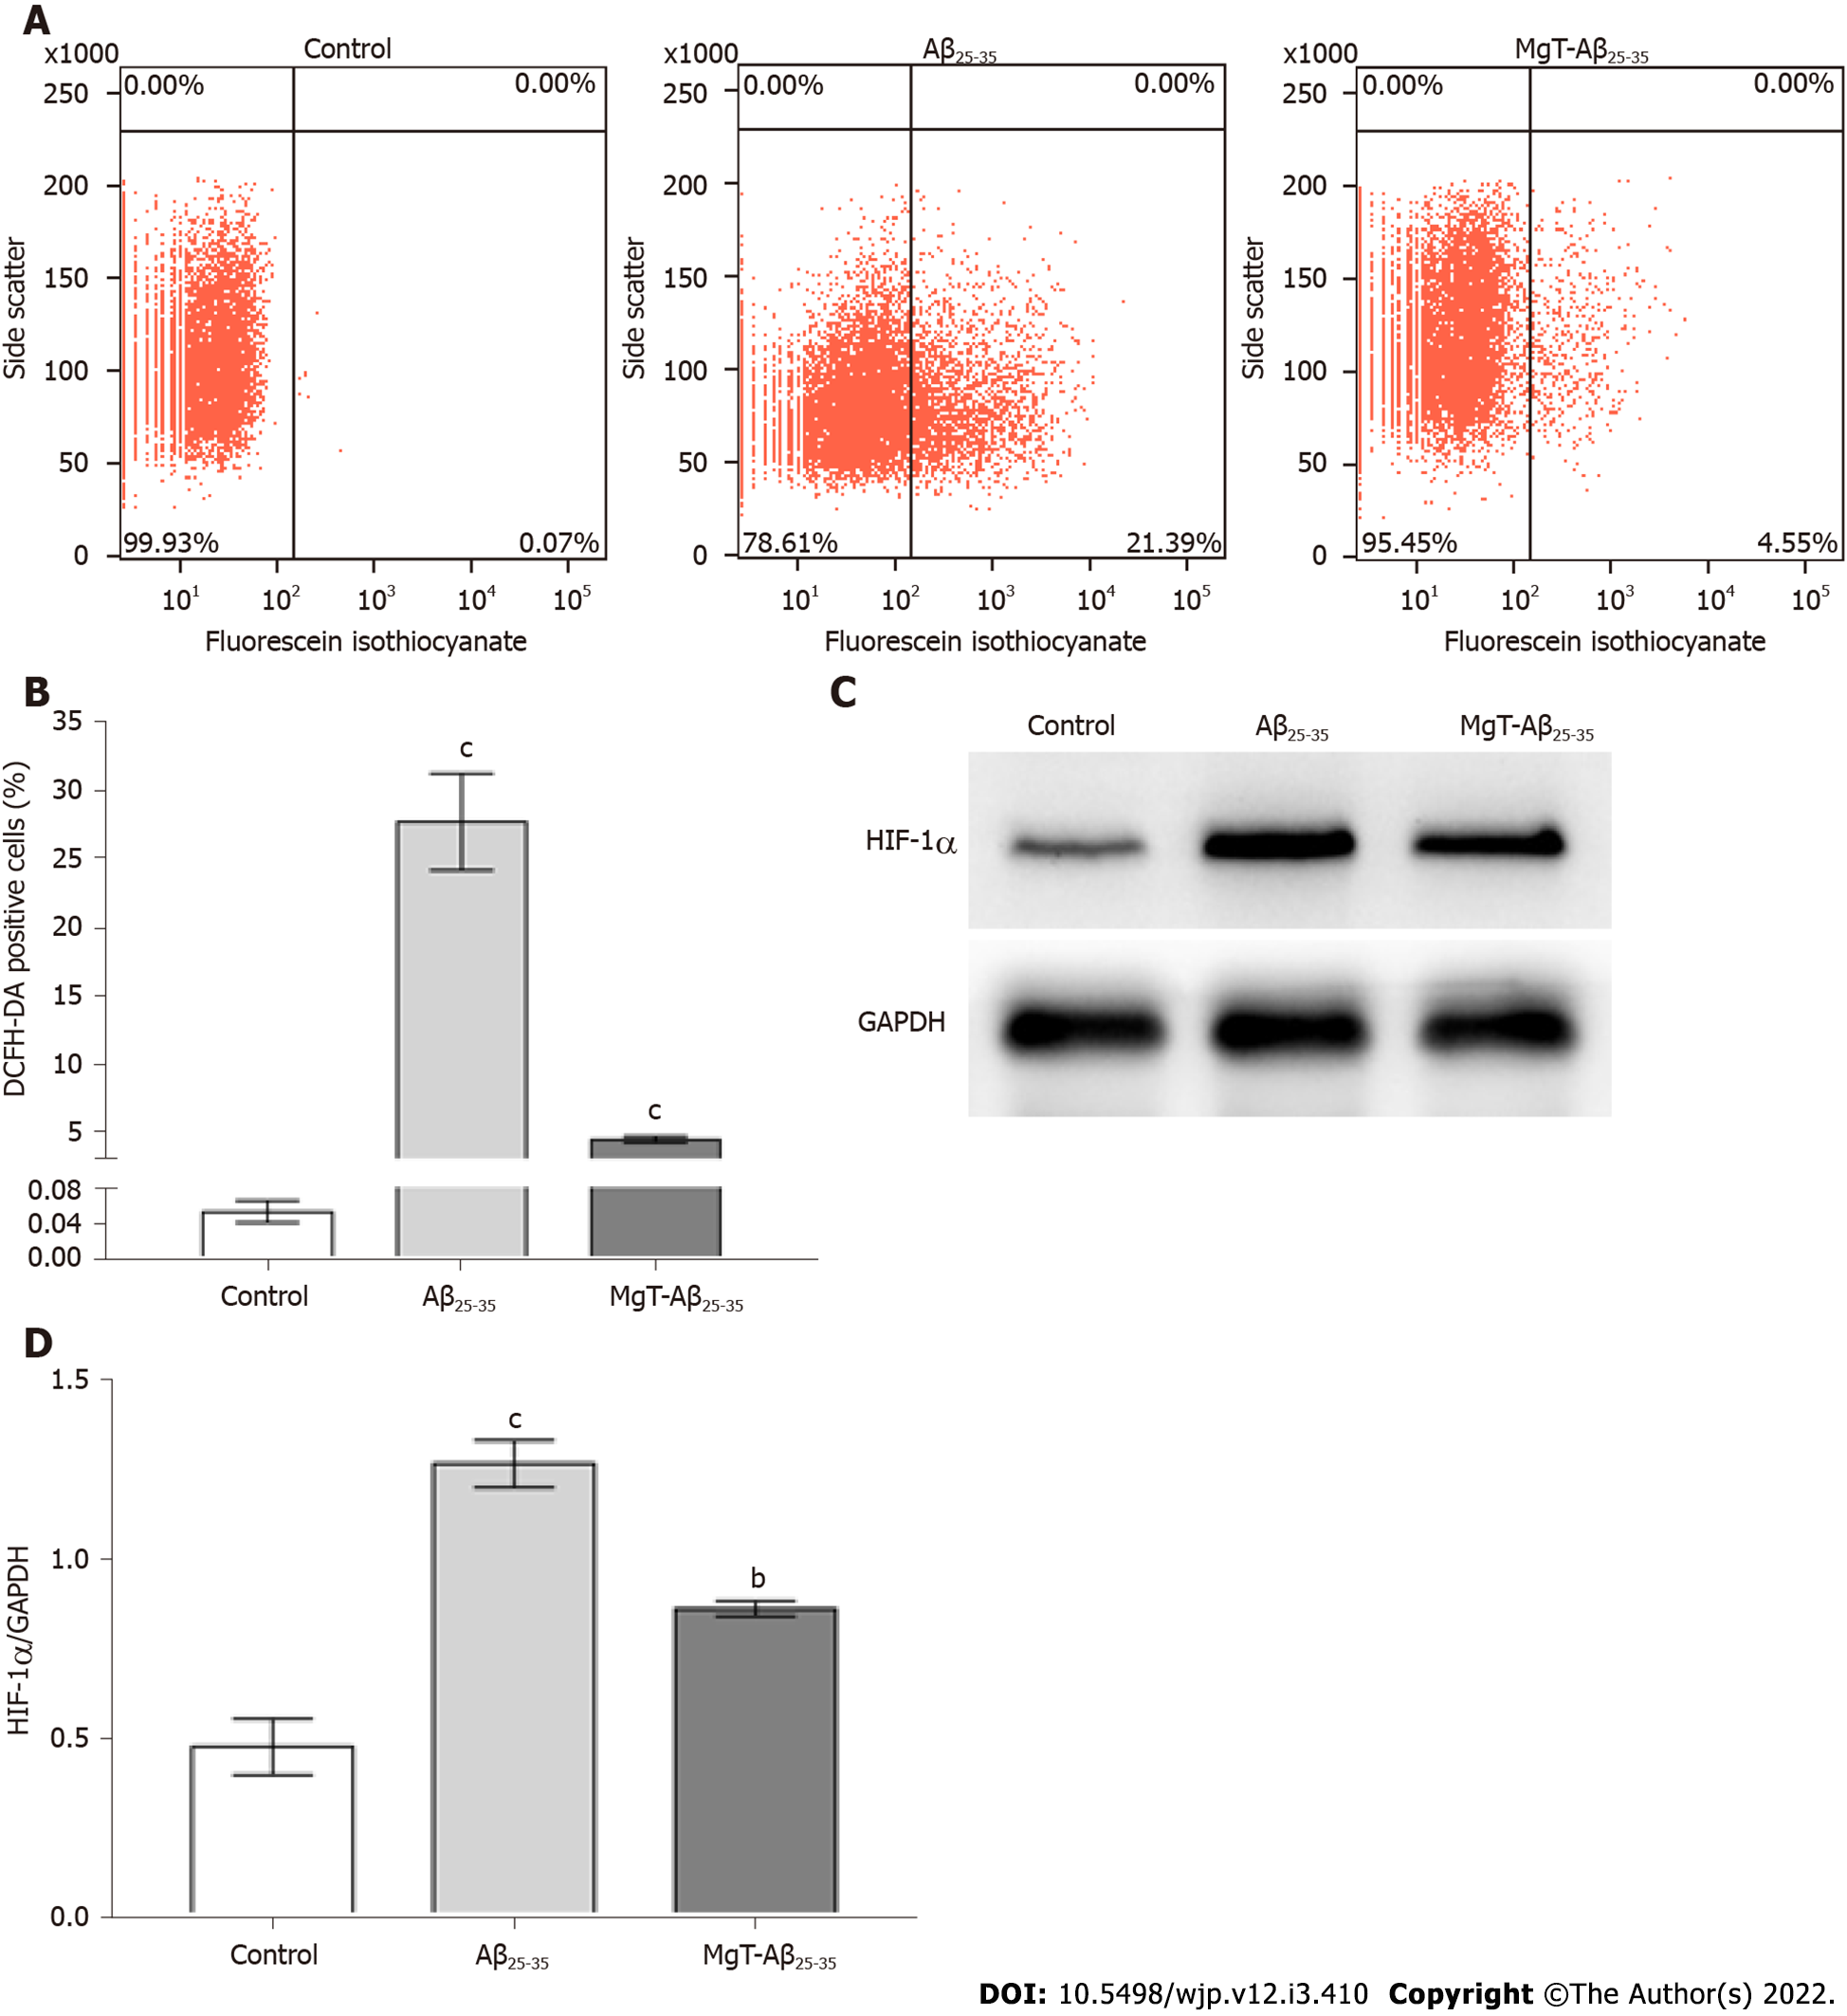
Figure 2 Magnesium-L-threonate treatment suppressed the elevated reactive oxygen species level and hypoxia-inducible factor-1α protein expression in the amyloid β25-35-exposed HT22 cells.
A, B: The percentages of dichloro-dihydro-fluorescein diacetate positive cells of each group; C: Protein band images of hypoxia-inducible factor (HIF)-1α and glyceraldehyde-3-phosphate dehydrogenase of each group; D: The HIF-1α protein expression level of each group. n = 3. aP < 0.05, bP < 0.01, cP < 0.001 vs former group. Aβ: Amyloid β; MgT: Magnesium-L-threonate; HIF: hypoxia-inducible factor; DCFH-DA: dichloro-dihydro-fluorescein diacetate; GAPDH: glyceraldehyde-3-phosphate dehydrogenase.
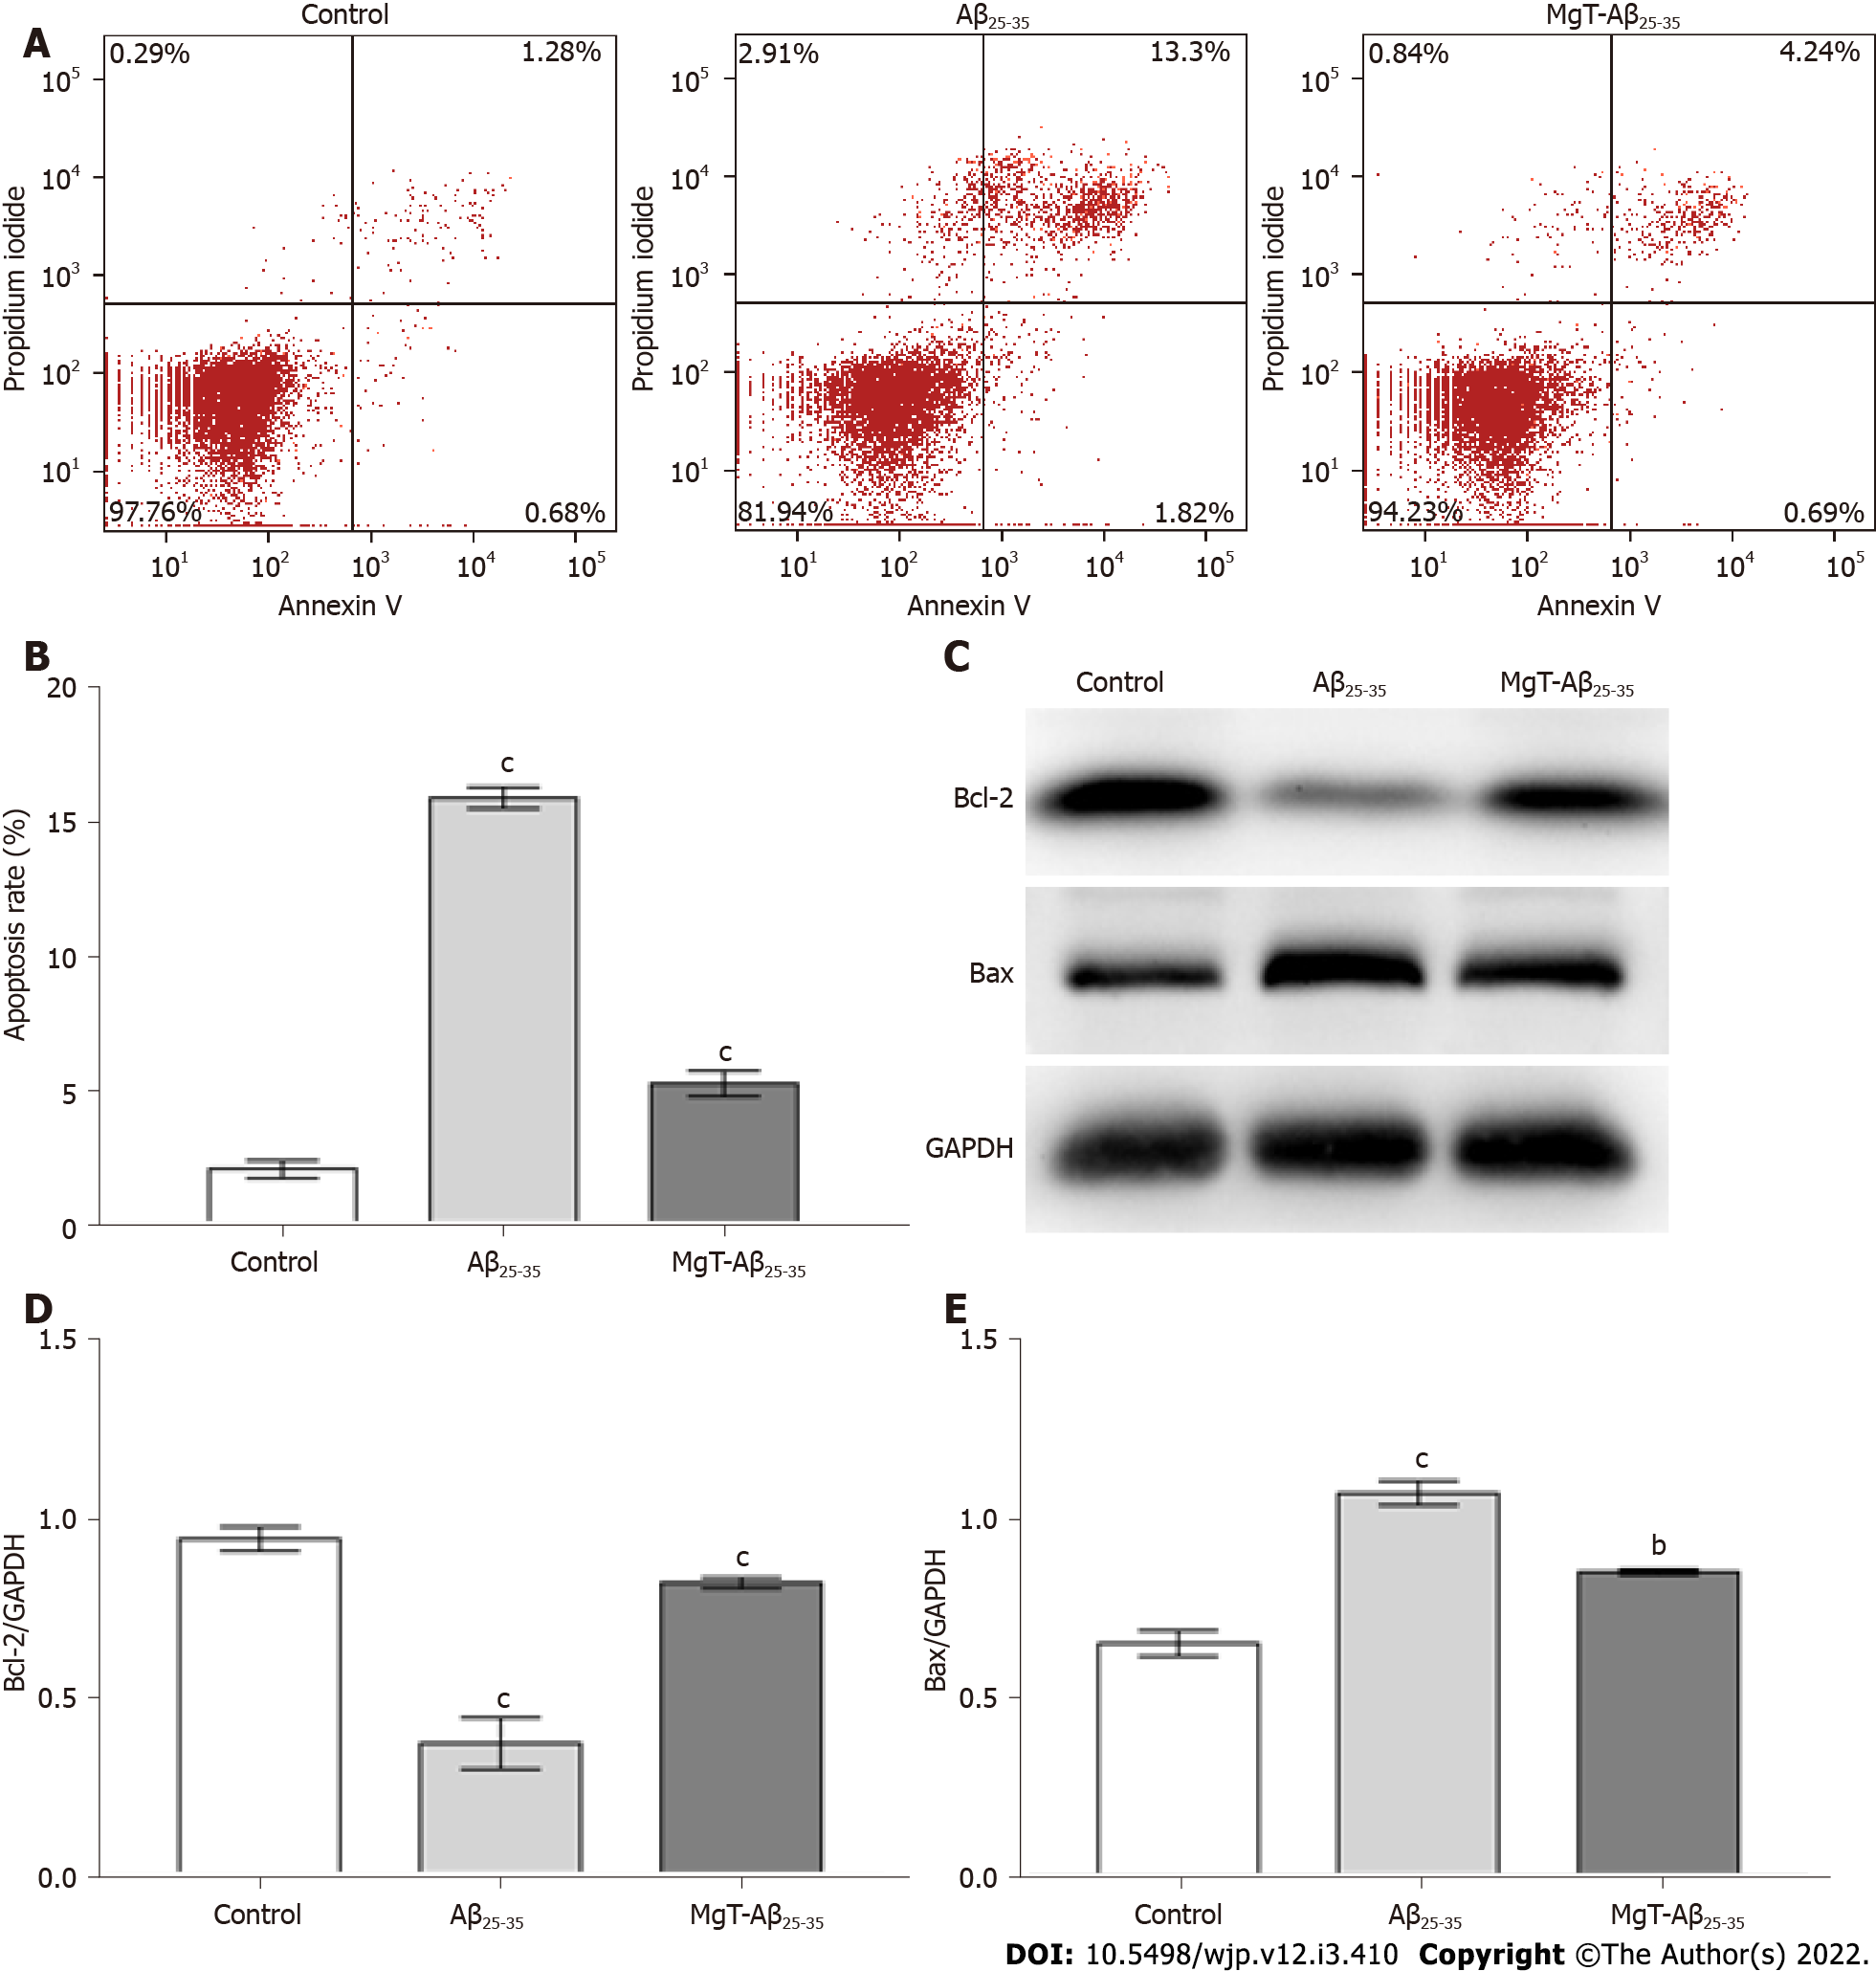
Figure 3 Magnesium-L-threonate administration prevented the apoptosis and regulated the apoptotic-associated proteins expression in the amyloid β25-35-administrated HT22 cells.
A, B: The apoptosis rate of each group; C: Protein band images of B-cell lymphoma 2 (Bcl-2), Bcl-2-associated X (Bax) and glyceraldehyde-3-phosphate dehydrogenase in each group; D: The Bcl-2 protein expression level of each group; E: The Bax protein expression level of each group. n = 3. aP < 0.05, bP < 0.01, cP < 0.001 vs former group. Aβ: Amyloid β; MgT: Magnesium-L-threonate; Bcl-2: B-cell lymphoma 2; Bax: Bcl-2-associated X; GAPDH: glyceraldehyde-3-phosphate dehydrogenase.
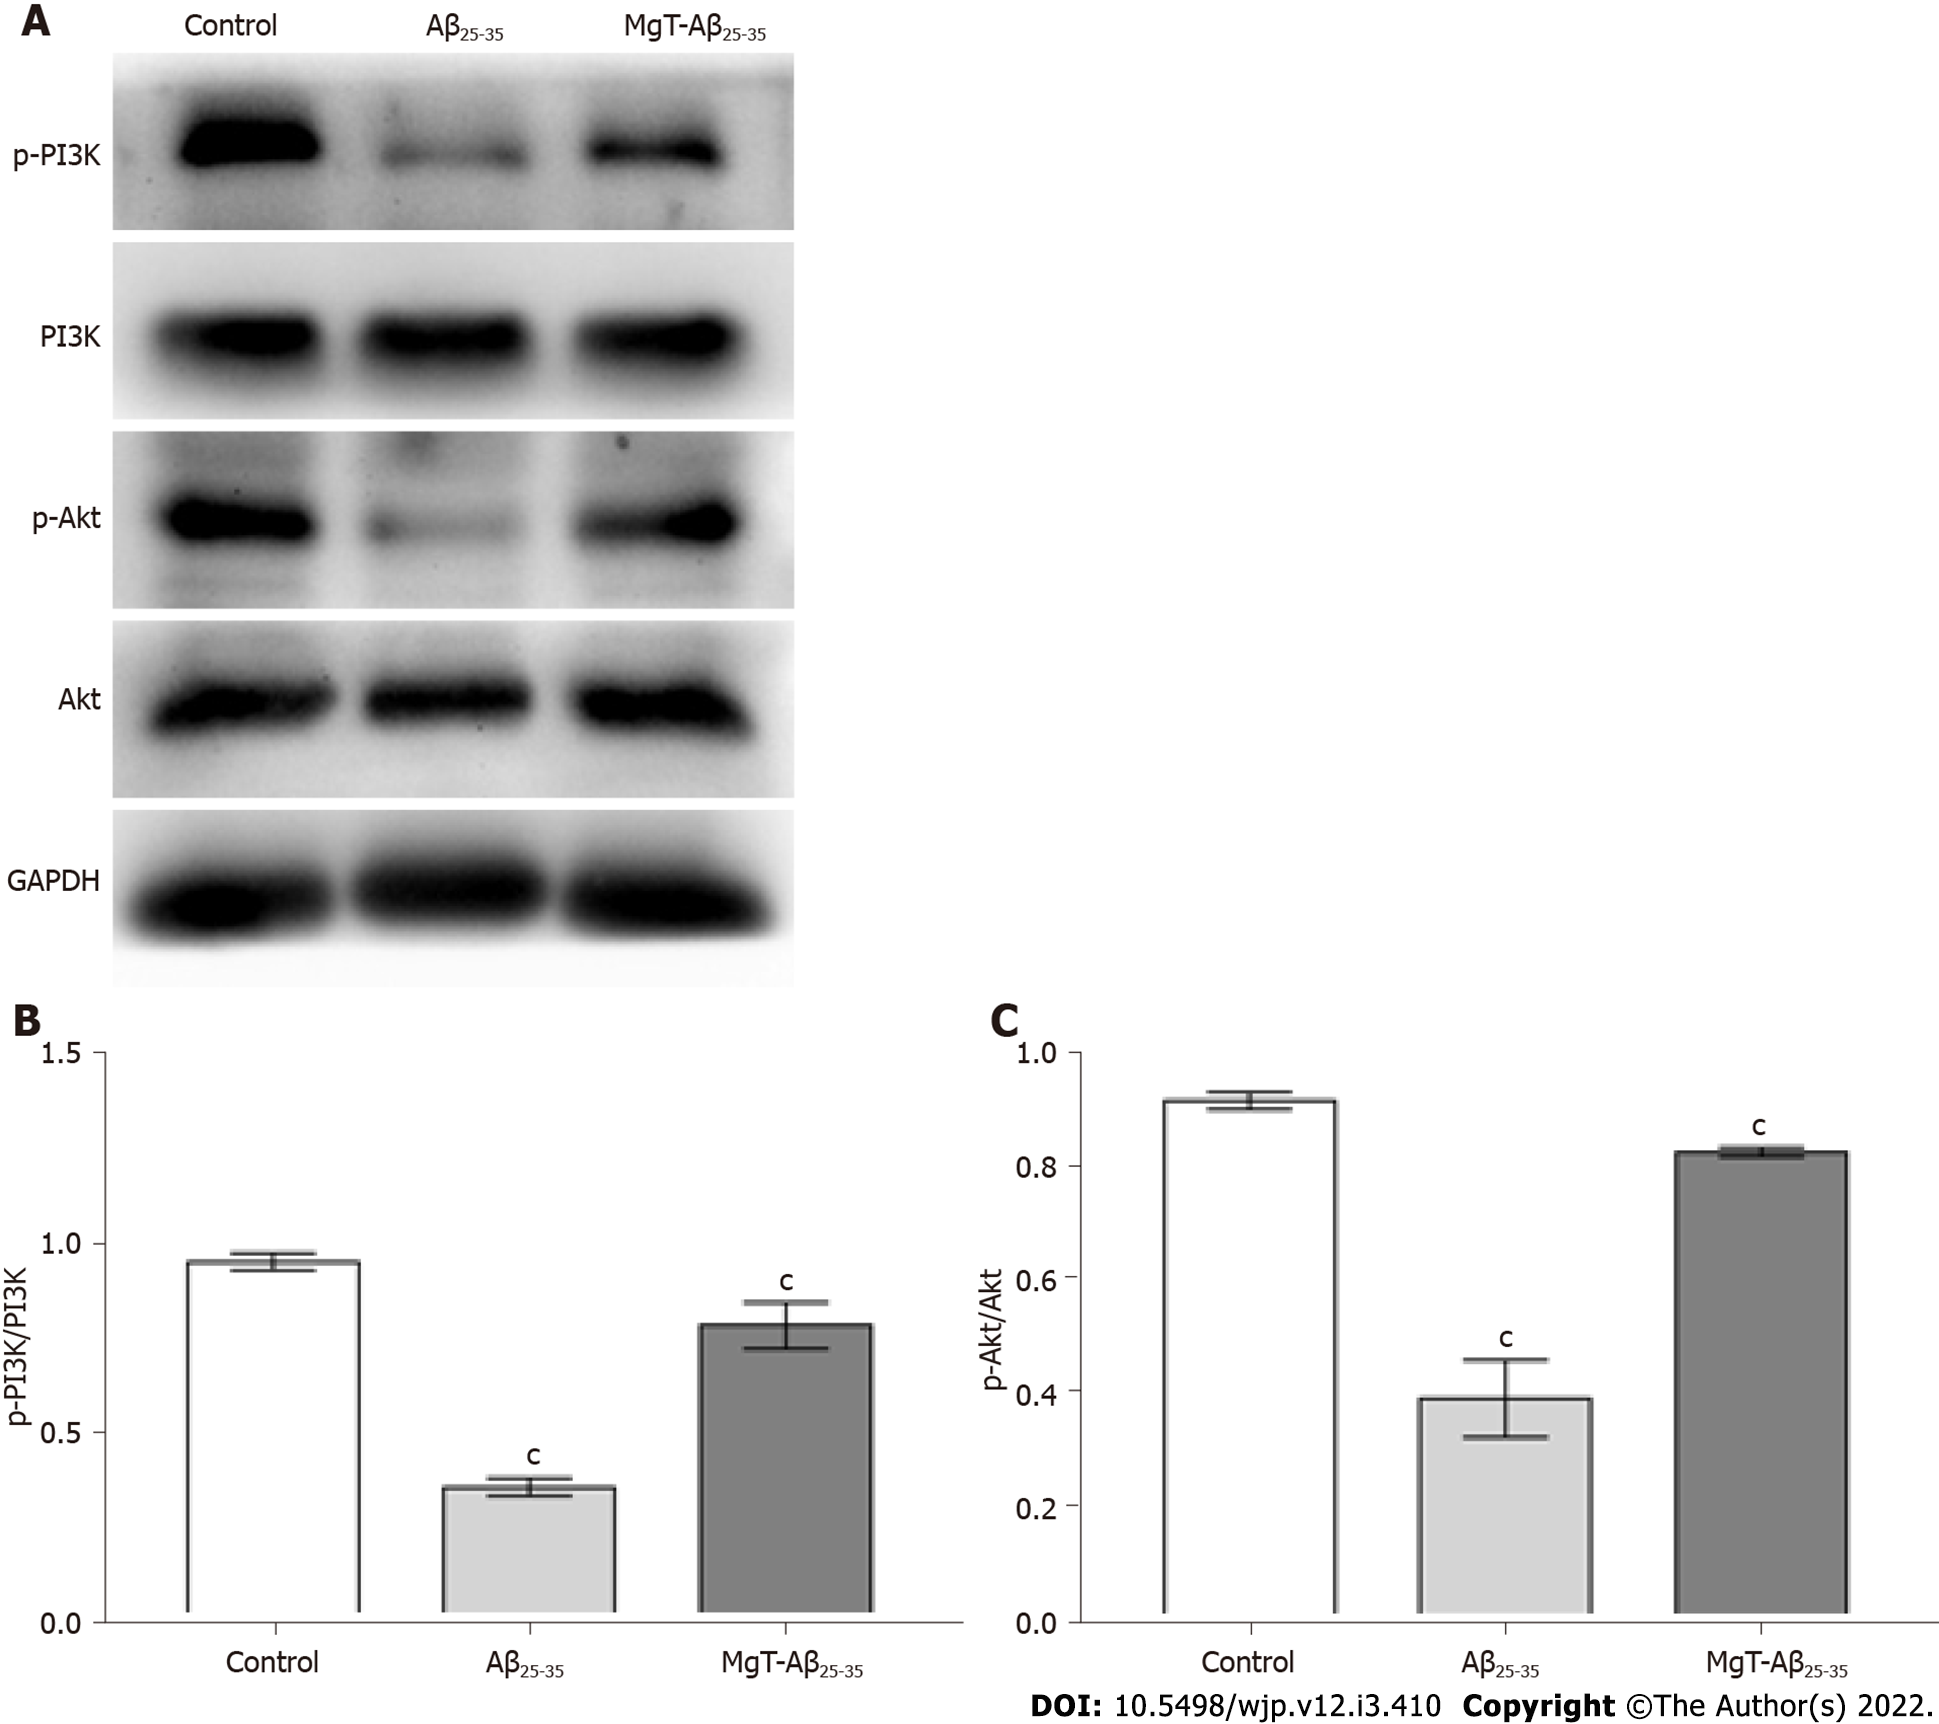
Figure 4 Magnesium-L-threonate treatment suppressed the downregulation of phosphatidylinositol-3-kinase/protein kinase B pathway in the amyloid β25-35-exposed HT22 cells.
A: Protein band images of phosphorylated (p)-phosphatidylinositol-3-kinase (PI3K), PI3K, p-protein kinase B (Akt), Akt and glyceraldehyde-3-phosphate dehydrogenase of each group; B: The p-PI3K/PI3K ratio of each group; C: The p-Akt/Akt ratio of each group. n = 3. aP < 0.05, bP < 0.01, cP < 0.001 vs former group. Aβ: Amyloid β; MgT: Magnesium-L-threonate; PI3K: phosphatidylinositol-3-kinase; Akt: protein kinase B; GAPDH: glyceraldehyde-3-phosphate dehydrogenase.
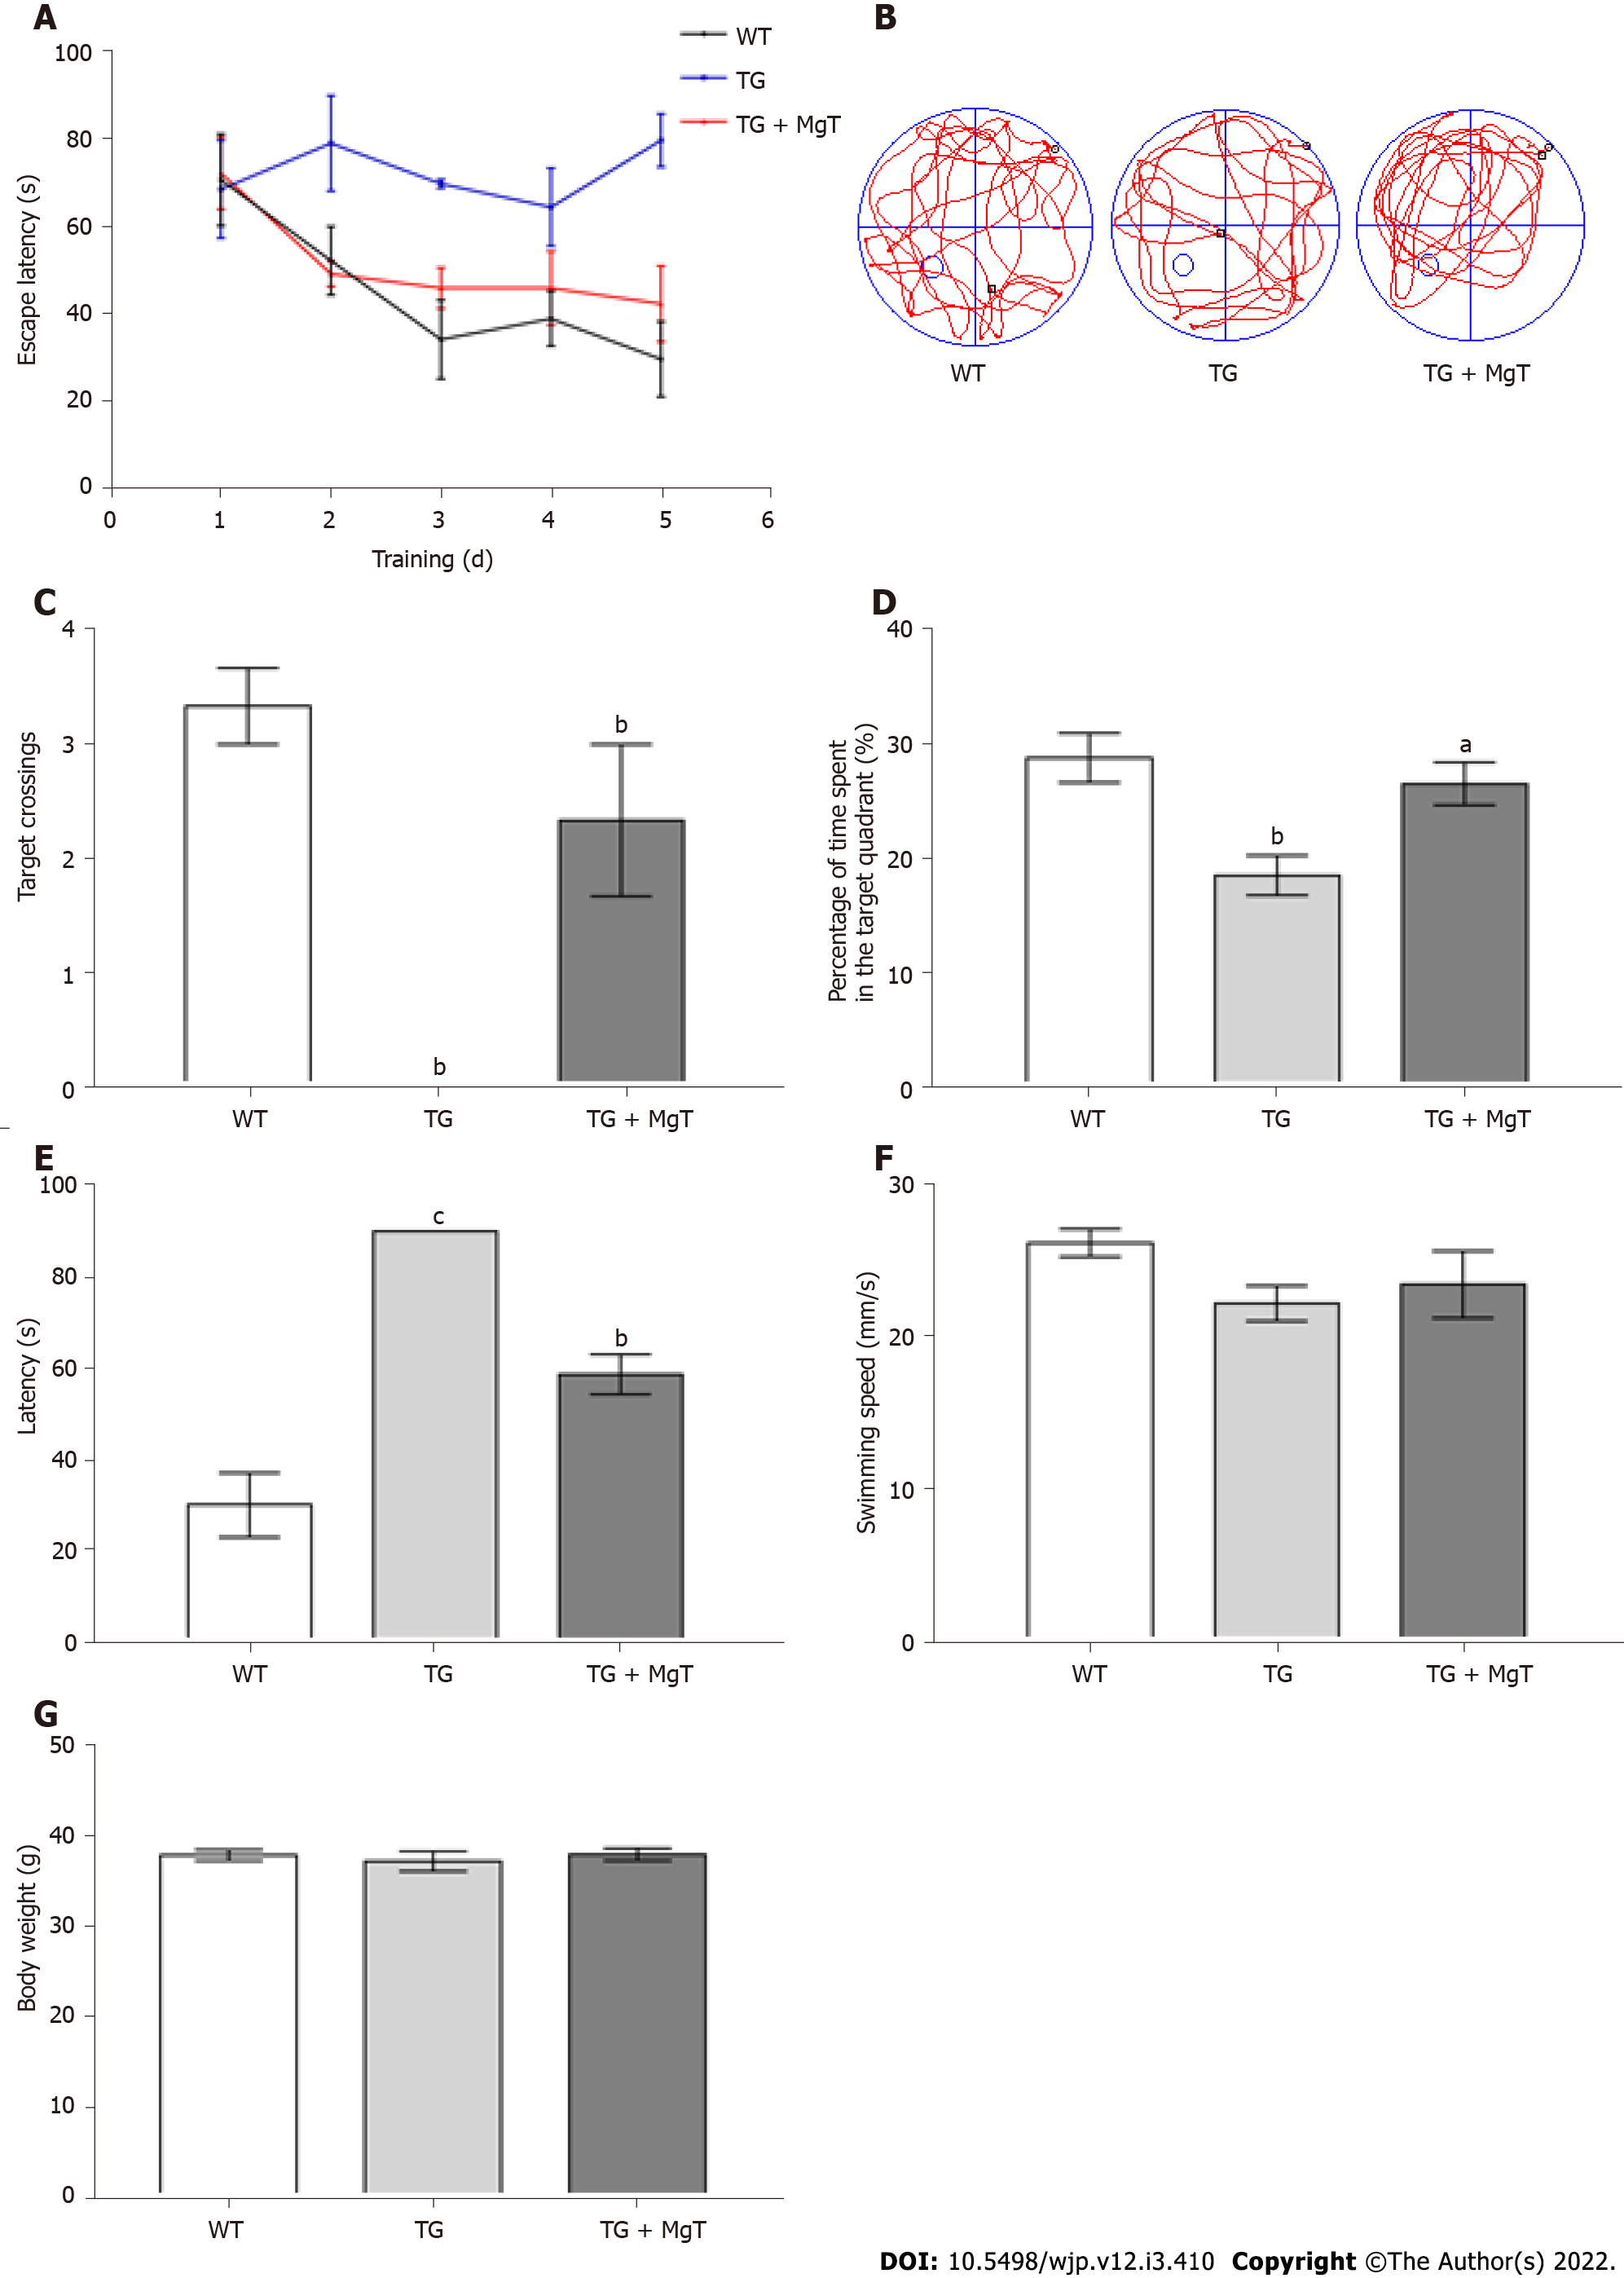
Figure 5 Magnesium-L-threonate administration prevented the memory deficit of APPswe/PS1dE9 mouse.
A: The escape latency of each group; B: The swimming track explored the removed platform of each group; C: The number of platform crossings of each group; D: The percentage of the time spent in the target quadrant of each group; E: The latency located the removed platform of each group; F: The swimming speed of each group; G: The body weight of each group. n = 3. aP < 0.05, bP < 0.01, cP < 0.001 vs former group. MgT: Magnesium-L-threonate; TG: APPswe/PS1dE9 mice group; WT: Wild-type mice group.
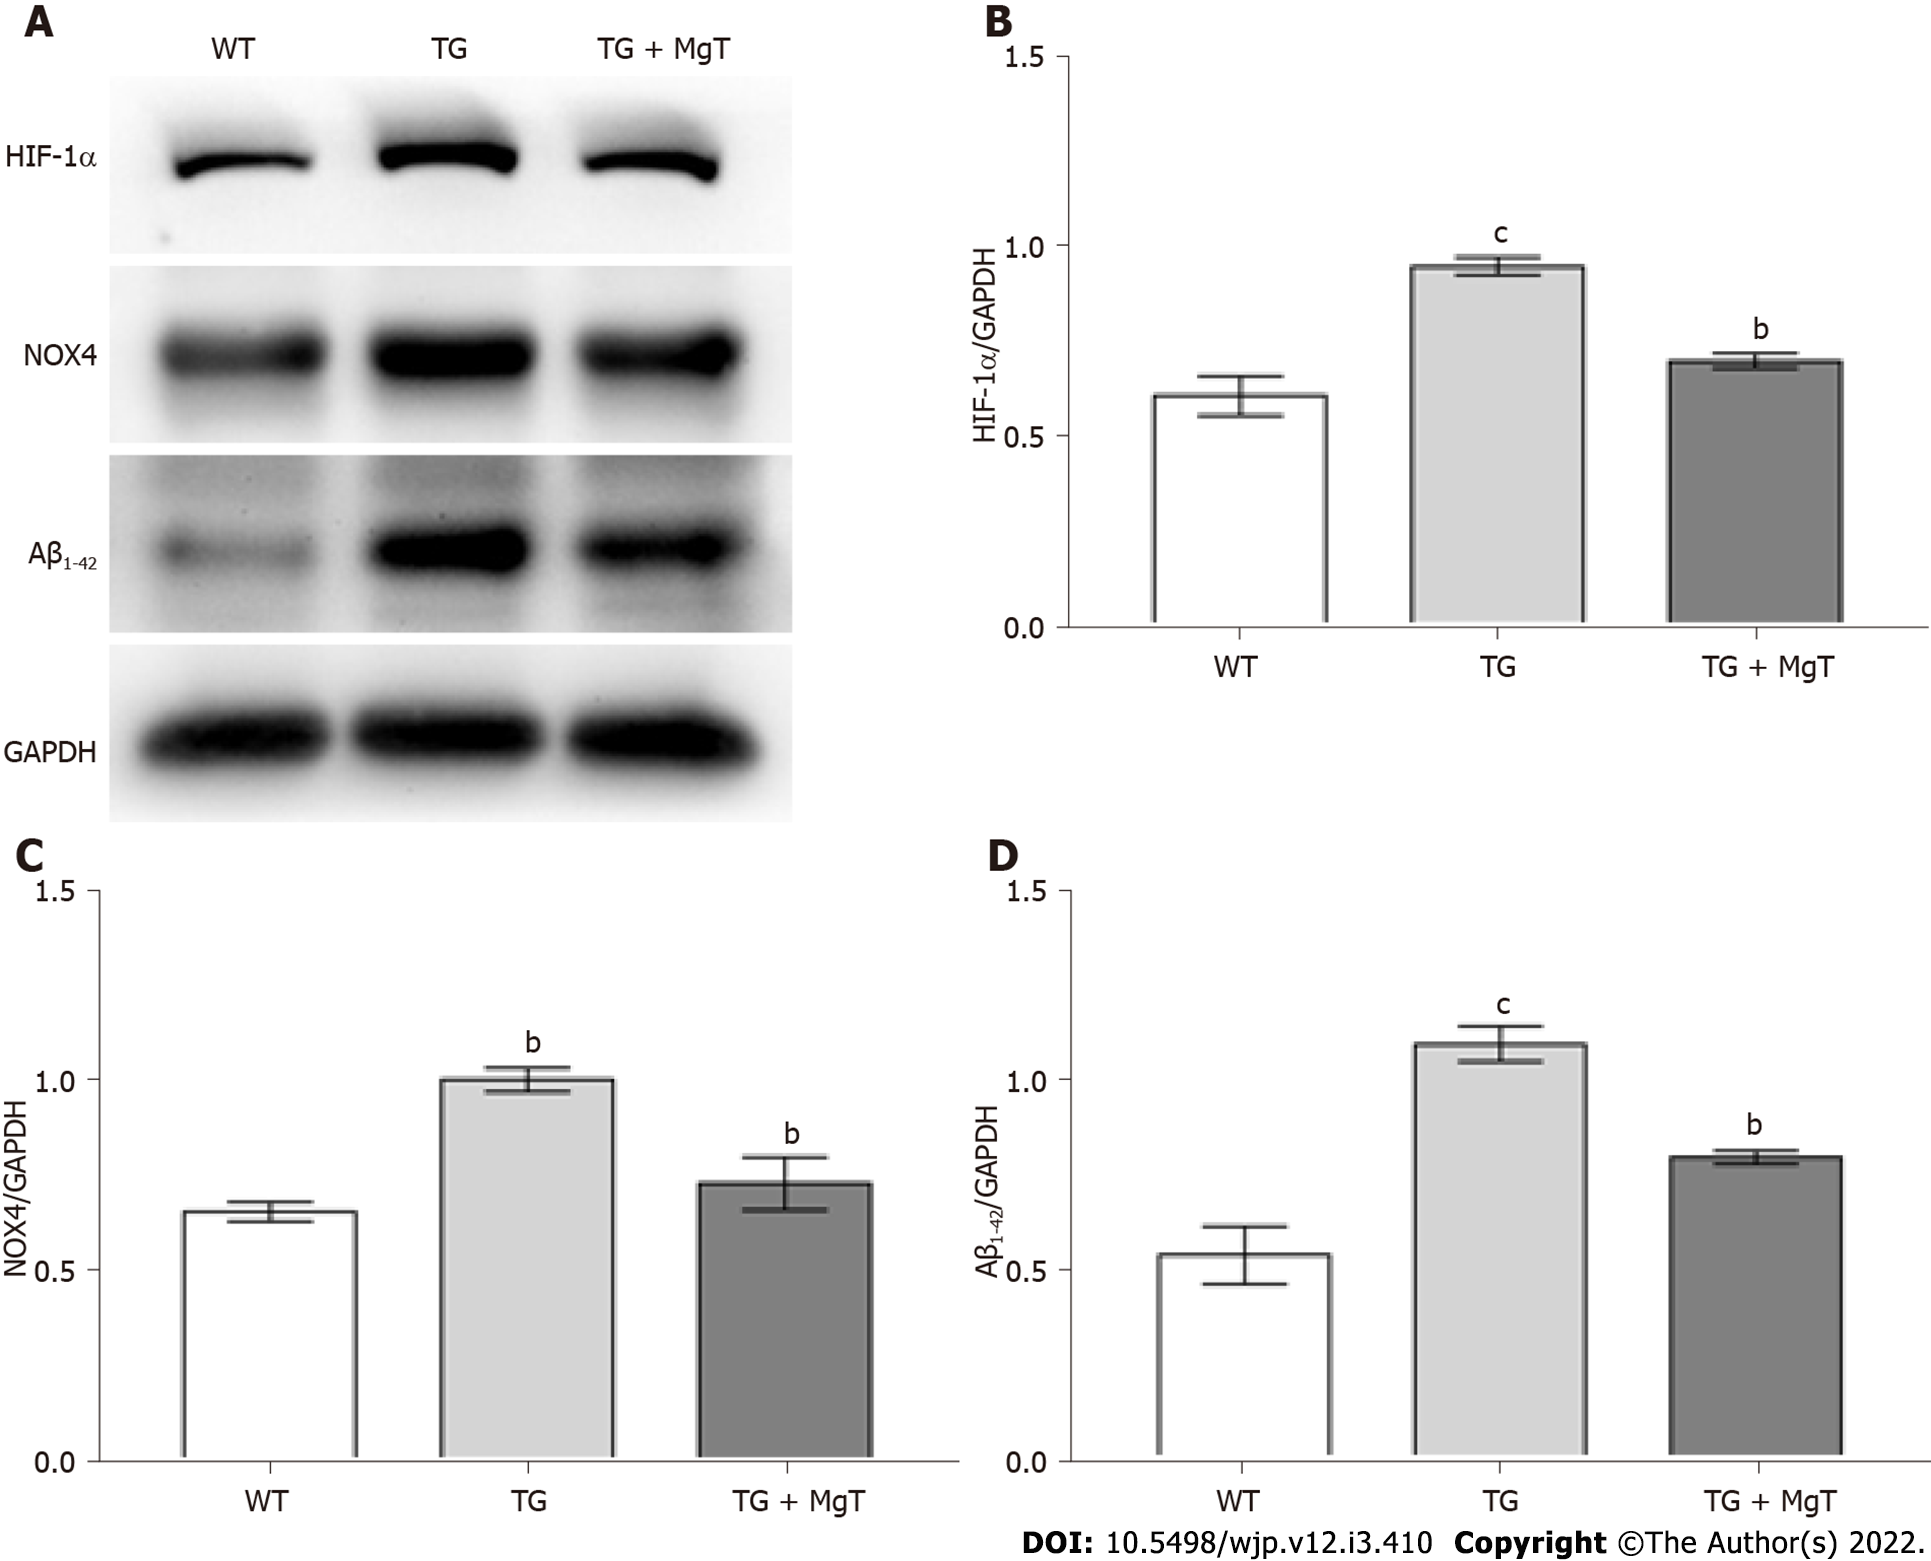
Figure 6 Magnesium-L-threonate treatment prevented the upregulation of amyloid β1-42, hypoxia-inducible factor-1α and NADPH oxidase 4 proteins in APPswe/PS1dE9 mouse hippocampus.
A: Protein band images of hypoxia-inducible factor (HIF)-1α, NADPH oxidase (NOX) 4, amyloid β (Aβ)1-42 and glyceraldehyde-3-phosphate dehydrogenase of each group; B: The HIF-1α protein expression of each group; C: The NOX4 protein expression of each group; D: The Aβ1-42 protein expression of each group. n = 3. aP < 0.05, bP < 0.01, cP < 0.001 vs former group. MgT: Magnesium-L-threonate; TG: APPswe/PS1dE9 mice group; WT: Wild-type mice group; Aβ: Amyloid β; HIF: hypoxia-inducible factor; NOX: NADPH oxidase; GAPDH: glyceraldehyde-3-phosphate dehydrogenase.
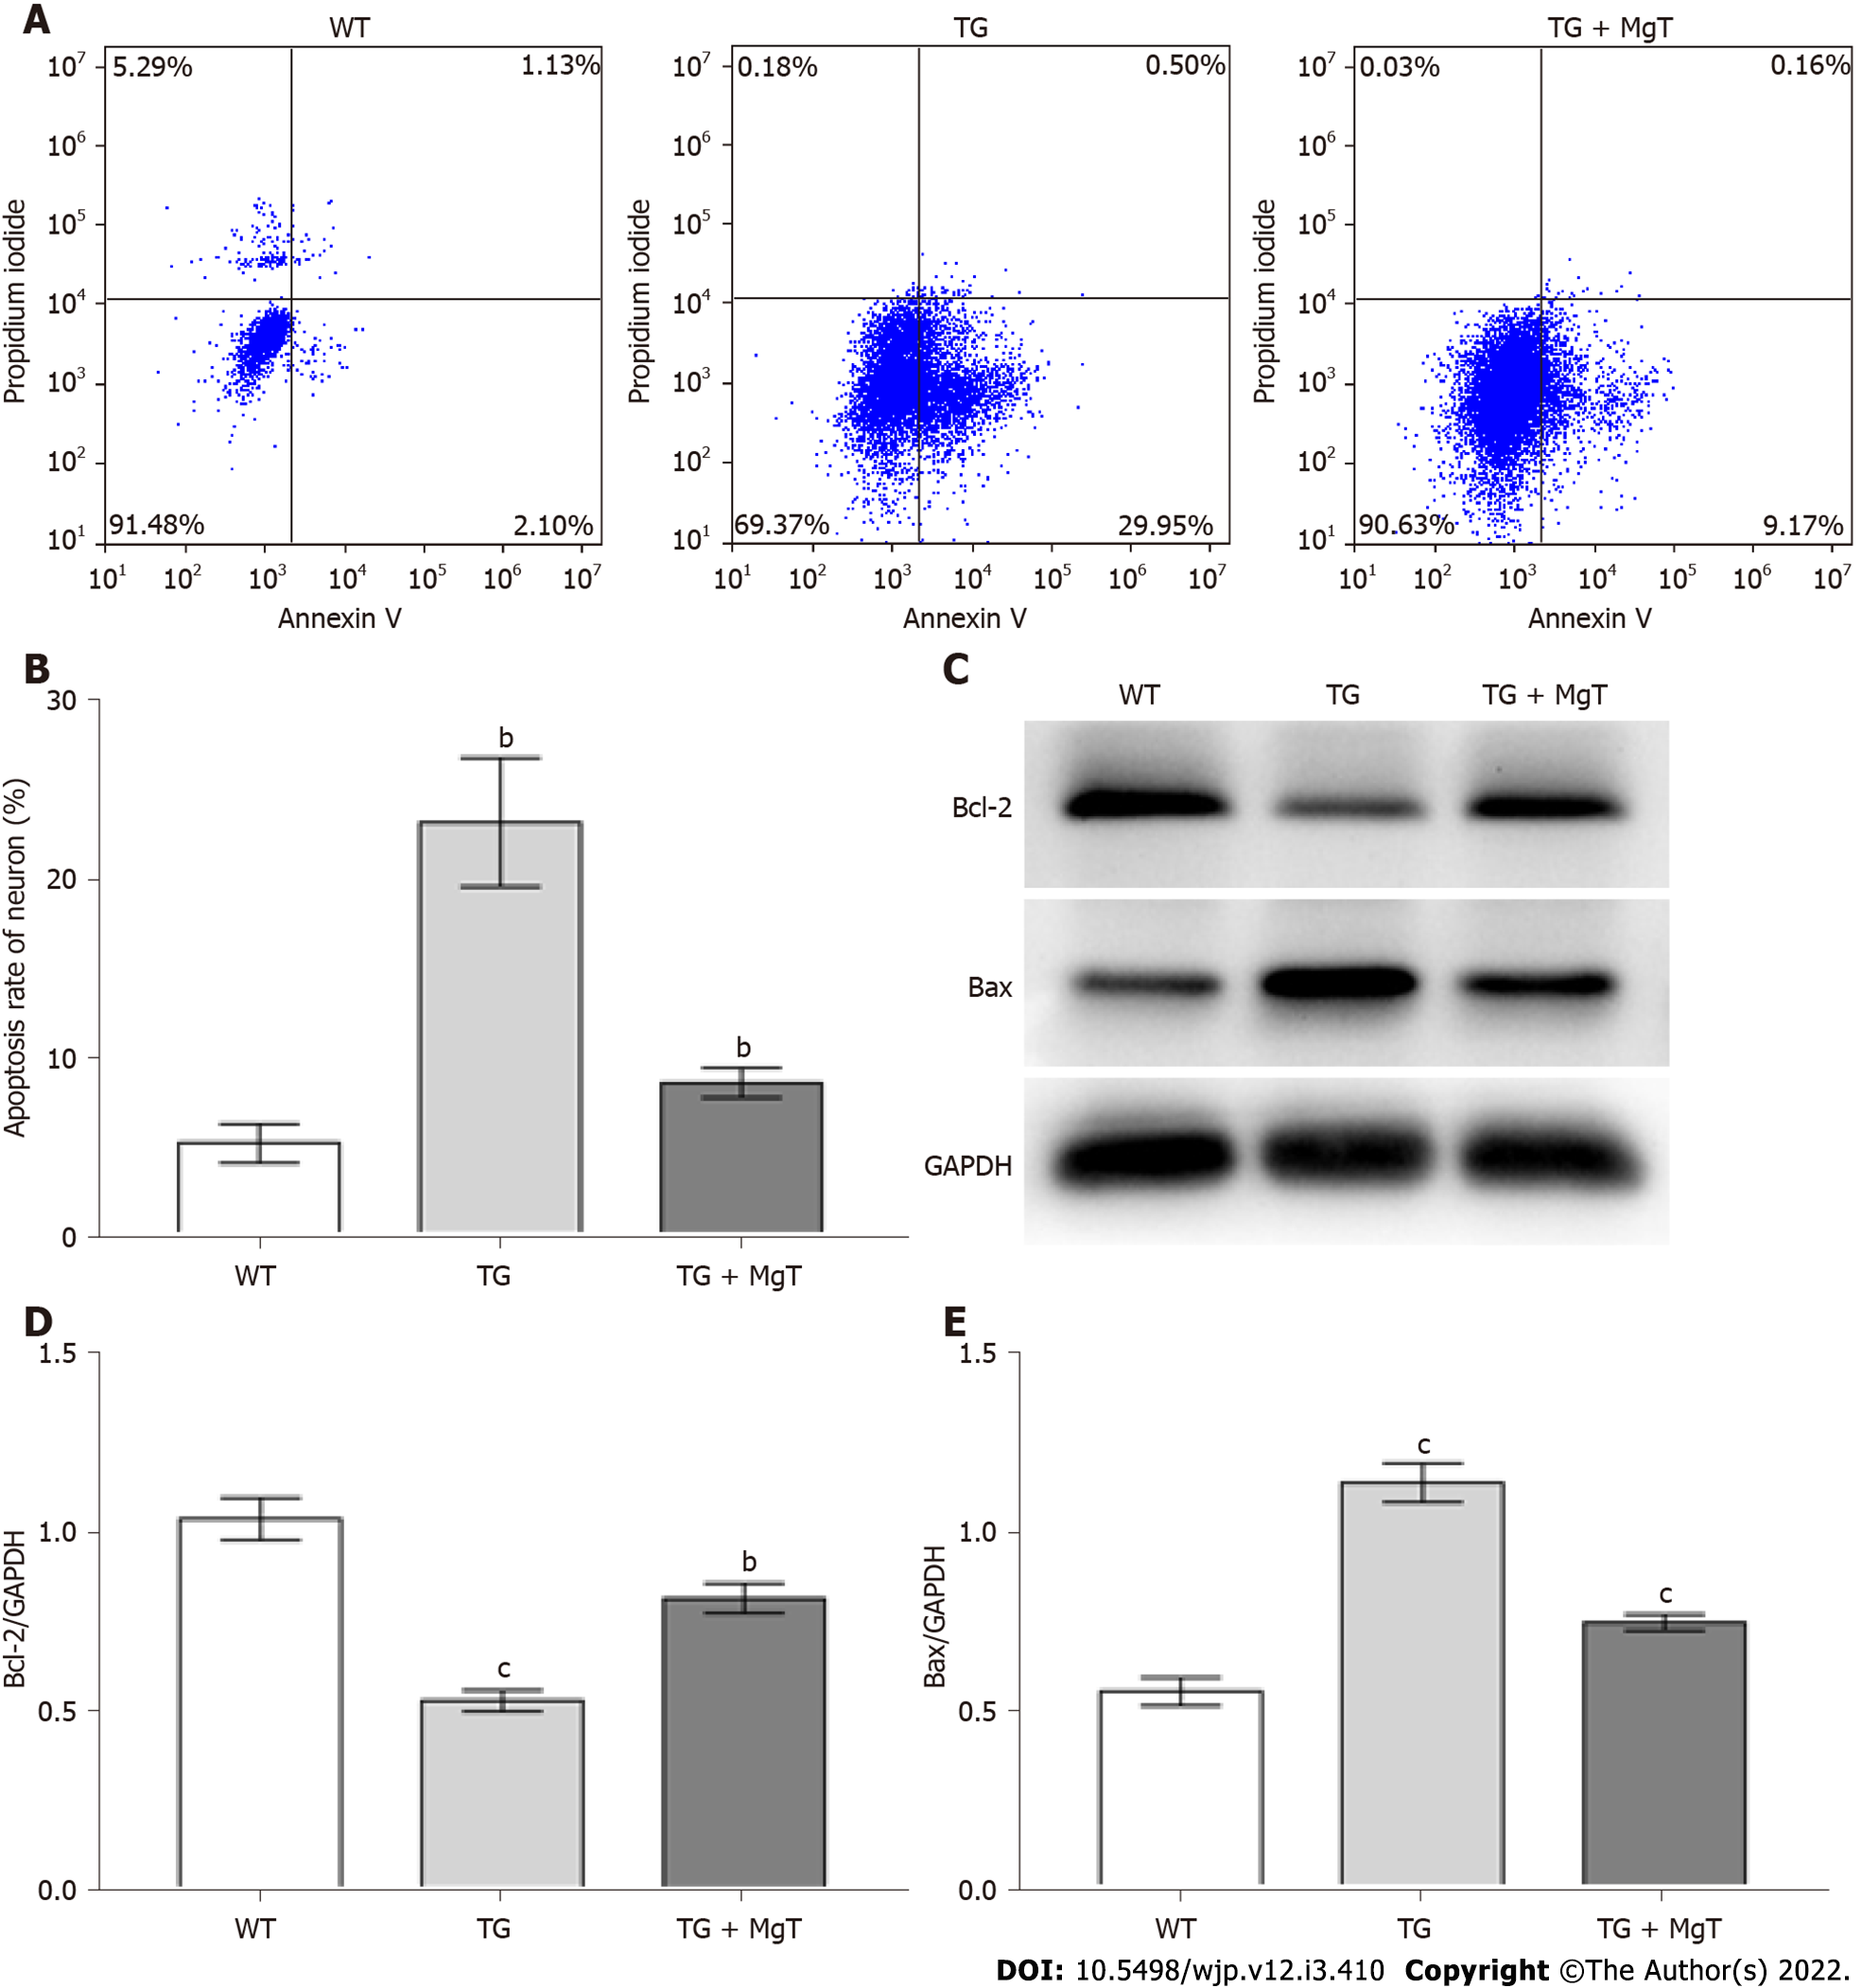
Figure 7 Magnesium-L-threonate administration regulated the neuronal apoptosis and mediated the expression of apoptotic-related proteins in APPswe/PS1dE9 mouse hippocampus.
A, B: The apoptosis rate of hippocampal neuron of each group; C: Protein band images of B-cell lymphoma 2 (Bcl-2), Bcl-2-associated X (Bax) and glyceraldehyde-3-phosphate dehydrogenase of each group; D: The Bcl-2 protein expression level of each group; E: The Bax protein expression level of each group. n = 3. aP < 0.05, bP < 0.01, cP < 0.001 vs former group. MgT: Magnesium-L-threonate; TG: APPswe/PS1dE9 mice group; WT: Wild-type mice group; Bcl-2: B-cell lymphoma 2; Bax: Bcl-2-associated X; GAPDH: glyceraldehyde-3-phosphate dehydrogenase.
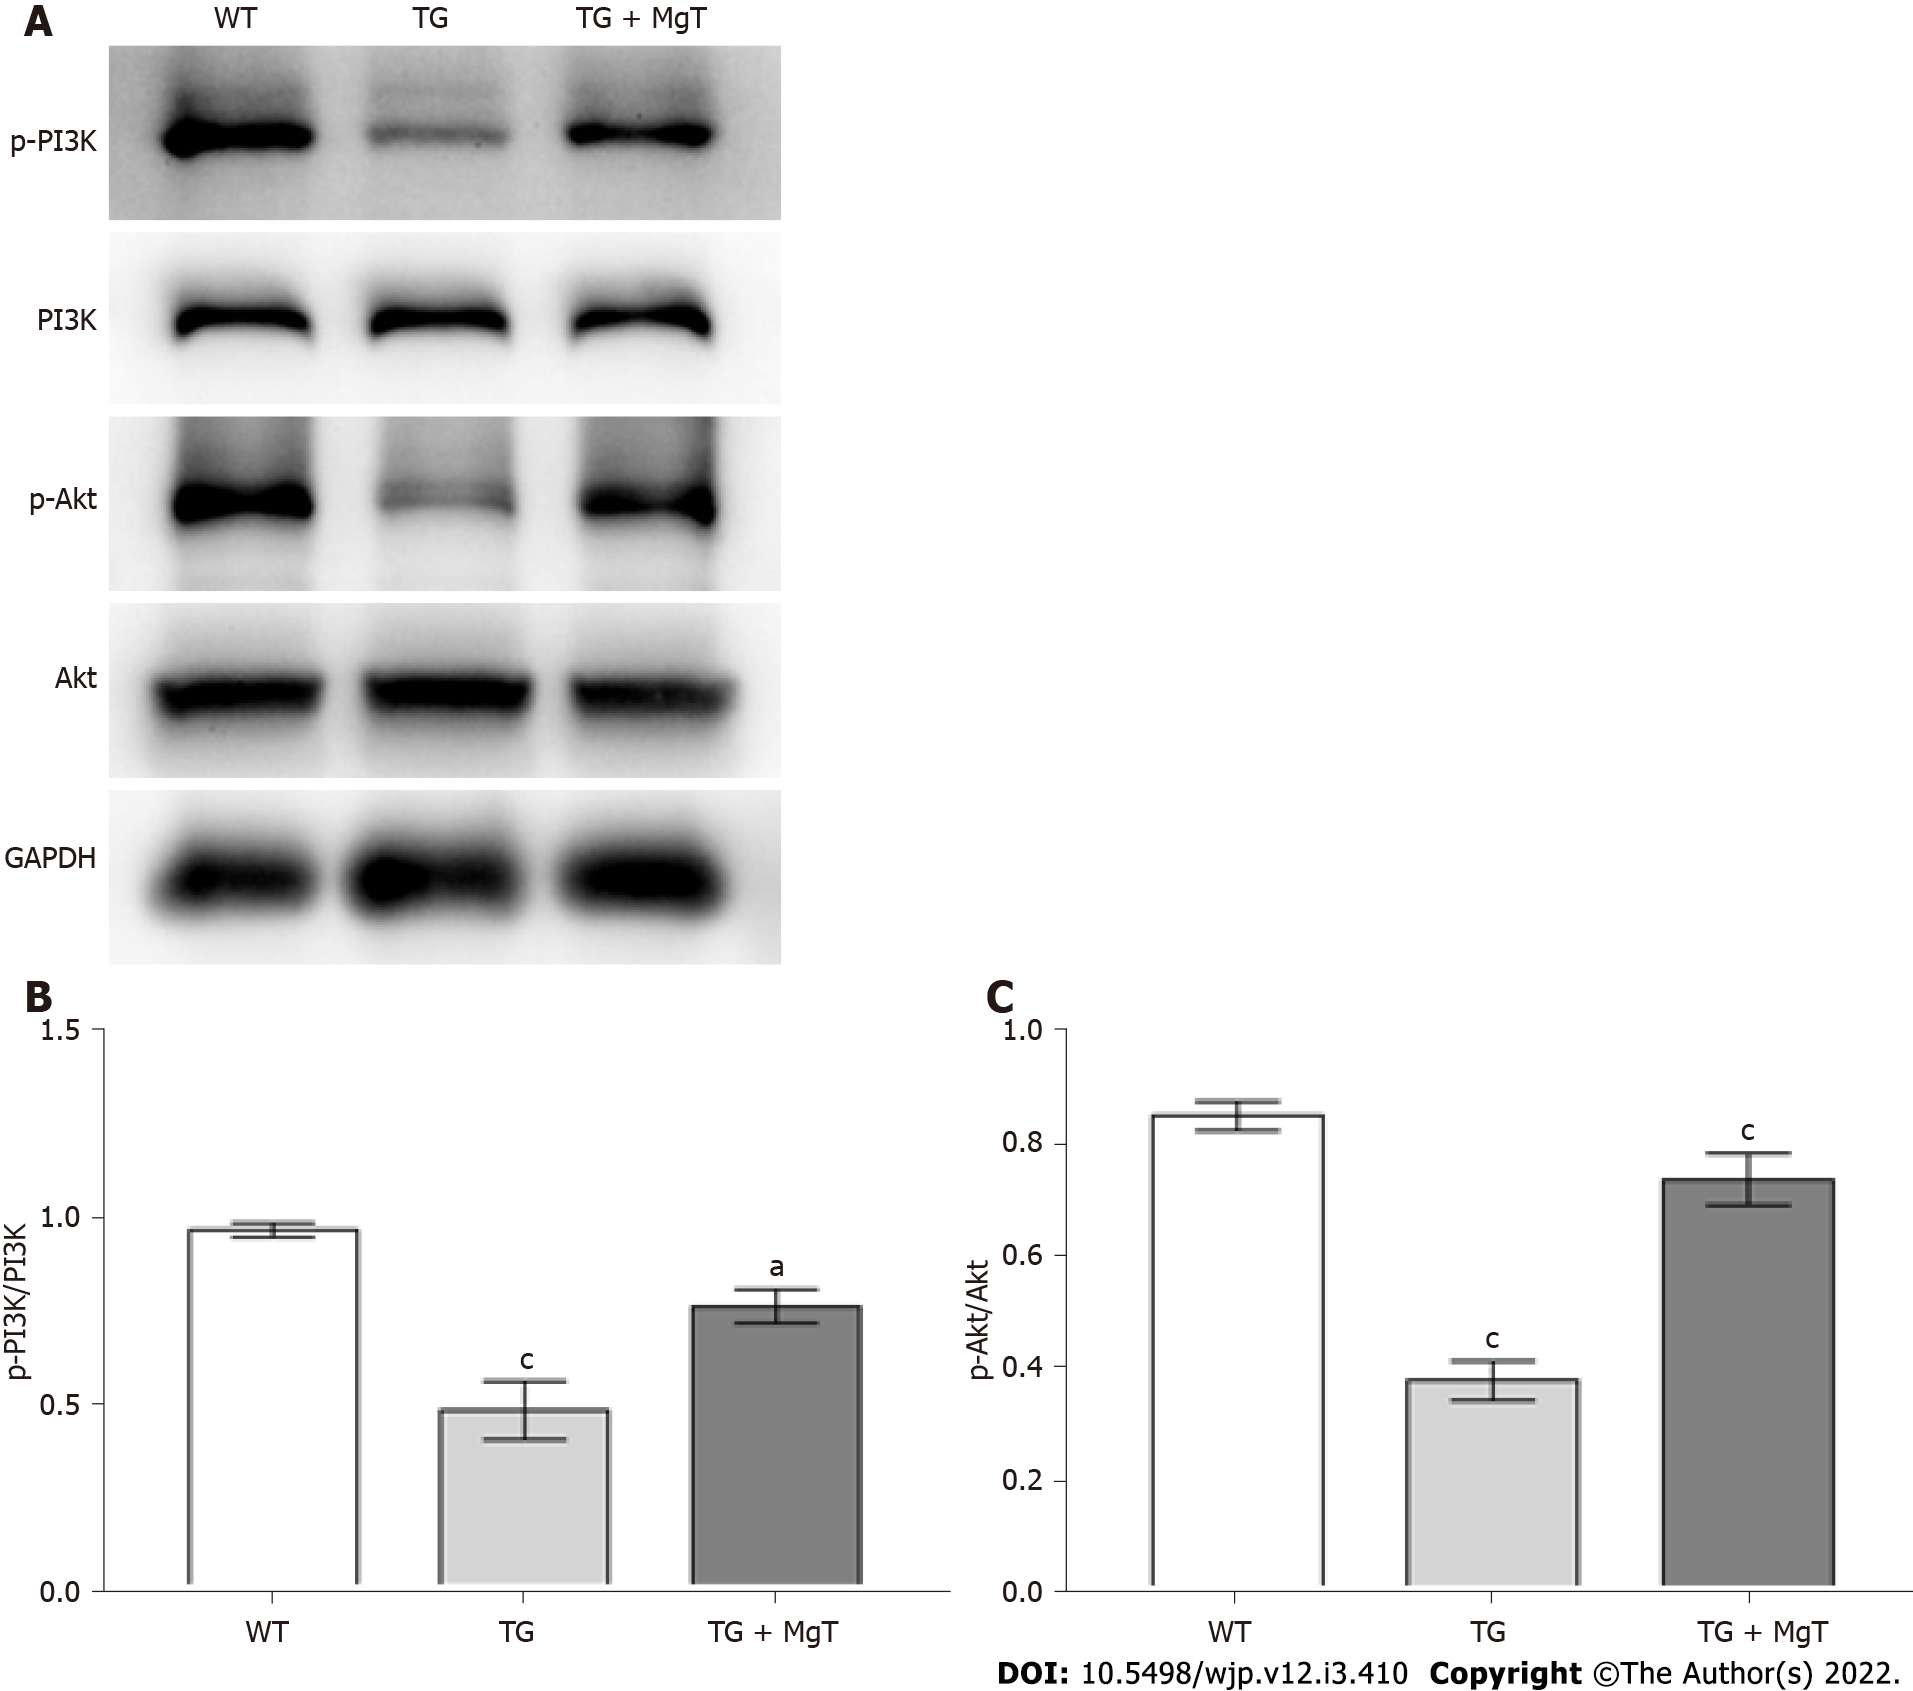
Figure 8 Magnesium-L-threonate treatment activated the phosphatidylinositol-3-kinase/protein kinase B pathway in APPswe/PS1dE9 mouse hippocampus.
A: Protein band images of phosphorylated (p)-phosphatidylinositol-3-kinase (PI3K), PI3K, p-protein kinase B (Akt), Akt and glyceraldehyde-3-phosphate dehydrogenase of each group; B: The p-PI3K/PI3K ratio of each group; C: The p-Akt/Akt ratio of each group. n = 3. aP < 0.05, bP < 0.01, cP < 0.001 vs former group. MgT: Magnesium-L-threonate; PI3K: phosphatidylinositol-3-kinase; Akt: protein kinase B; GAPDH: glyceraldehyde-3-phosphate dehydrogenase; WT: Wild-type mice group; TG: APPswe/PS1dE9 mice group.
- Citation: Xiong Y, Ruan YT, Zhao J, Yang YW, Chen LP, Mai YR, Yu Q, Cao ZY, Liu FF, Liao W, Liu J. Magnesium-L-threonate exhibited a neuroprotective effect against oxidative stress damage in HT22 cells and Alzheimer’s disease mouse model. World J Psychiatry 2022; 12(3): 410-424
- URL: https://www.wjgnet.com/2220-3206/full/v12/i3/410.htm
- DOI: https://dx.doi.org/10.5498/wjp.v12.i3.410


