Copyright
©The Author(s) 2021.
World J Psychiatr. Nov 19, 2021; 11(11): 1147-1166
Published online Nov 19, 2021. doi: 10.5498/wjp.v11.i11.1147
Published online Nov 19, 2021. doi: 10.5498/wjp.v11.i11.1147
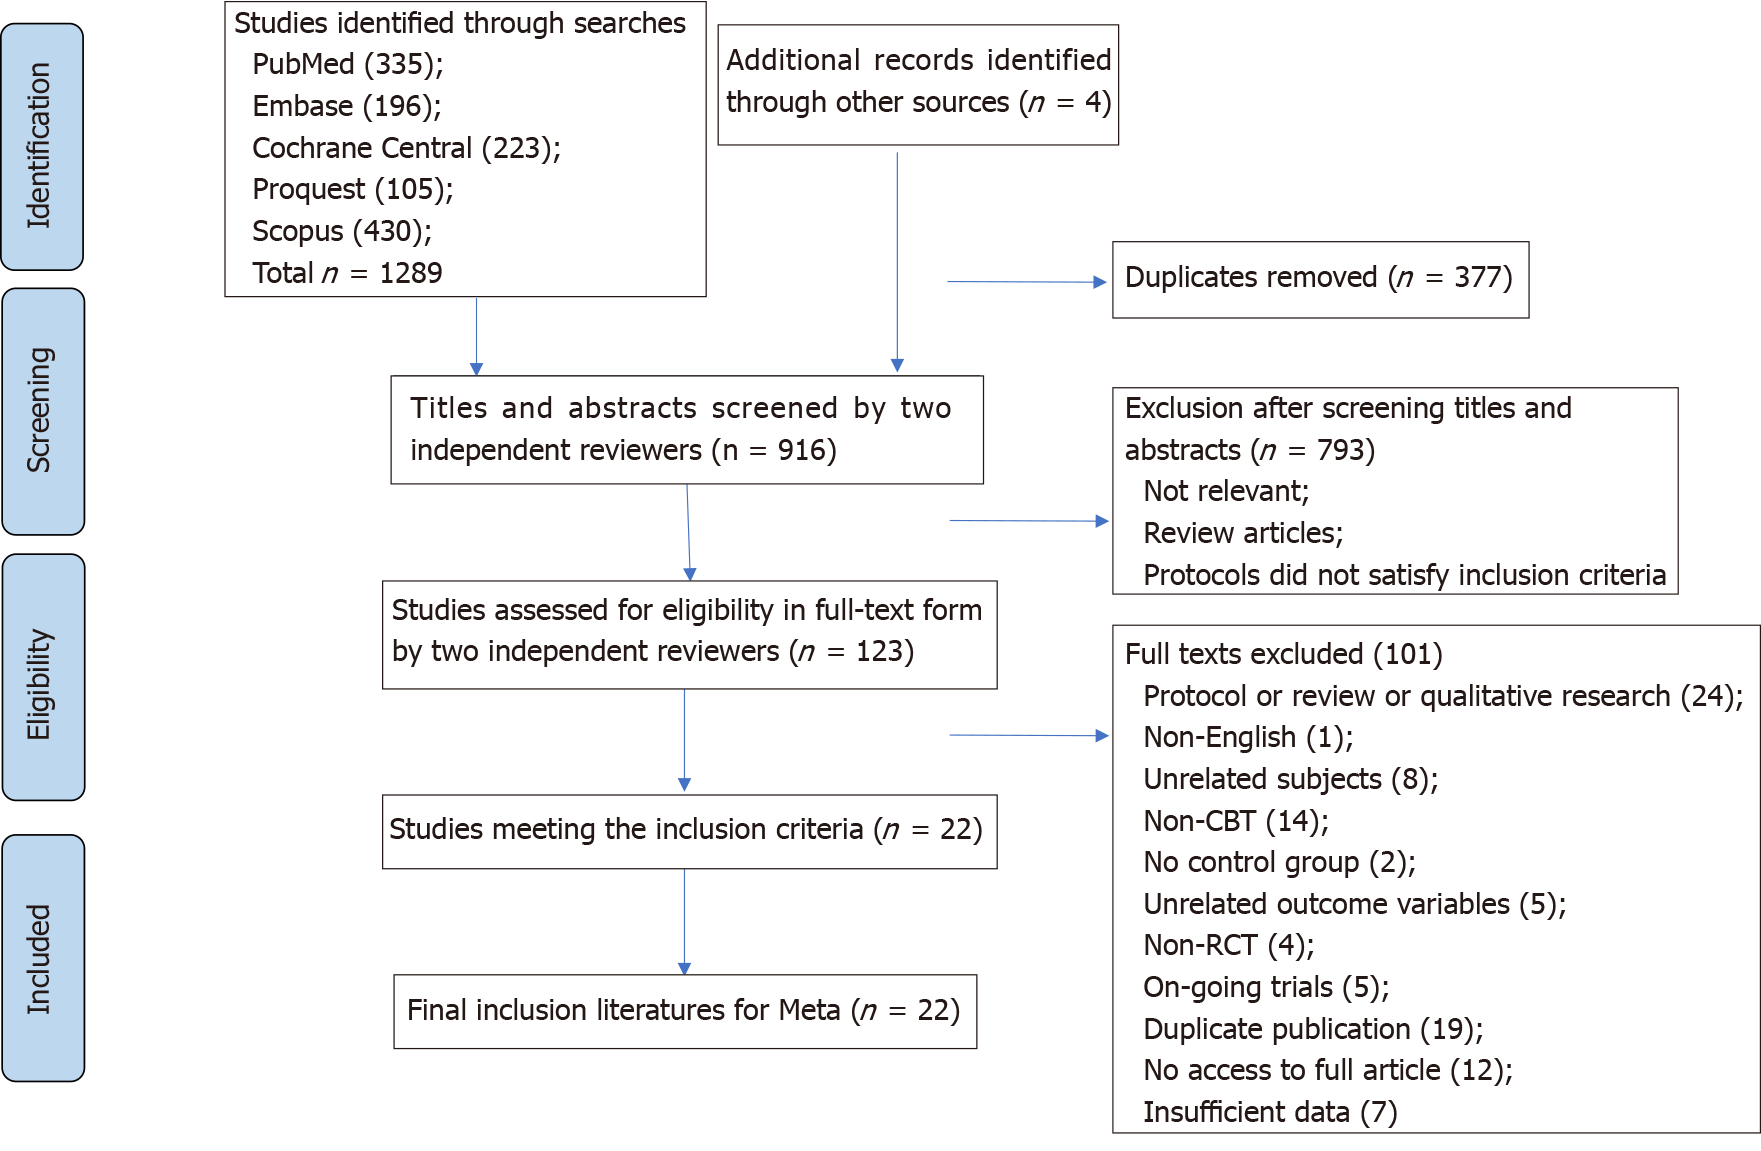
Figure 1 PRISMA flow diagram.
CBT: Cognitive behavioral therapy; RCT: Randomized controlled trial.
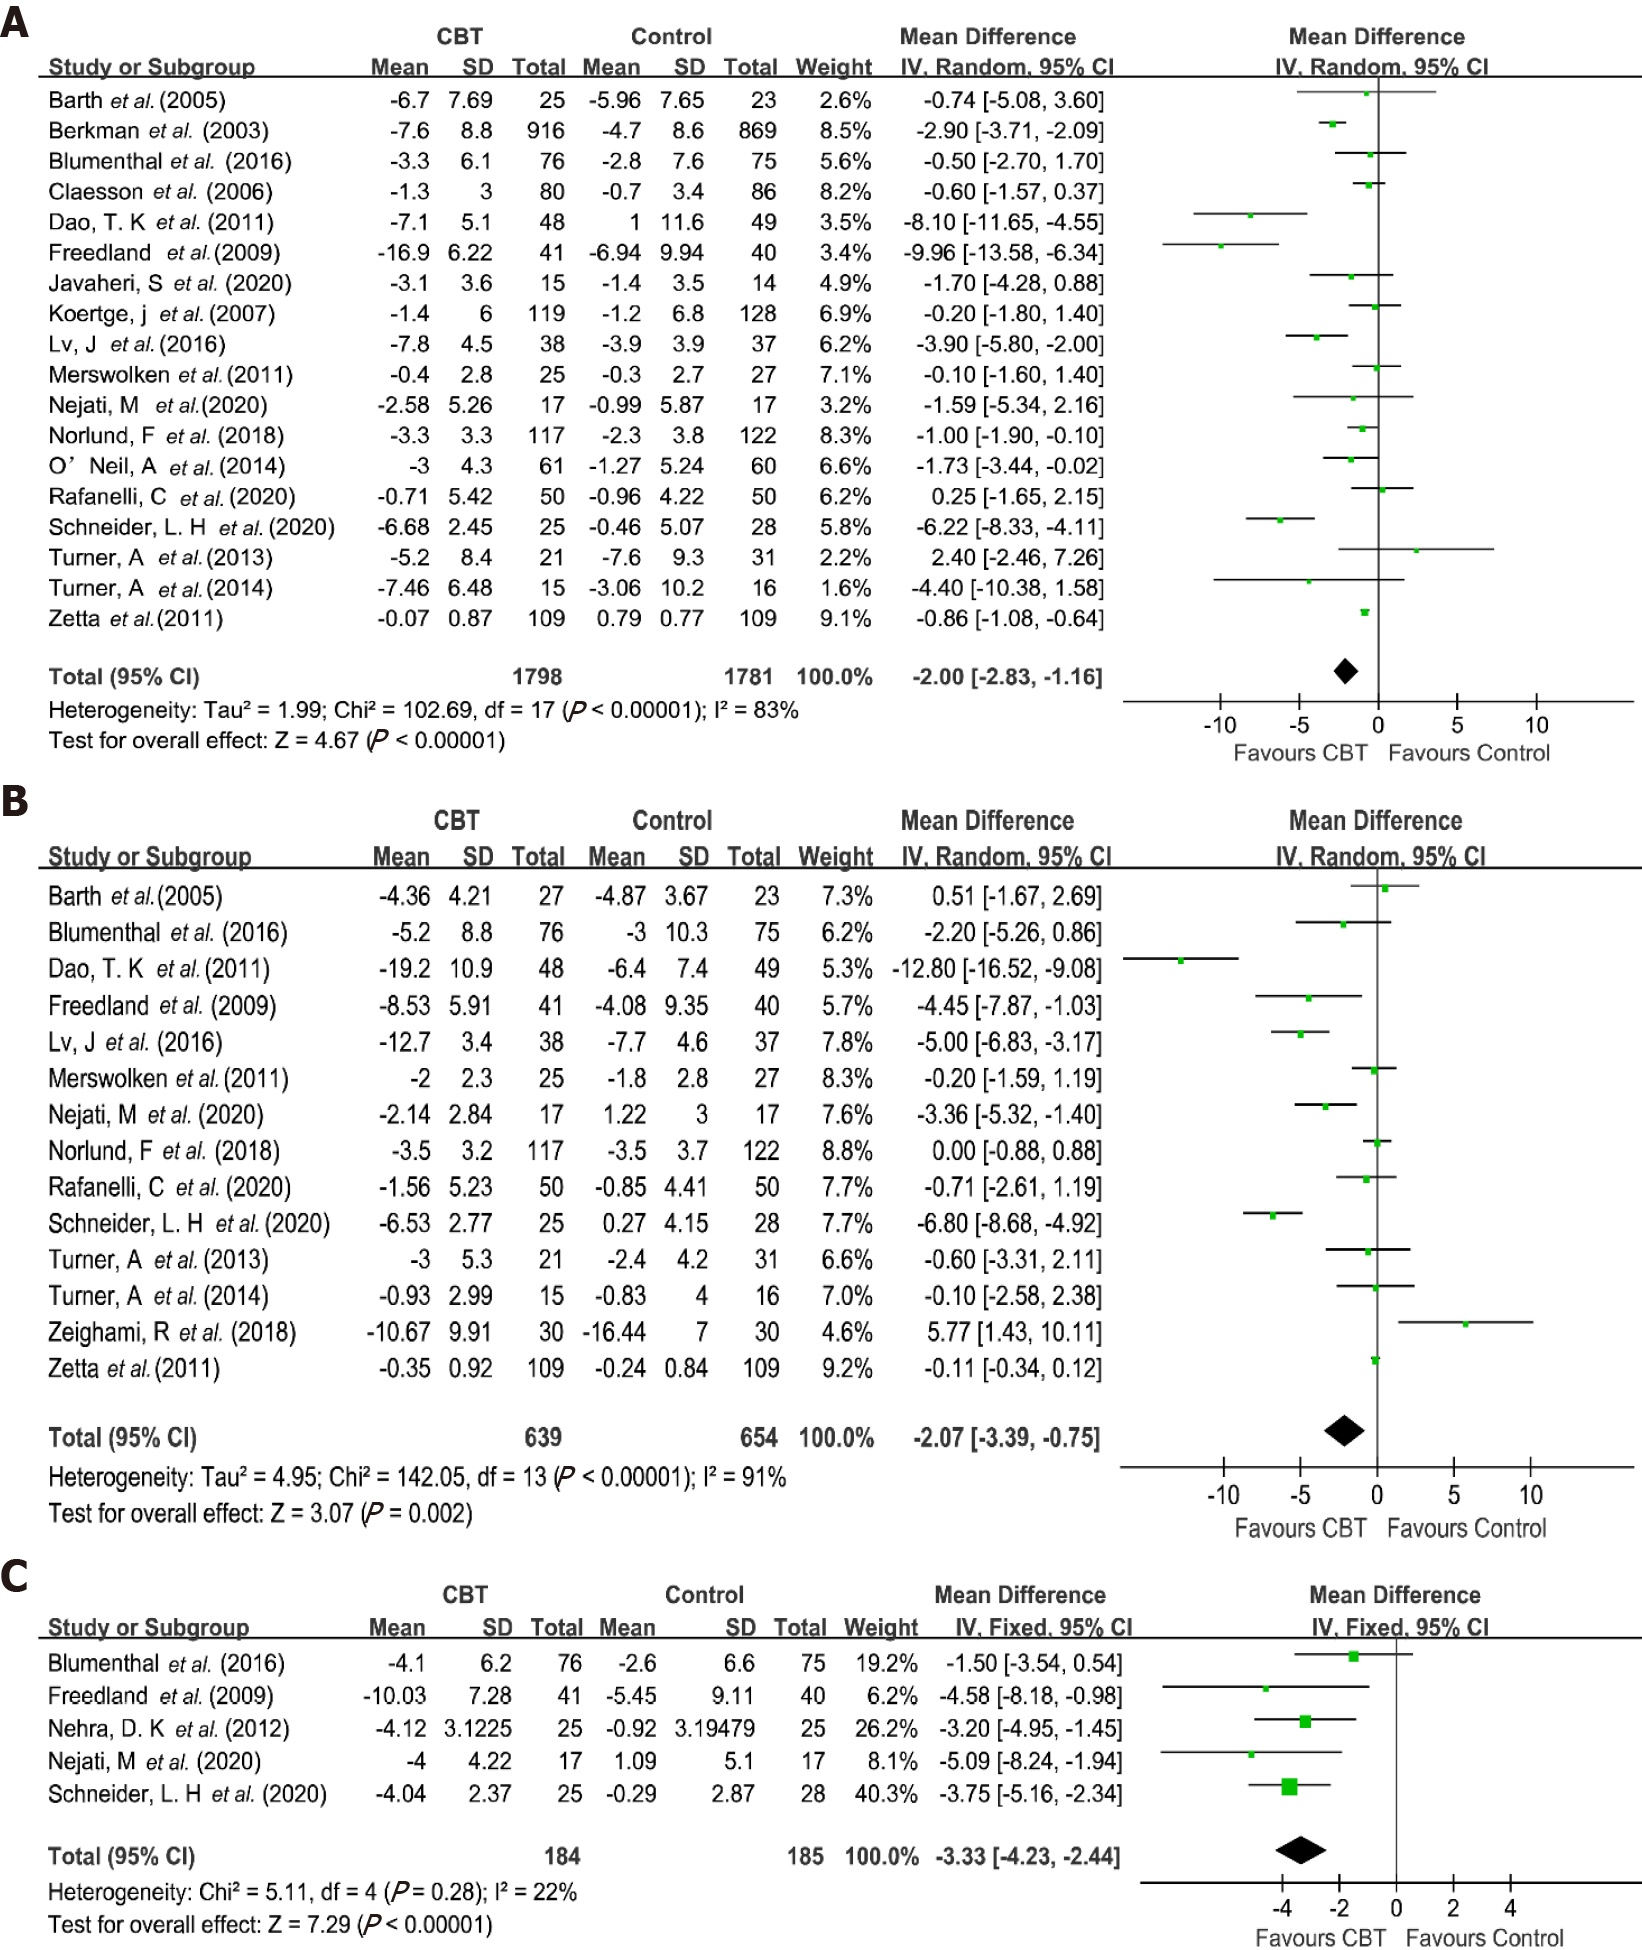
Figure 2 Forest plots of the effects of cognitive behavioral therapy-based interventions.
A: Depression symptom; B: Anxiety symptom; C: Stress symptom. CBT: Cognitive behavioral therapy; CI: Confidence interval.
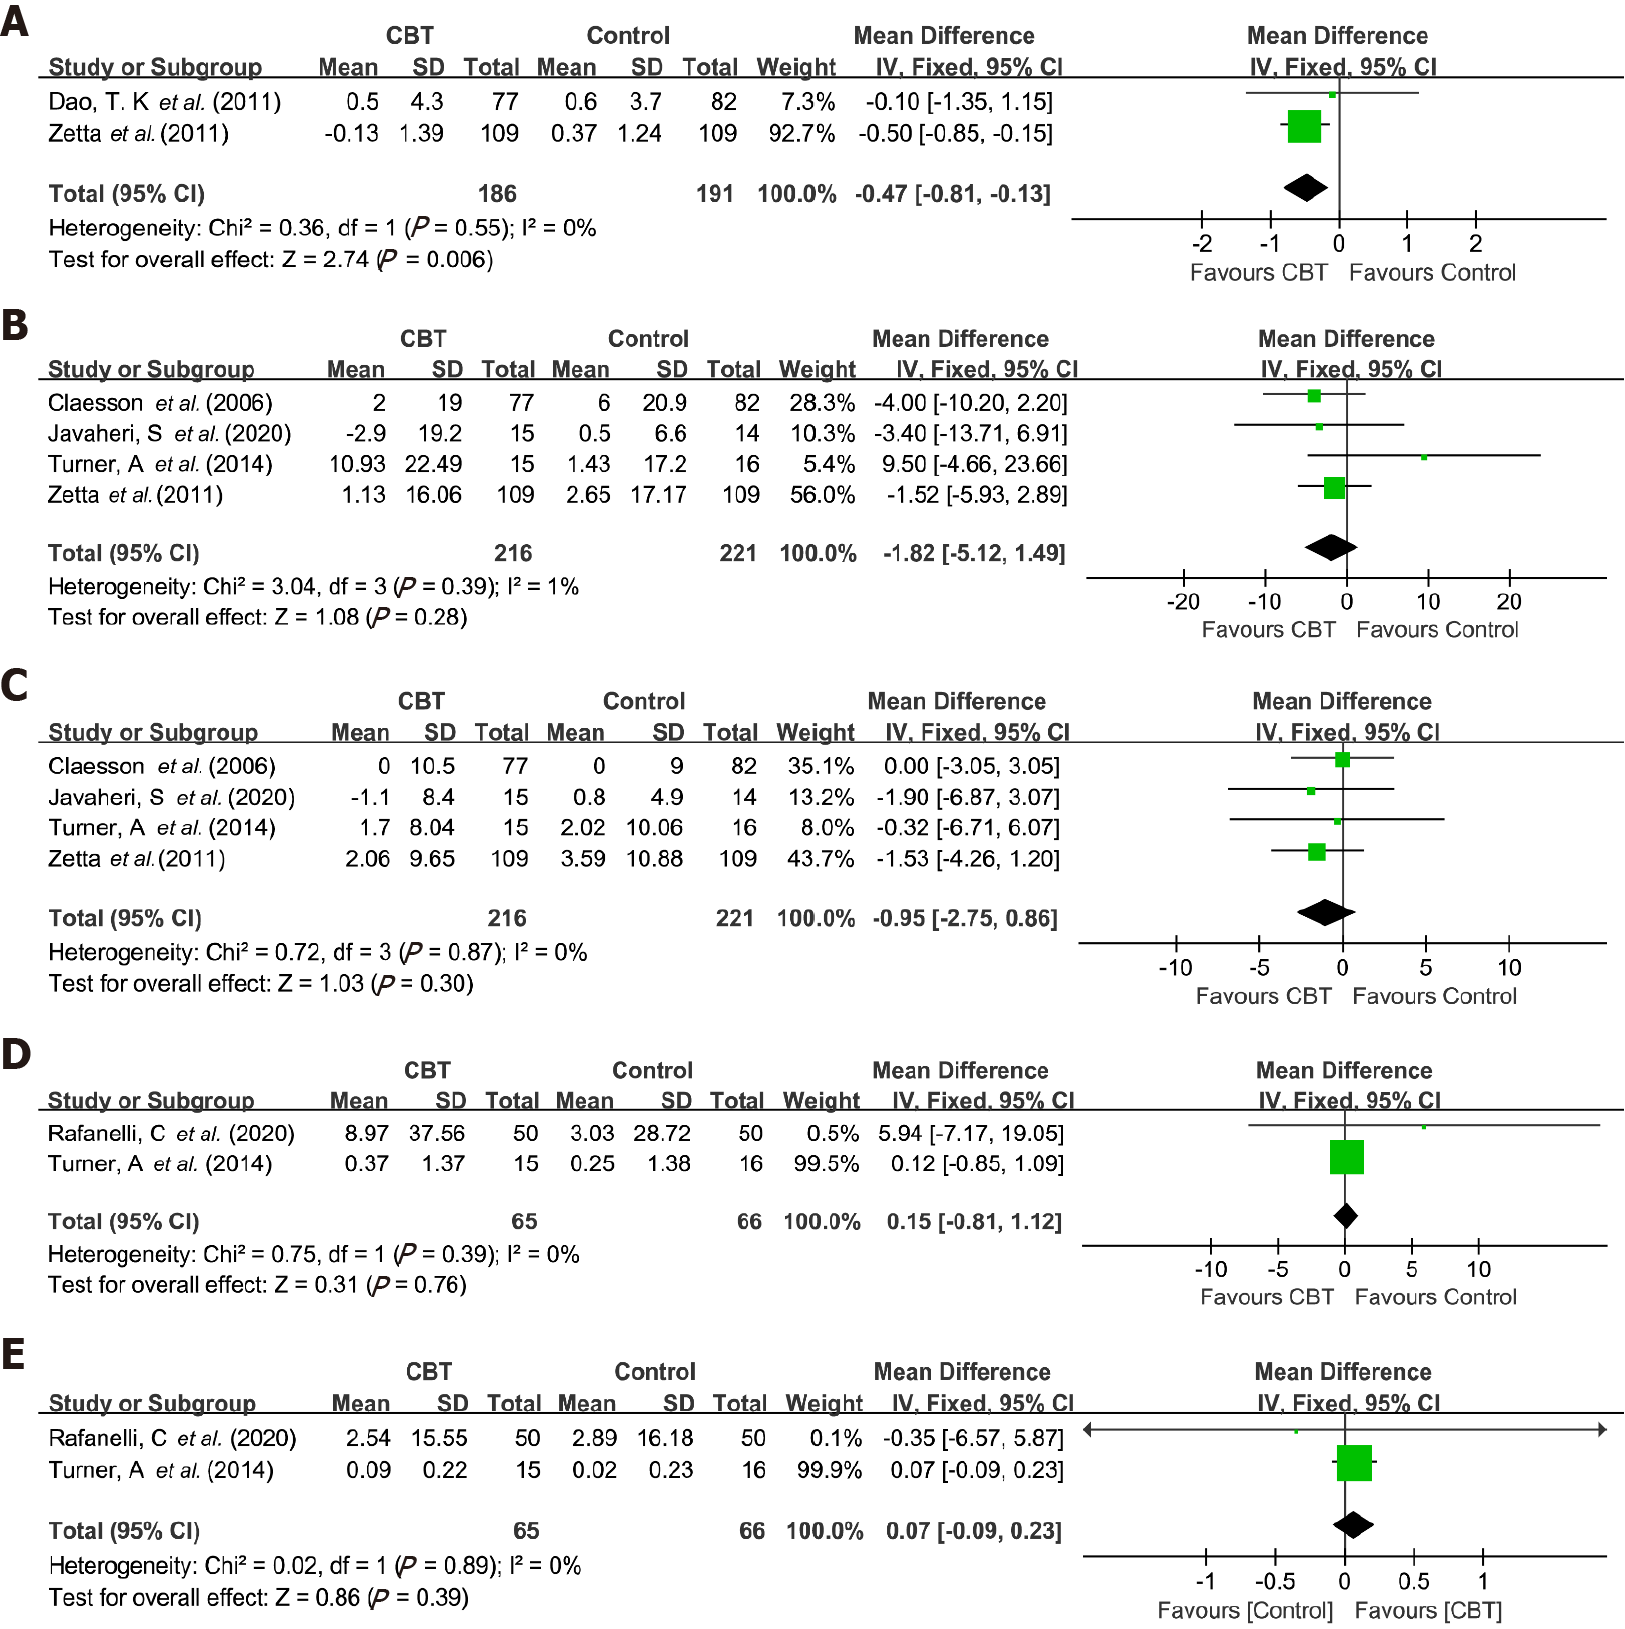
Figure 3 Forest plots of the effects of cognitive behavioral therapy-based interventions.
A: Body mass index; B: Systolic blood pressure; C: Diastolic blood pressure; D: Total cholesterol; E: High-density lipoprotein cholesterol. CBT: Cognitive behavioral therapy; CI: Confidence interval.
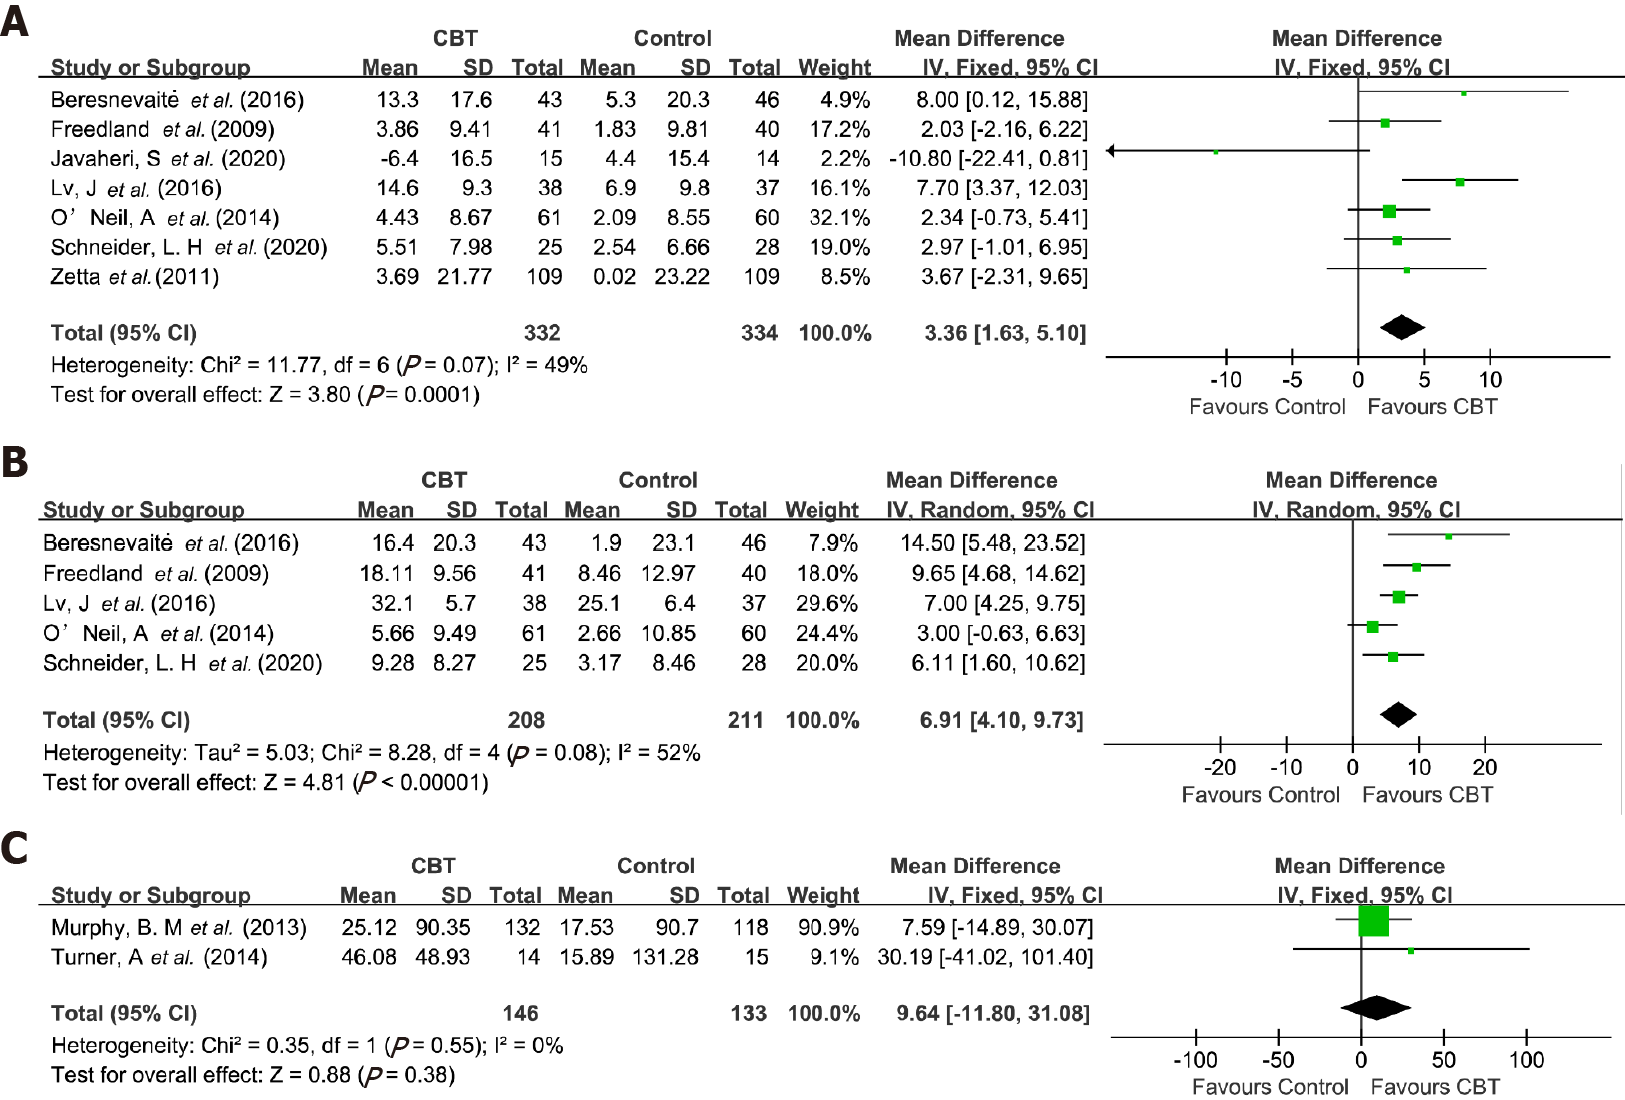
Figure 4 Forest plots of the effects of cognitive behavioral therapy-based interventions.
A: Physical function; B: Mental function; C: 6-min walk distance. CBT: Cognitive behavioral therapy; CI: Confidence interval.
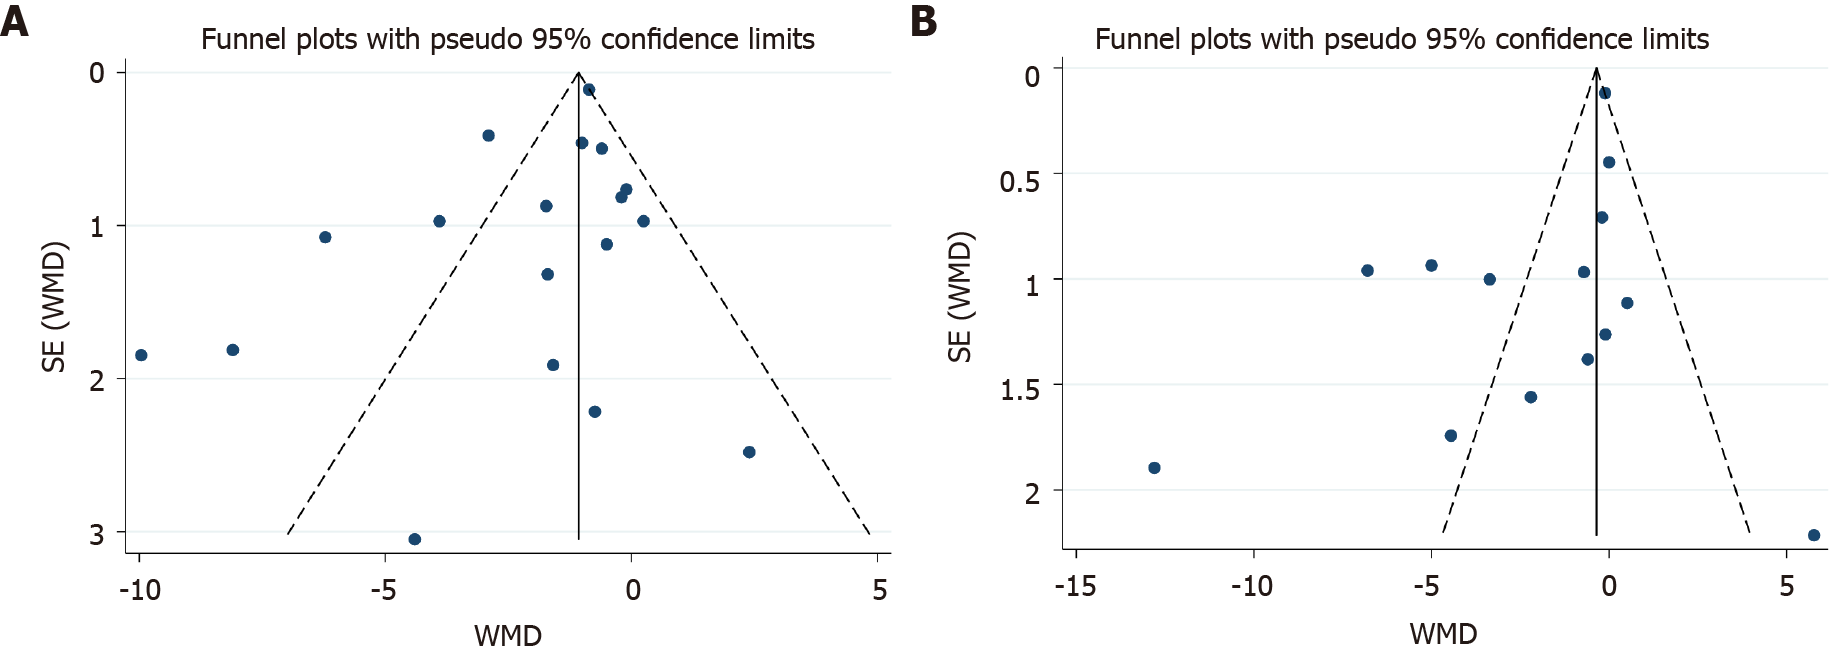
Figure 5 Funnel plots.
A: Depression symptom; B: Anxiety symptom. WMD: Weighted mean difference.
- Citation: Li YN, Buys N, Ferguson S, Li ZJ, Sun J. Effectiveness of cognitive behavioral therapy-based interventions on health outcomes in patients with coronary heart disease: A meta-analysis. World J Psychiatr 2021; 11(11): 1147-1166
- URL: https://www.wjgnet.com/2220-3206/full/v11/i11/1147.htm
- DOI: https://dx.doi.org/10.5498/wjp.v11.i11.1147


