Copyright
©The Author(s) 2020.
World J Psychiatr. Apr 19, 2020; 10(4): 71-80
Published online Apr 19, 2020. doi: 10.5498/wjp.v10.i4.71
Published online Apr 19, 2020. doi: 10.5498/wjp.v10.i4.71
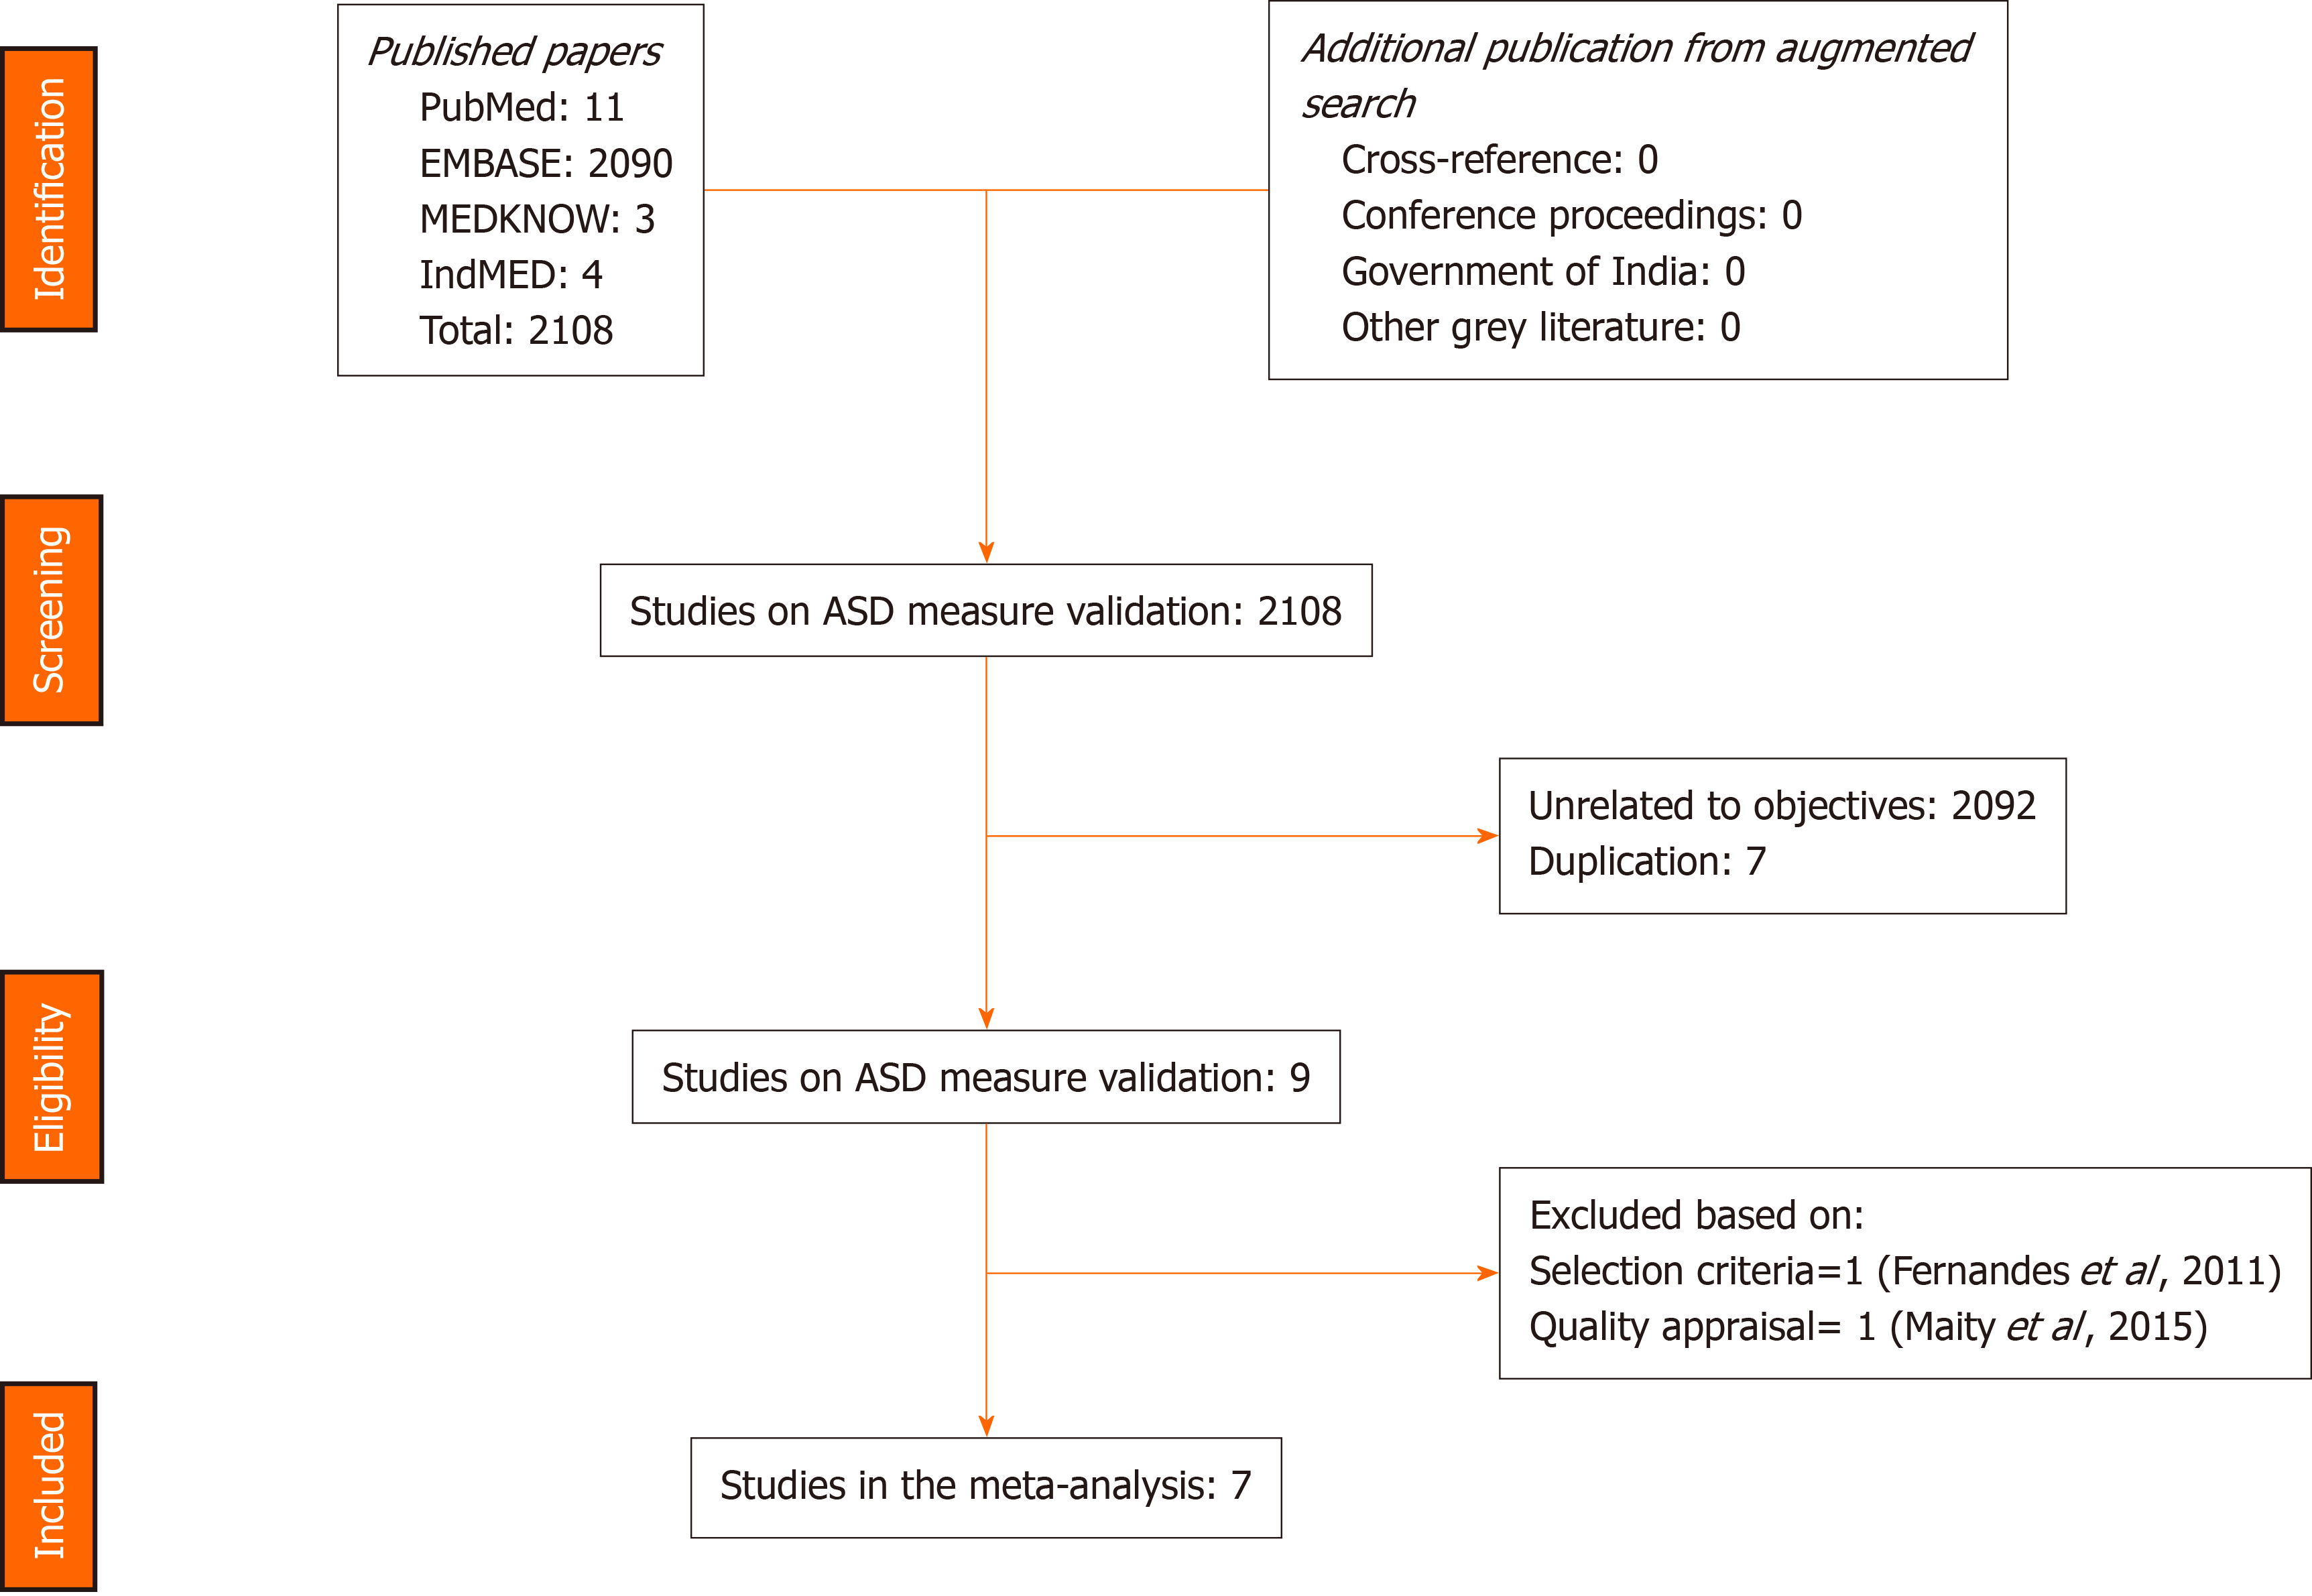
Figure 1 Overview of PRISMA selection process of studies.
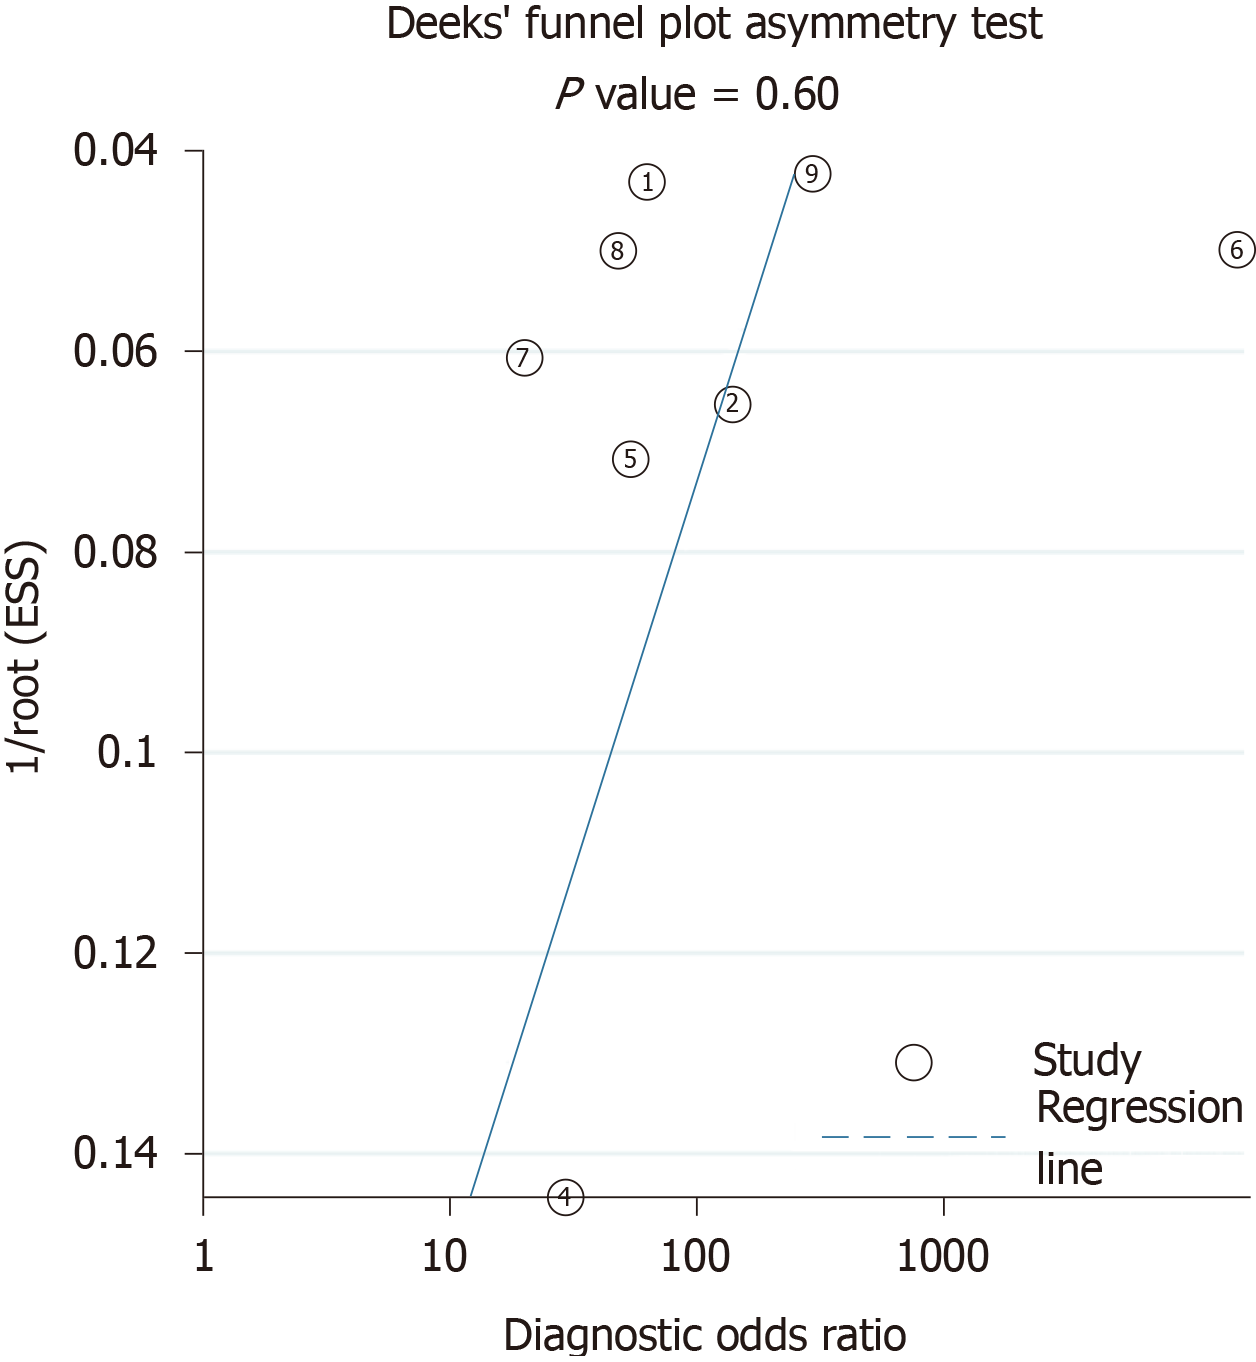
Figure 2 The Deek’s plot for publication bias.
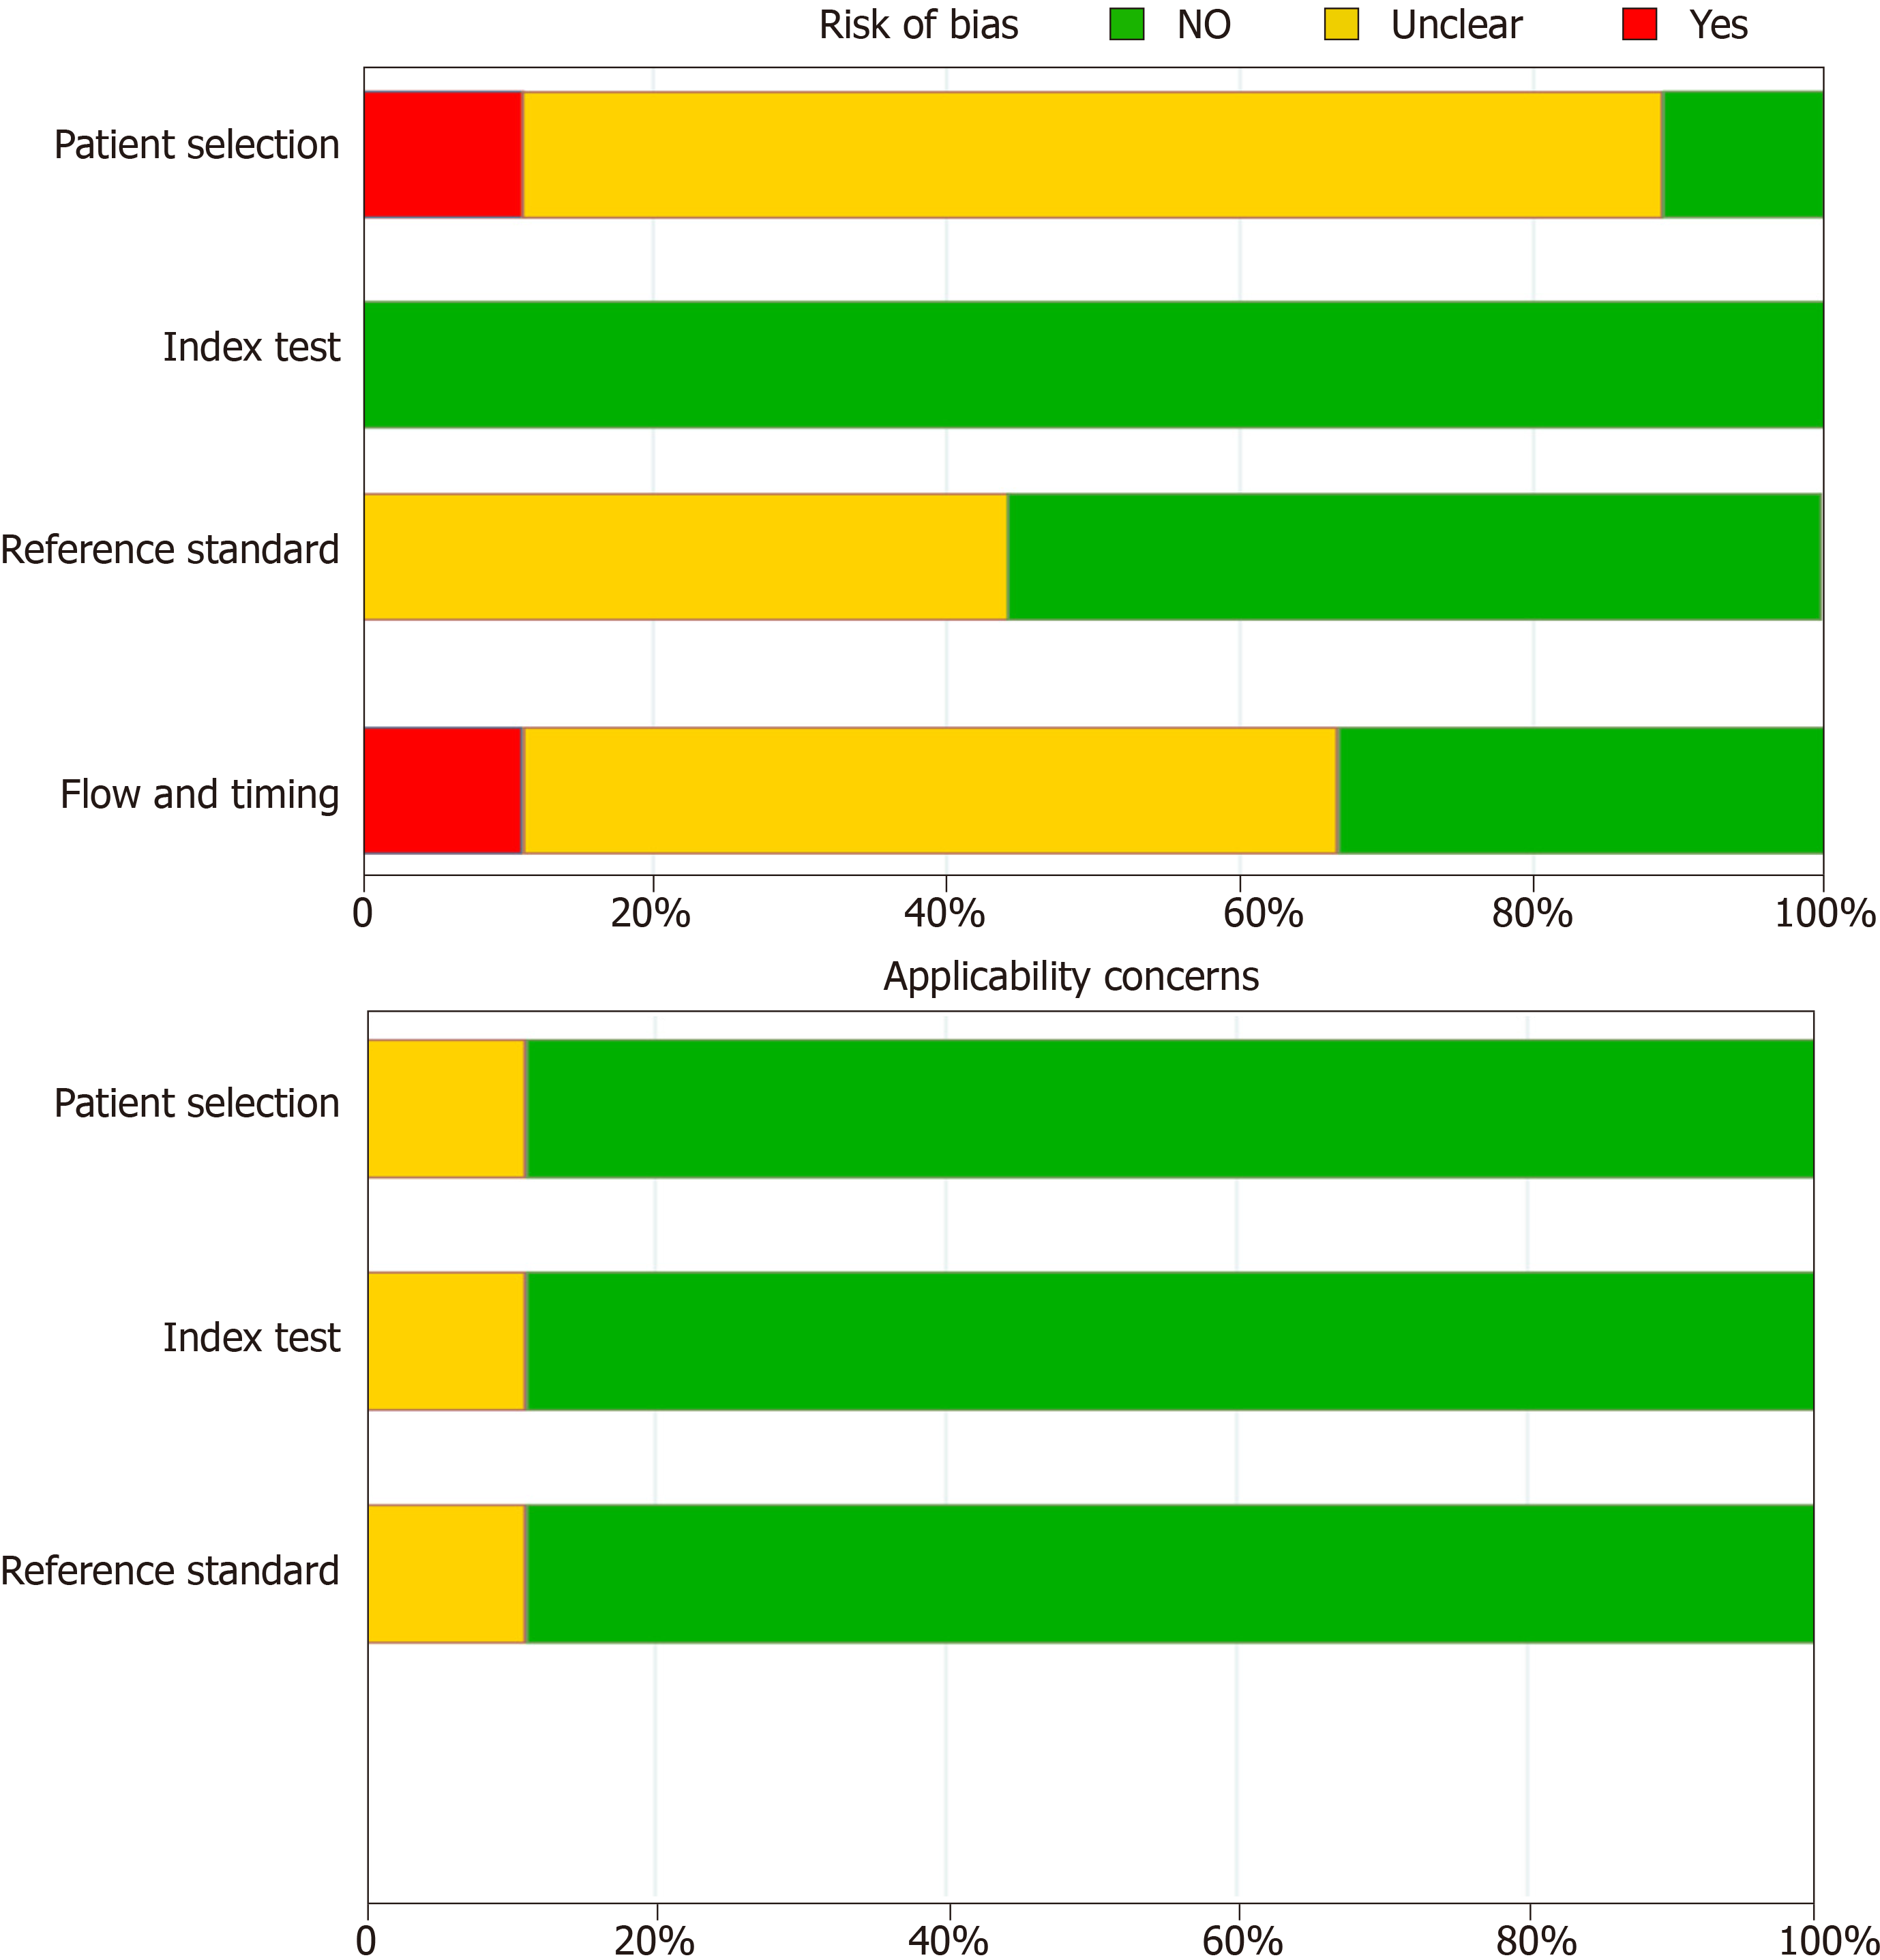
Figure 3 The average Quality Assessment of Diagnostic-Accuracy Studies, version 2 appraisal for all included studies.
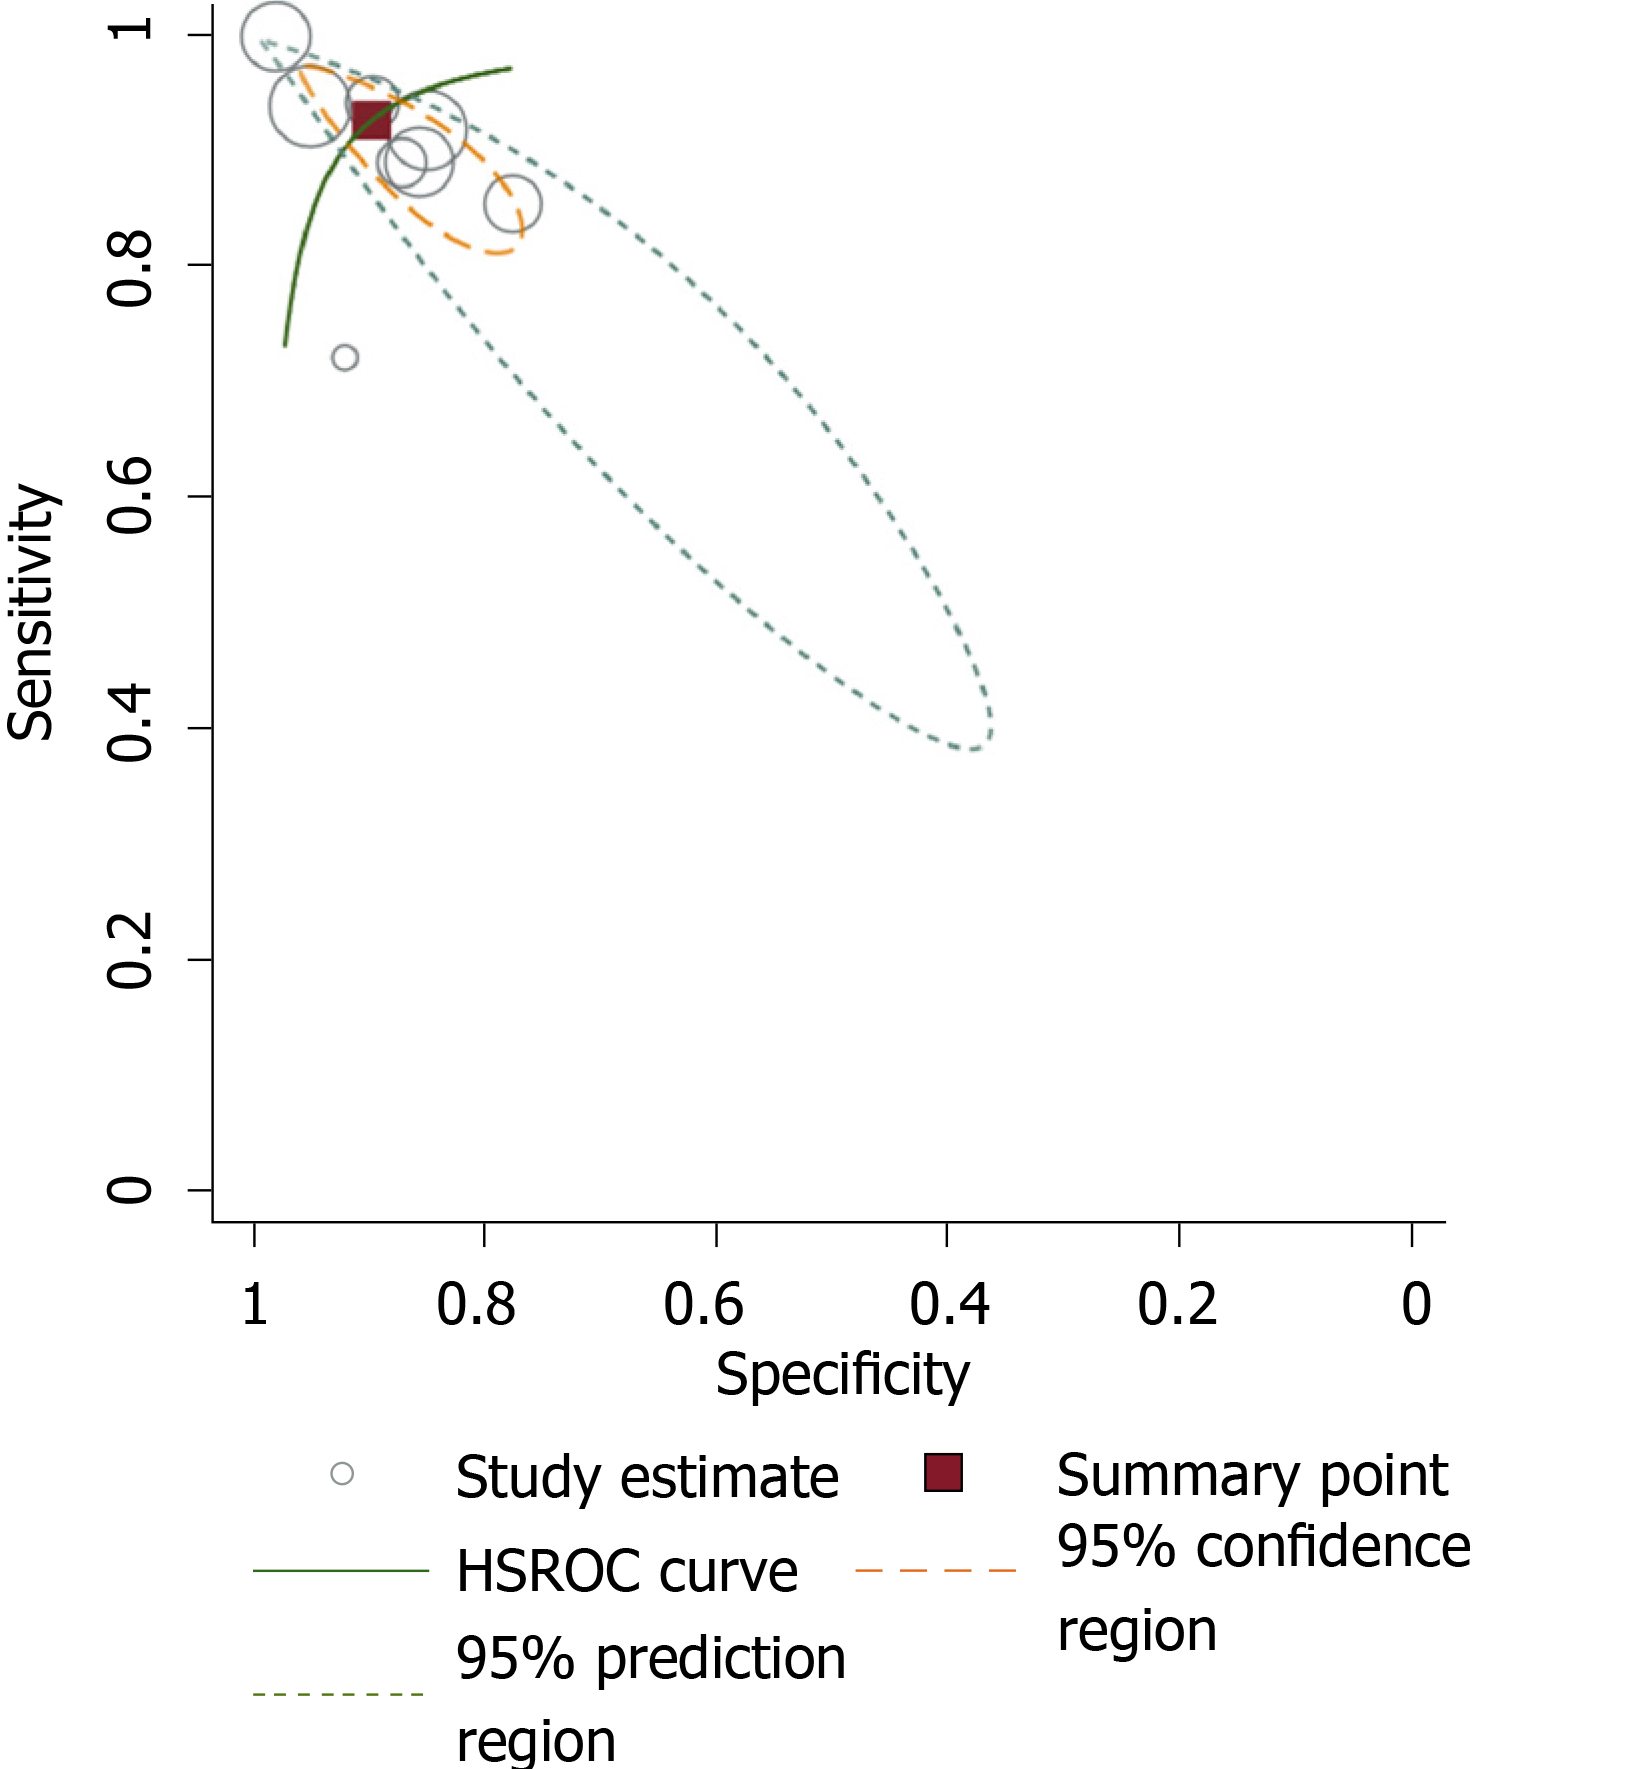
Figure 4 The Hierarchical Summary Receiver Operating Characteristic Curve of Edinburgh Postnatal Depression Scale with its confidence and prediction contours.
HSROC: Hierarchical Summary Receiver Operating Curve.
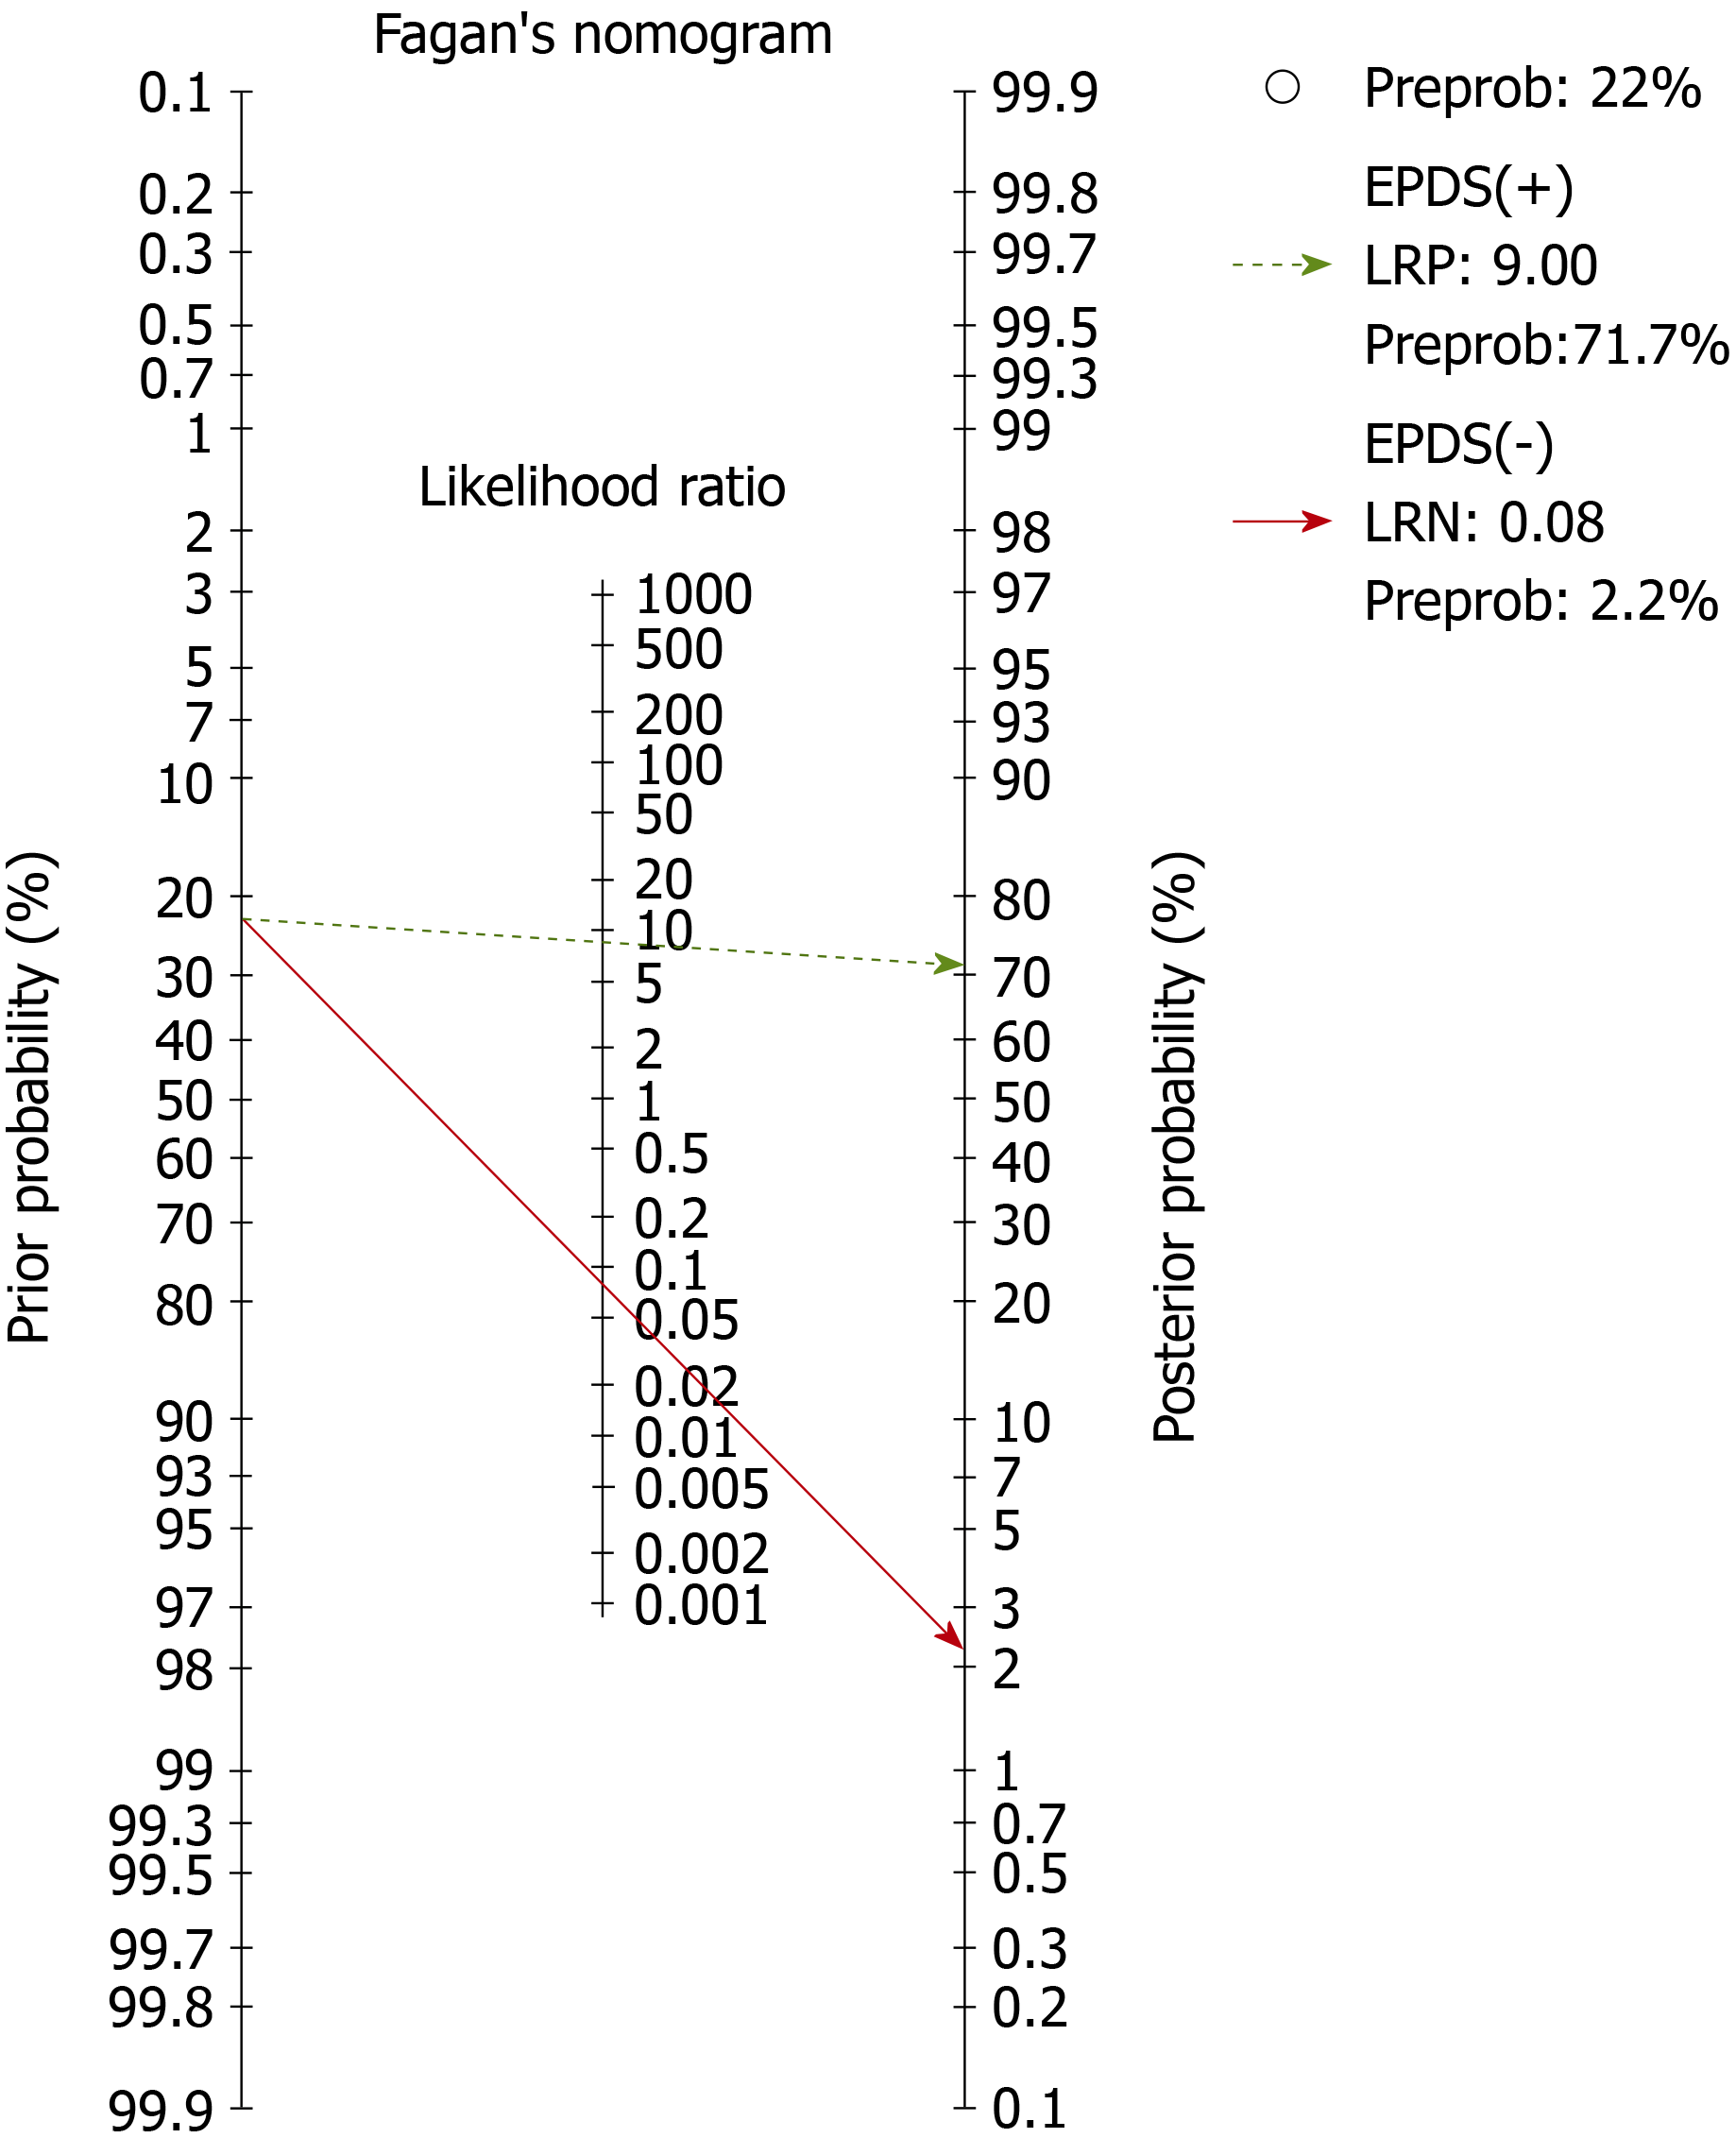
Figure 5 The post-test probability of Edinburgh Postnatal Depression Scale calculated with Fagan’s nomogram.
- Citation: Russell PSS, Chikkala SM, Earnest R, Viswanathan SA, Russell S, Mammen PM. Diagnostic accuracy and clinical utility of non-English versions of Edinburgh Post-Natal Depression Scale for screening post-natal depression in India: A meta-analysis. World J Psychiatr 2020; 10(4): 71-80
- URL: https://www.wjgnet.com/2220-3206/full/v10/i4/71.htm
- DOI: https://dx.doi.org/10.5498/wjp.v10.i4.71


