Copyright
©The Author(s) 2020.
World J Psychiatr. Dec 19, 2020; 10(12): 286-298
Published online Dec 19, 2020. doi: 10.5498/wjp.v10.i12.286
Published online Dec 19, 2020. doi: 10.5498/wjp.v10.i12.286
Figure 1 Venny diagrams of differentially expressed genes at the time point of 24 h post 10 d compared with 42 d post 10 d after aggressor exposure sessions.
A: Overlapping upregulated differentially expressed genes; B: Overlapping downregulated differentially expressed genes.
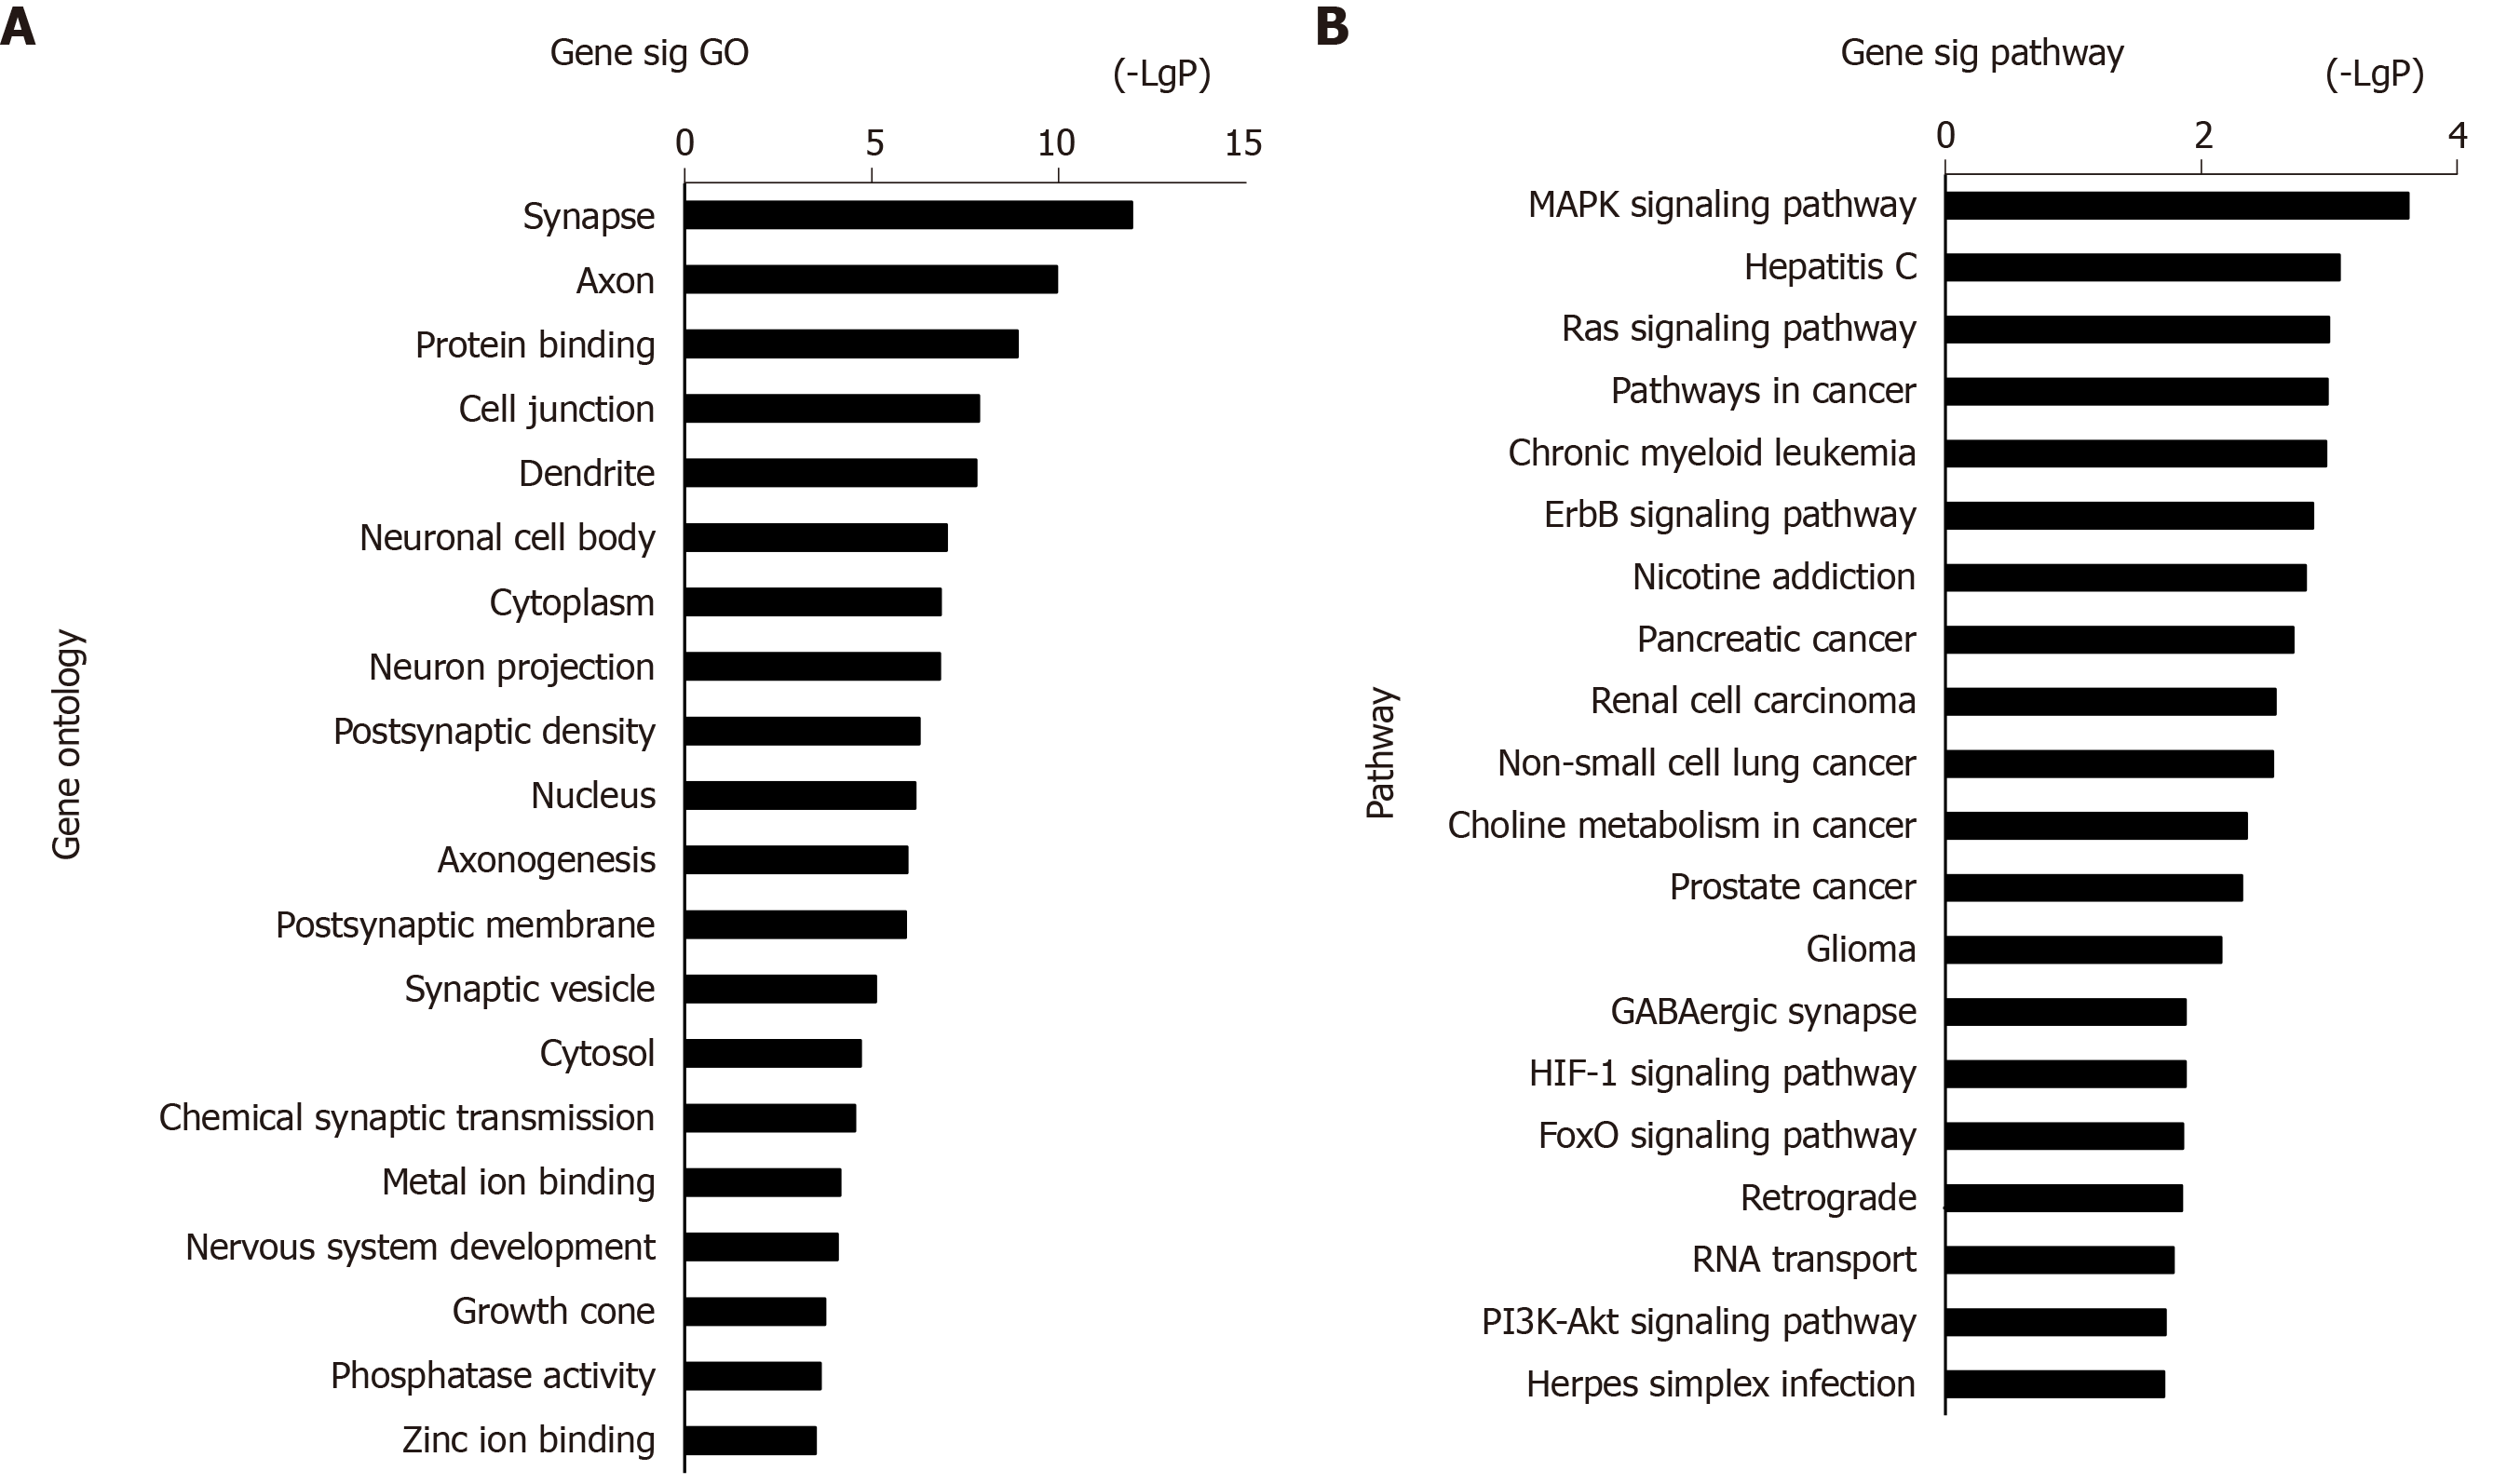
Figure 2 Gene ontology annotation and pathway enrichment of differentially expressed genes associated with post-traumatic stress disorder.
A: Gene ontology analysis of differentially expressed genes (top 20); B: The Kyoto Encyclopedia of Genes and Genomes enrichment analysis of differentially expressed genes (top 20) with enriched score values setting as –log10 (P values). GO: Gene ontology.
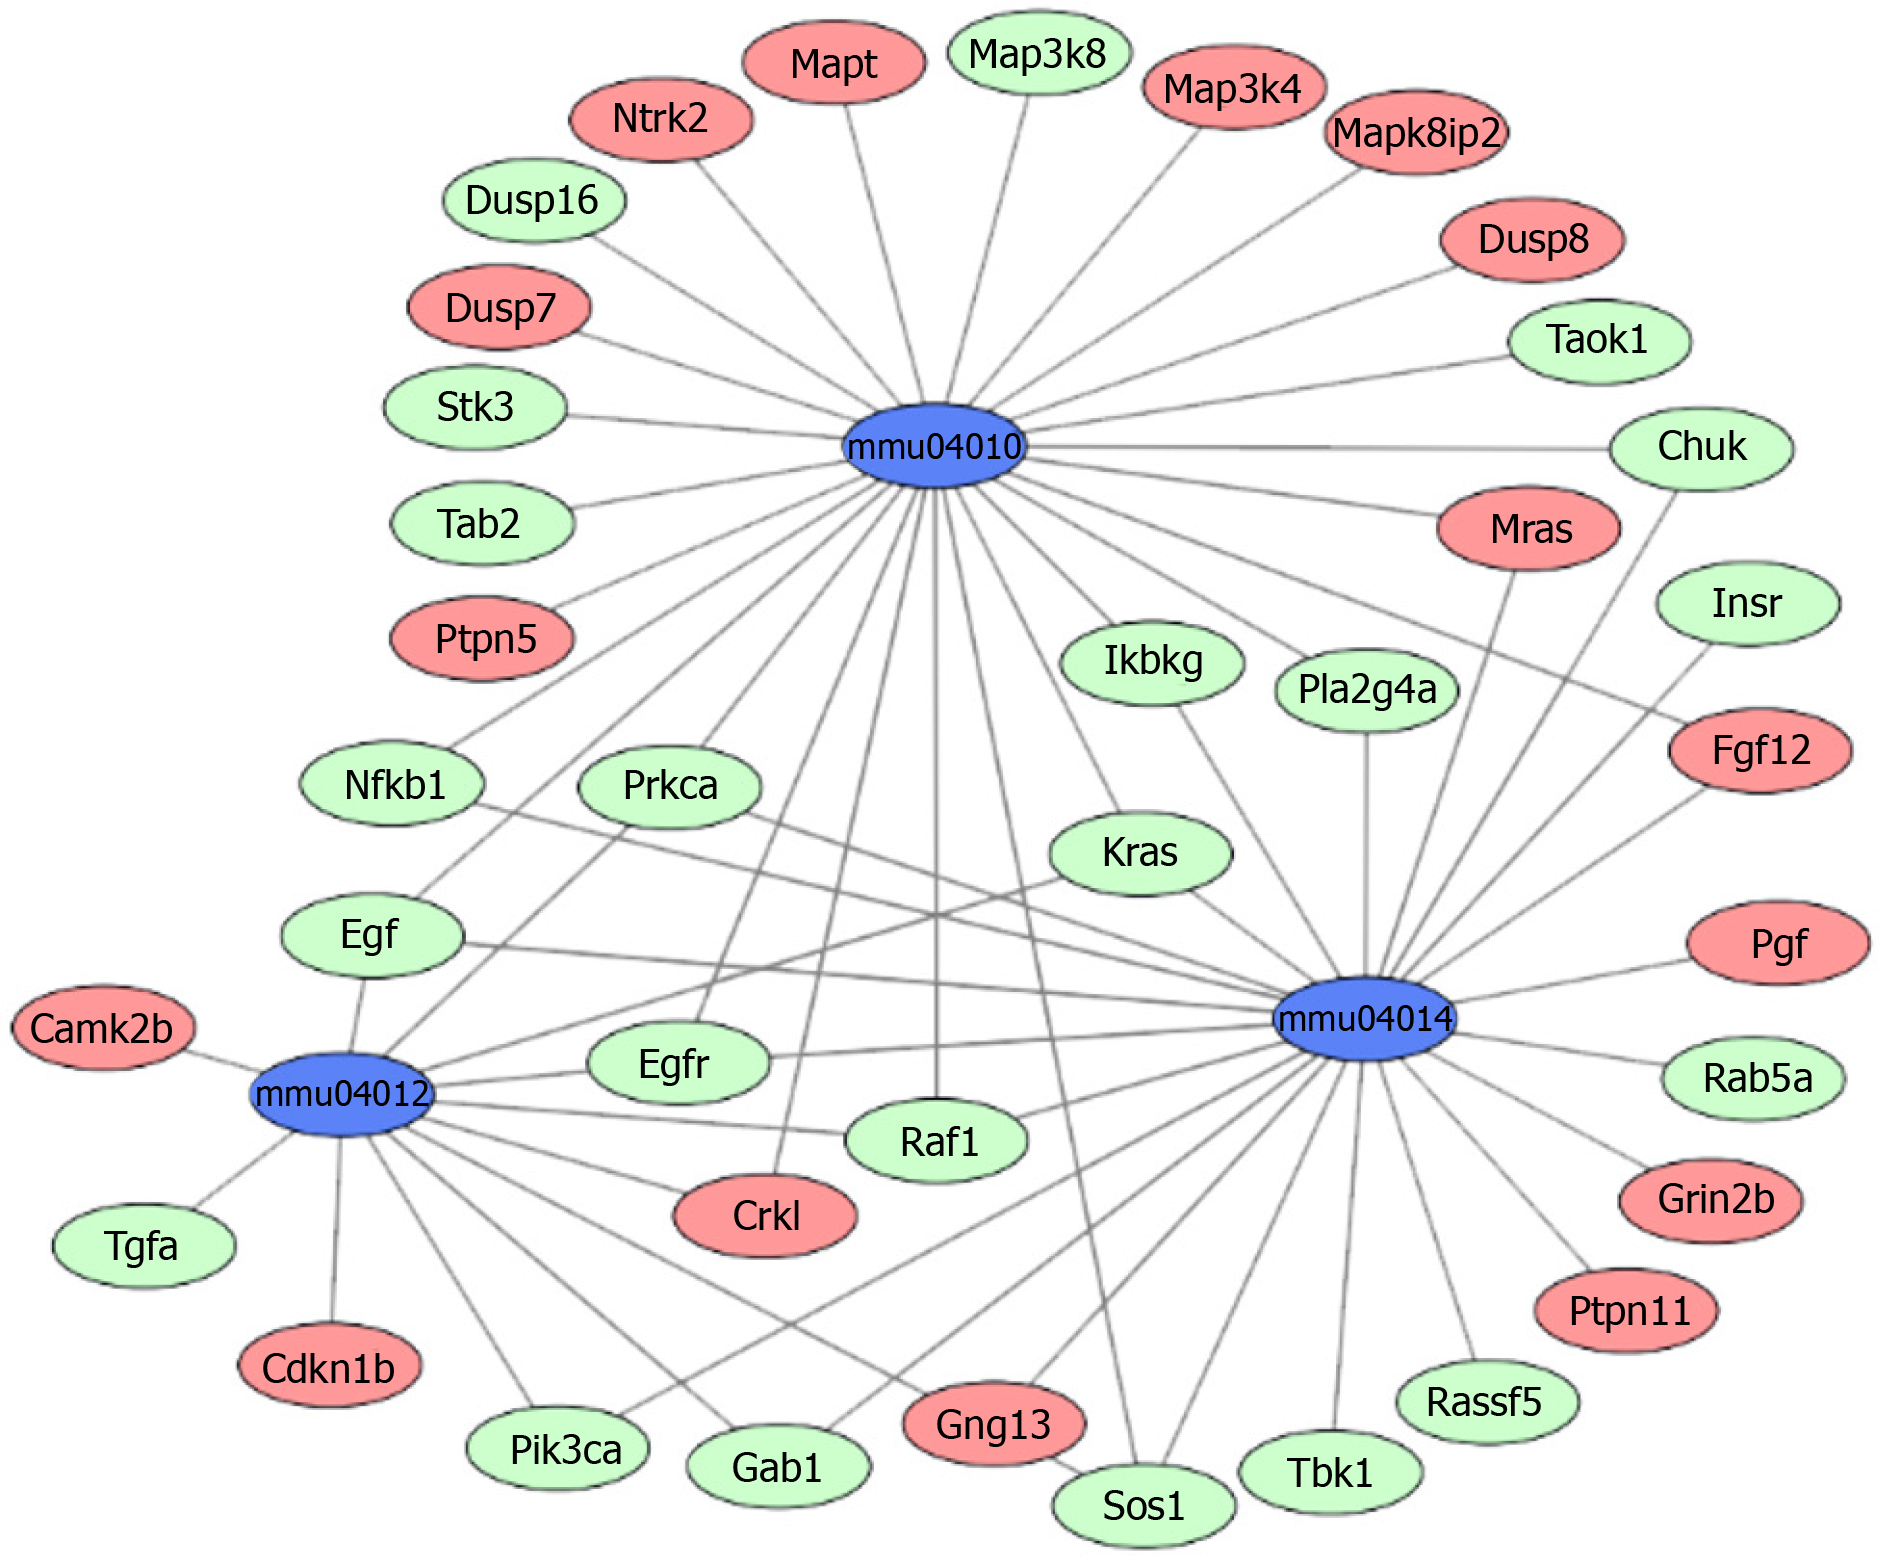
Figure 3 Co-expression pattern of the most significantly enriched pathways of differentially expressed genes involved in post-traumatic stress disorder.
In the graphic, red cycles as the upregulated genes, green cycles as the downregulated genes, and blue cycles as the signaling pathway.
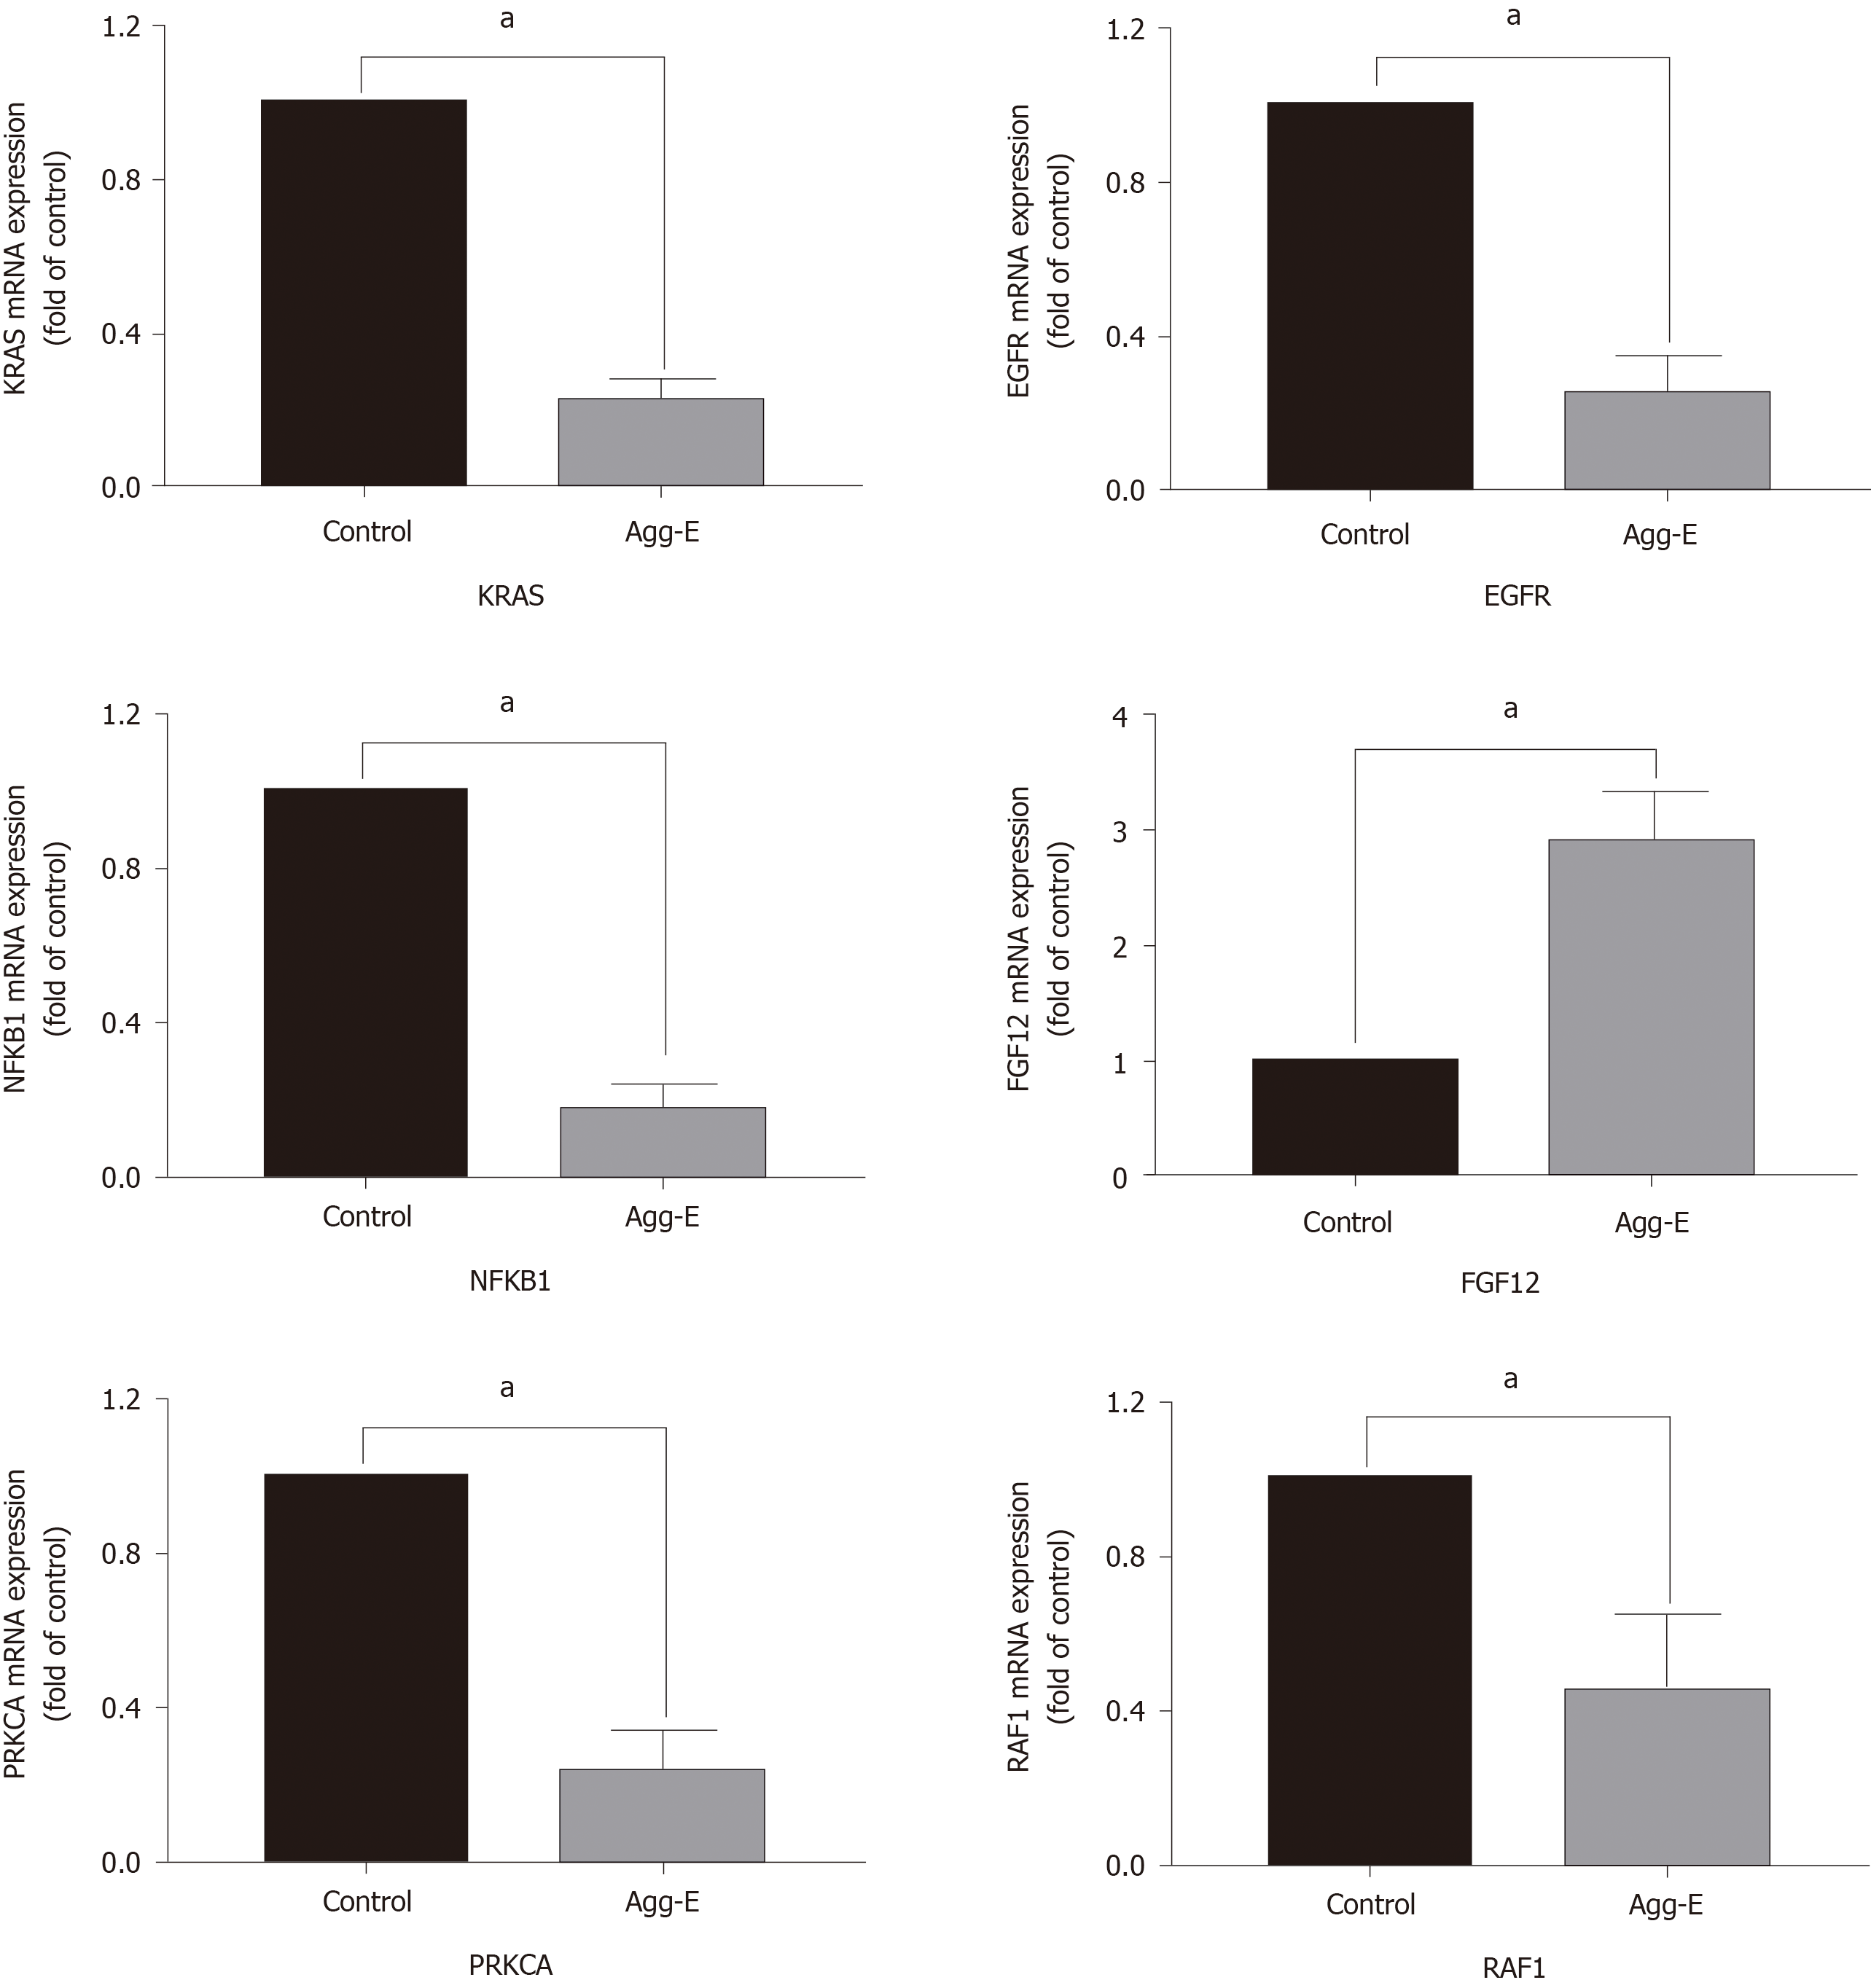
Figure 4 The mRNA expression of hub genes in control and aggressed-exposed groups.
The results are shown as the mean ± SD, aP < 0.05. Agg-E: Aggressed-exposed; KRAS: KRAS proto-oncogene, GTPase; EGFR: Epidermal growth factor receptor; NFKB1: Nuclear factor kappa B subunit 1; FGF12: Fibroblast growth factor 12; PRKCA: Protein kinase C alpha; RAF1: Raf-1 proto-oncogene, serine/threonine kinase.
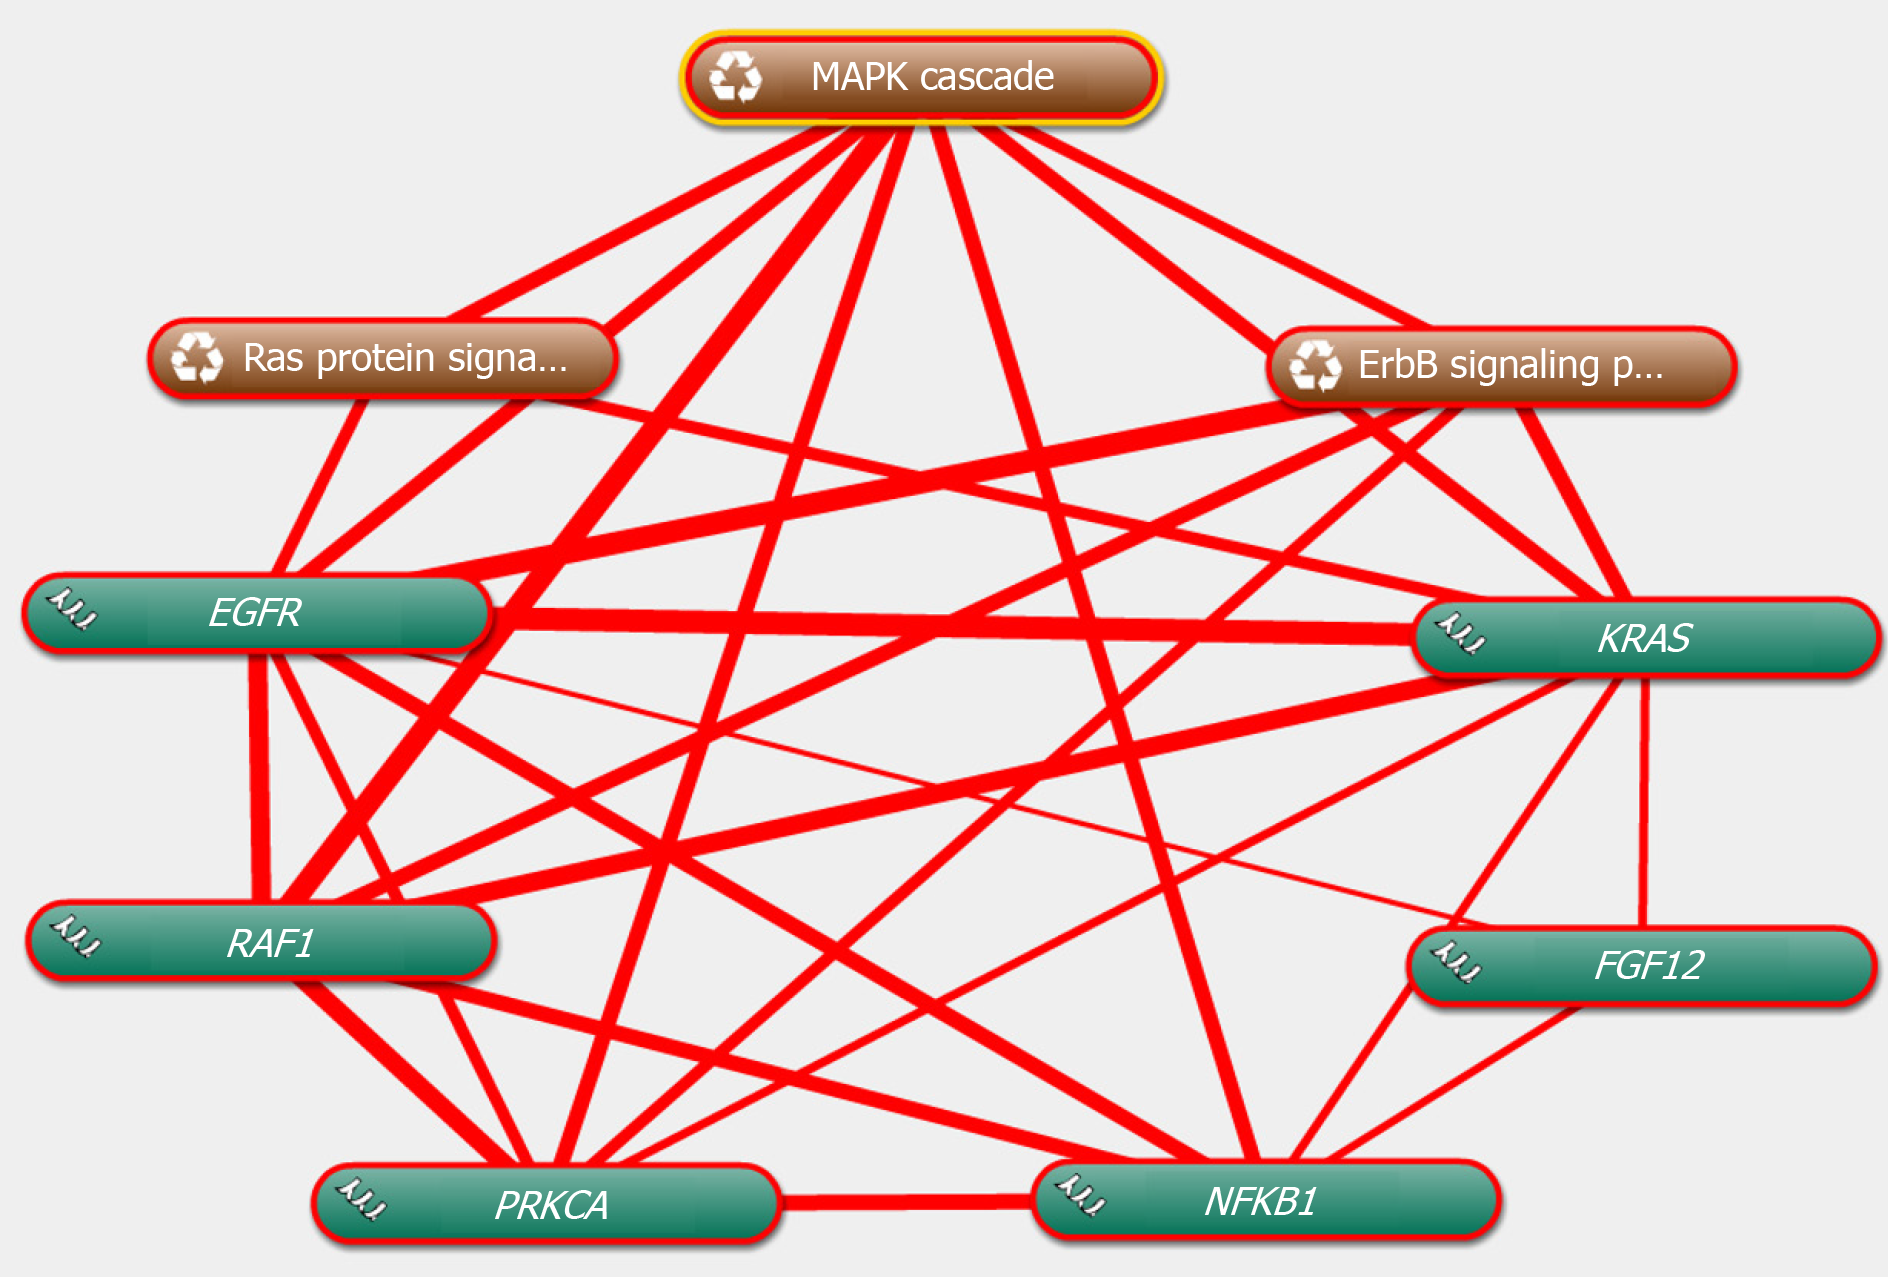
Figure 5 Linear association among the hub genes and co-expressed pathways using Coremine Medical online tool.
The thicker the line, the closer the relationship. KRAS: KRAS proto-oncogene, GTPase; EGFR: Epidermal growth factor receptor; NFKB1: Nuclear factor kappa B subunit 1; FGF12: Fibroblast growth factor 12; PRKCA: Protein kinase C alpha; RAF1: Raf-1 proto-oncogene, serine/threonine kinase.
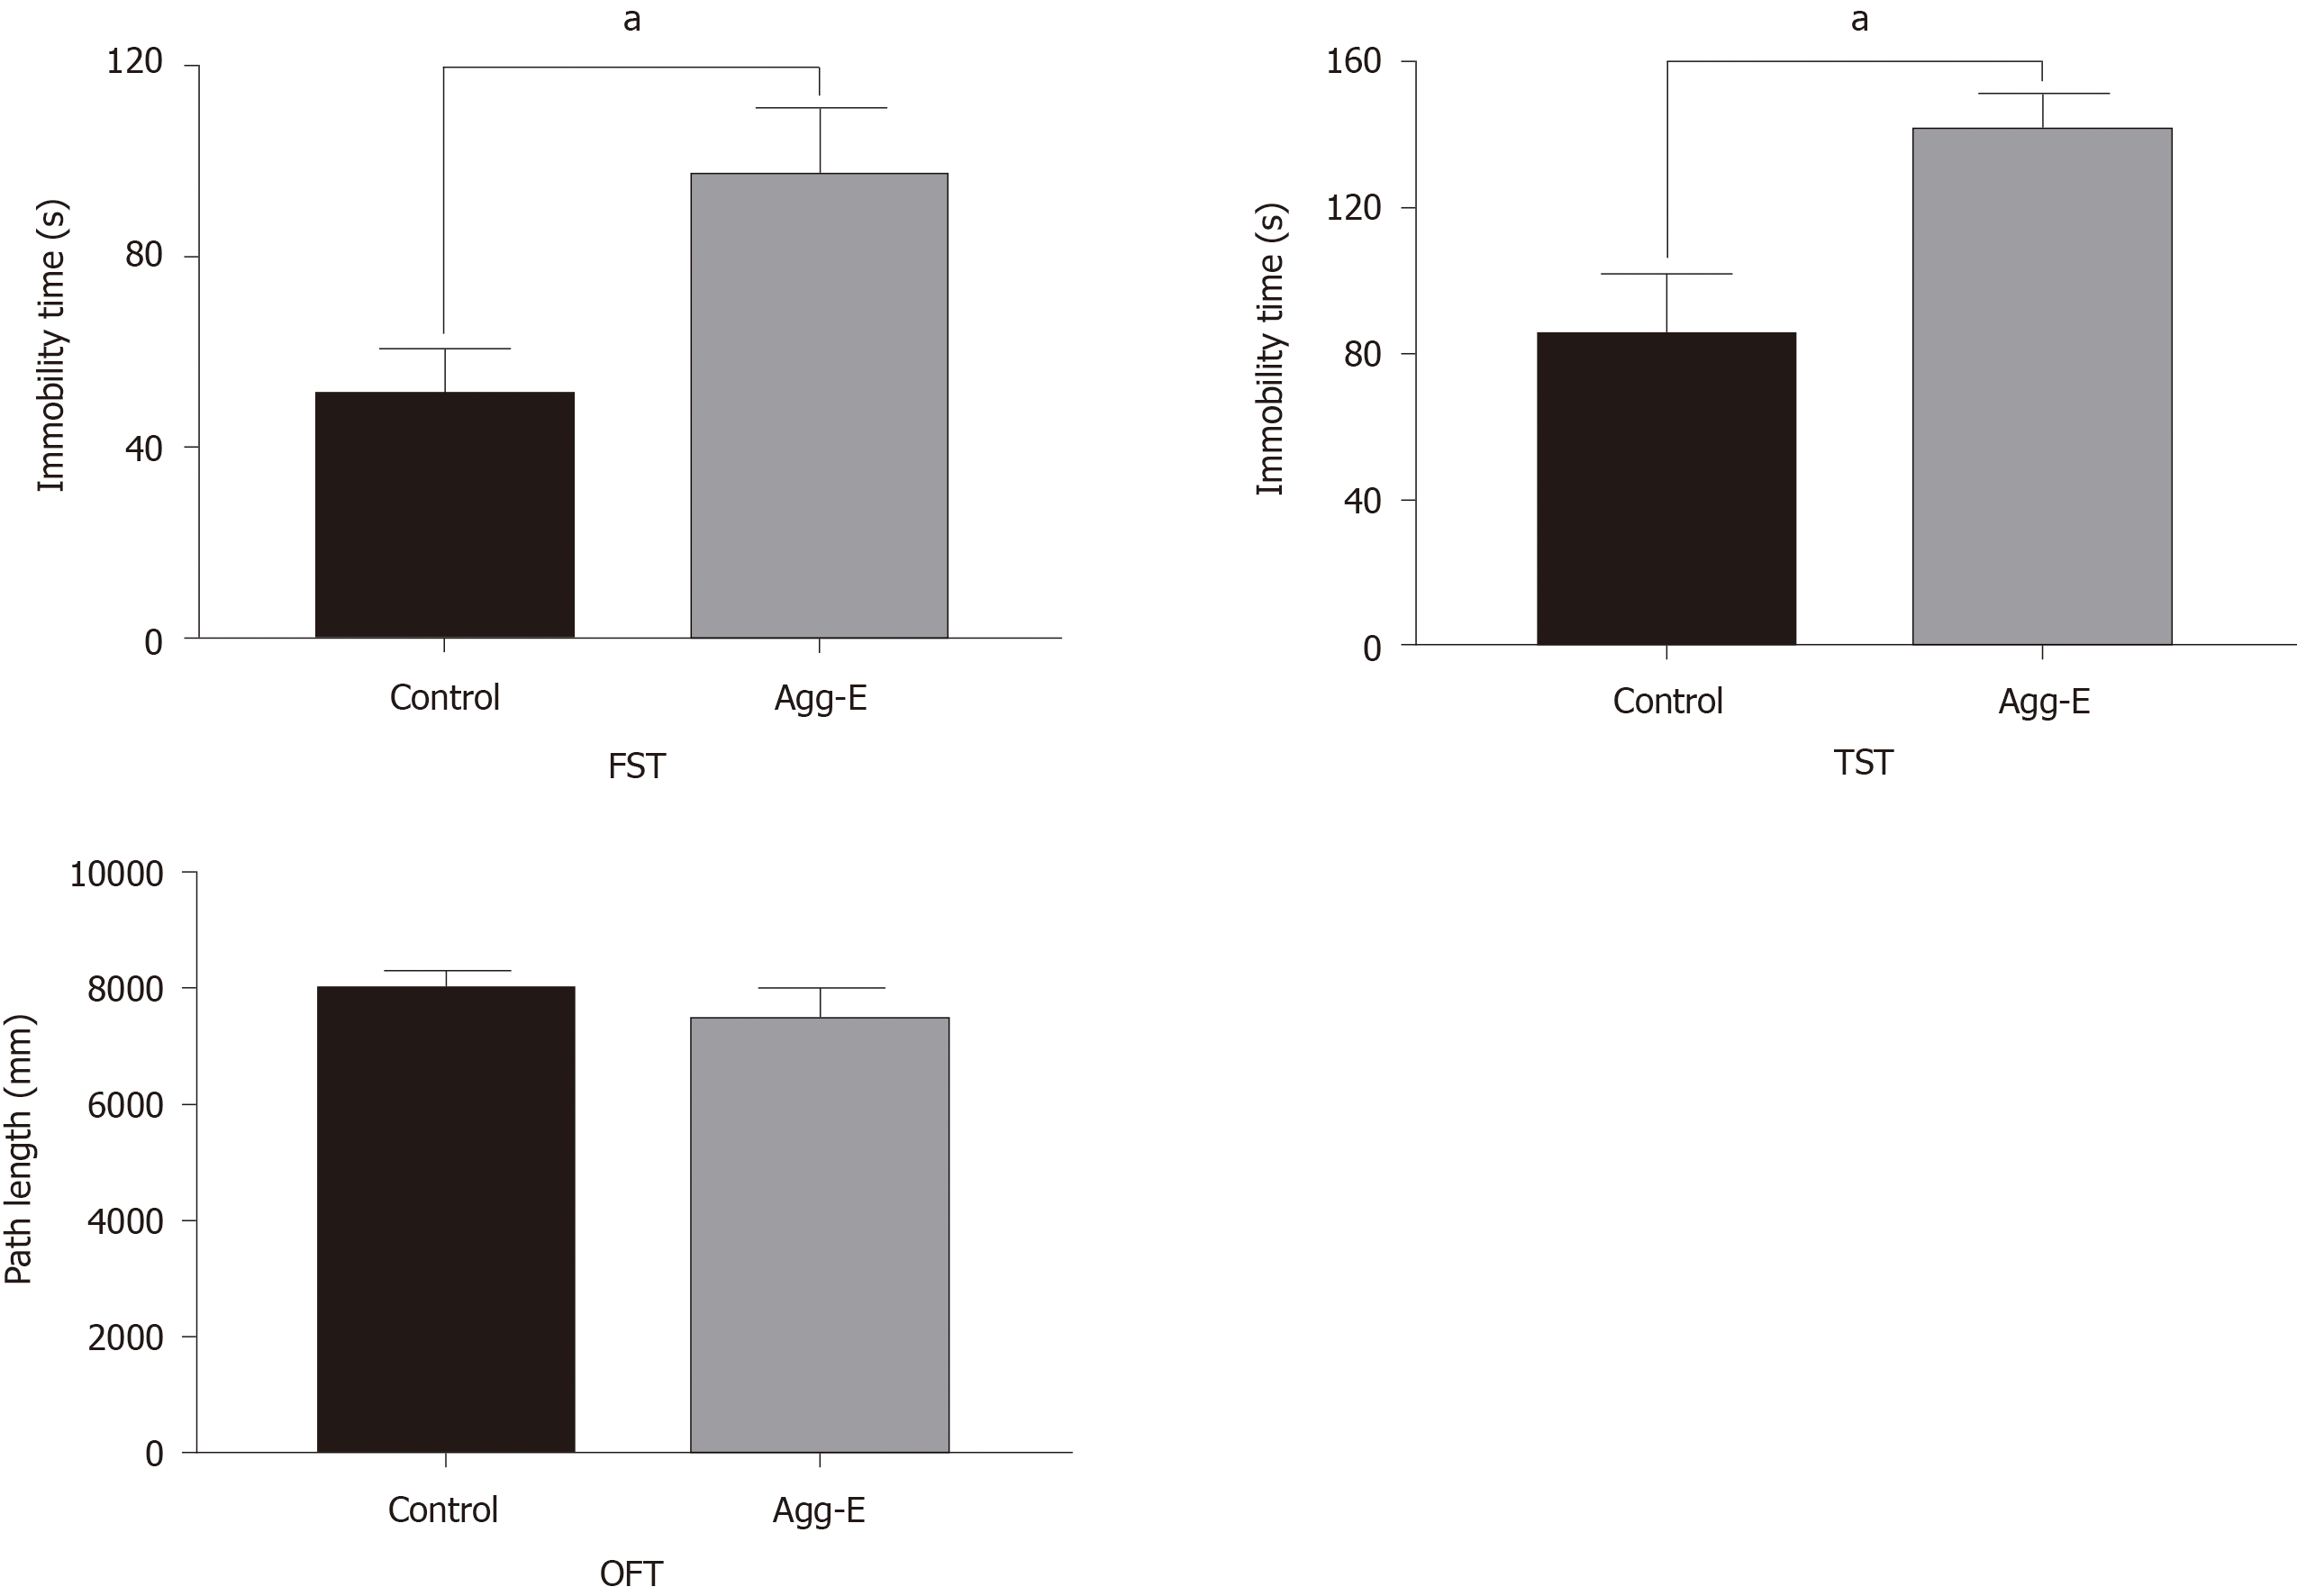
Figure 6 The immobility time in forced swim test and tail suspension test, and the path length of open-field test.
Data are presented as the mean ± SD, aP < 0.05. Agg-E: Aggressed-exposed; FST: Forced swim test; TST: Tail suspension test; OFT: Open-field test.
- Citation: Bian YY, Yang LL, Zhang B, Li W, Li ZJ, Li WL, Zeng L. Identification of key genes involved in post-traumatic stress disorder: Evidence from bioinformatics analysis. World J Psychiatr 2020; 10(12): 286-298
- URL: https://www.wjgnet.com/2220-3206/full/v10/i12/286.htm
- DOI: https://dx.doi.org/10.5498/wjp.v10.i12.286


