Copyright
©The Author(s) 2020.
World J Psychiatr. Nov 19, 2020; 10(11): 245-259
Published online Nov 19, 2020. doi: 10.5498/wjp.v10.i11.245
Published online Nov 19, 2020. doi: 10.5498/wjp.v10.i11.245
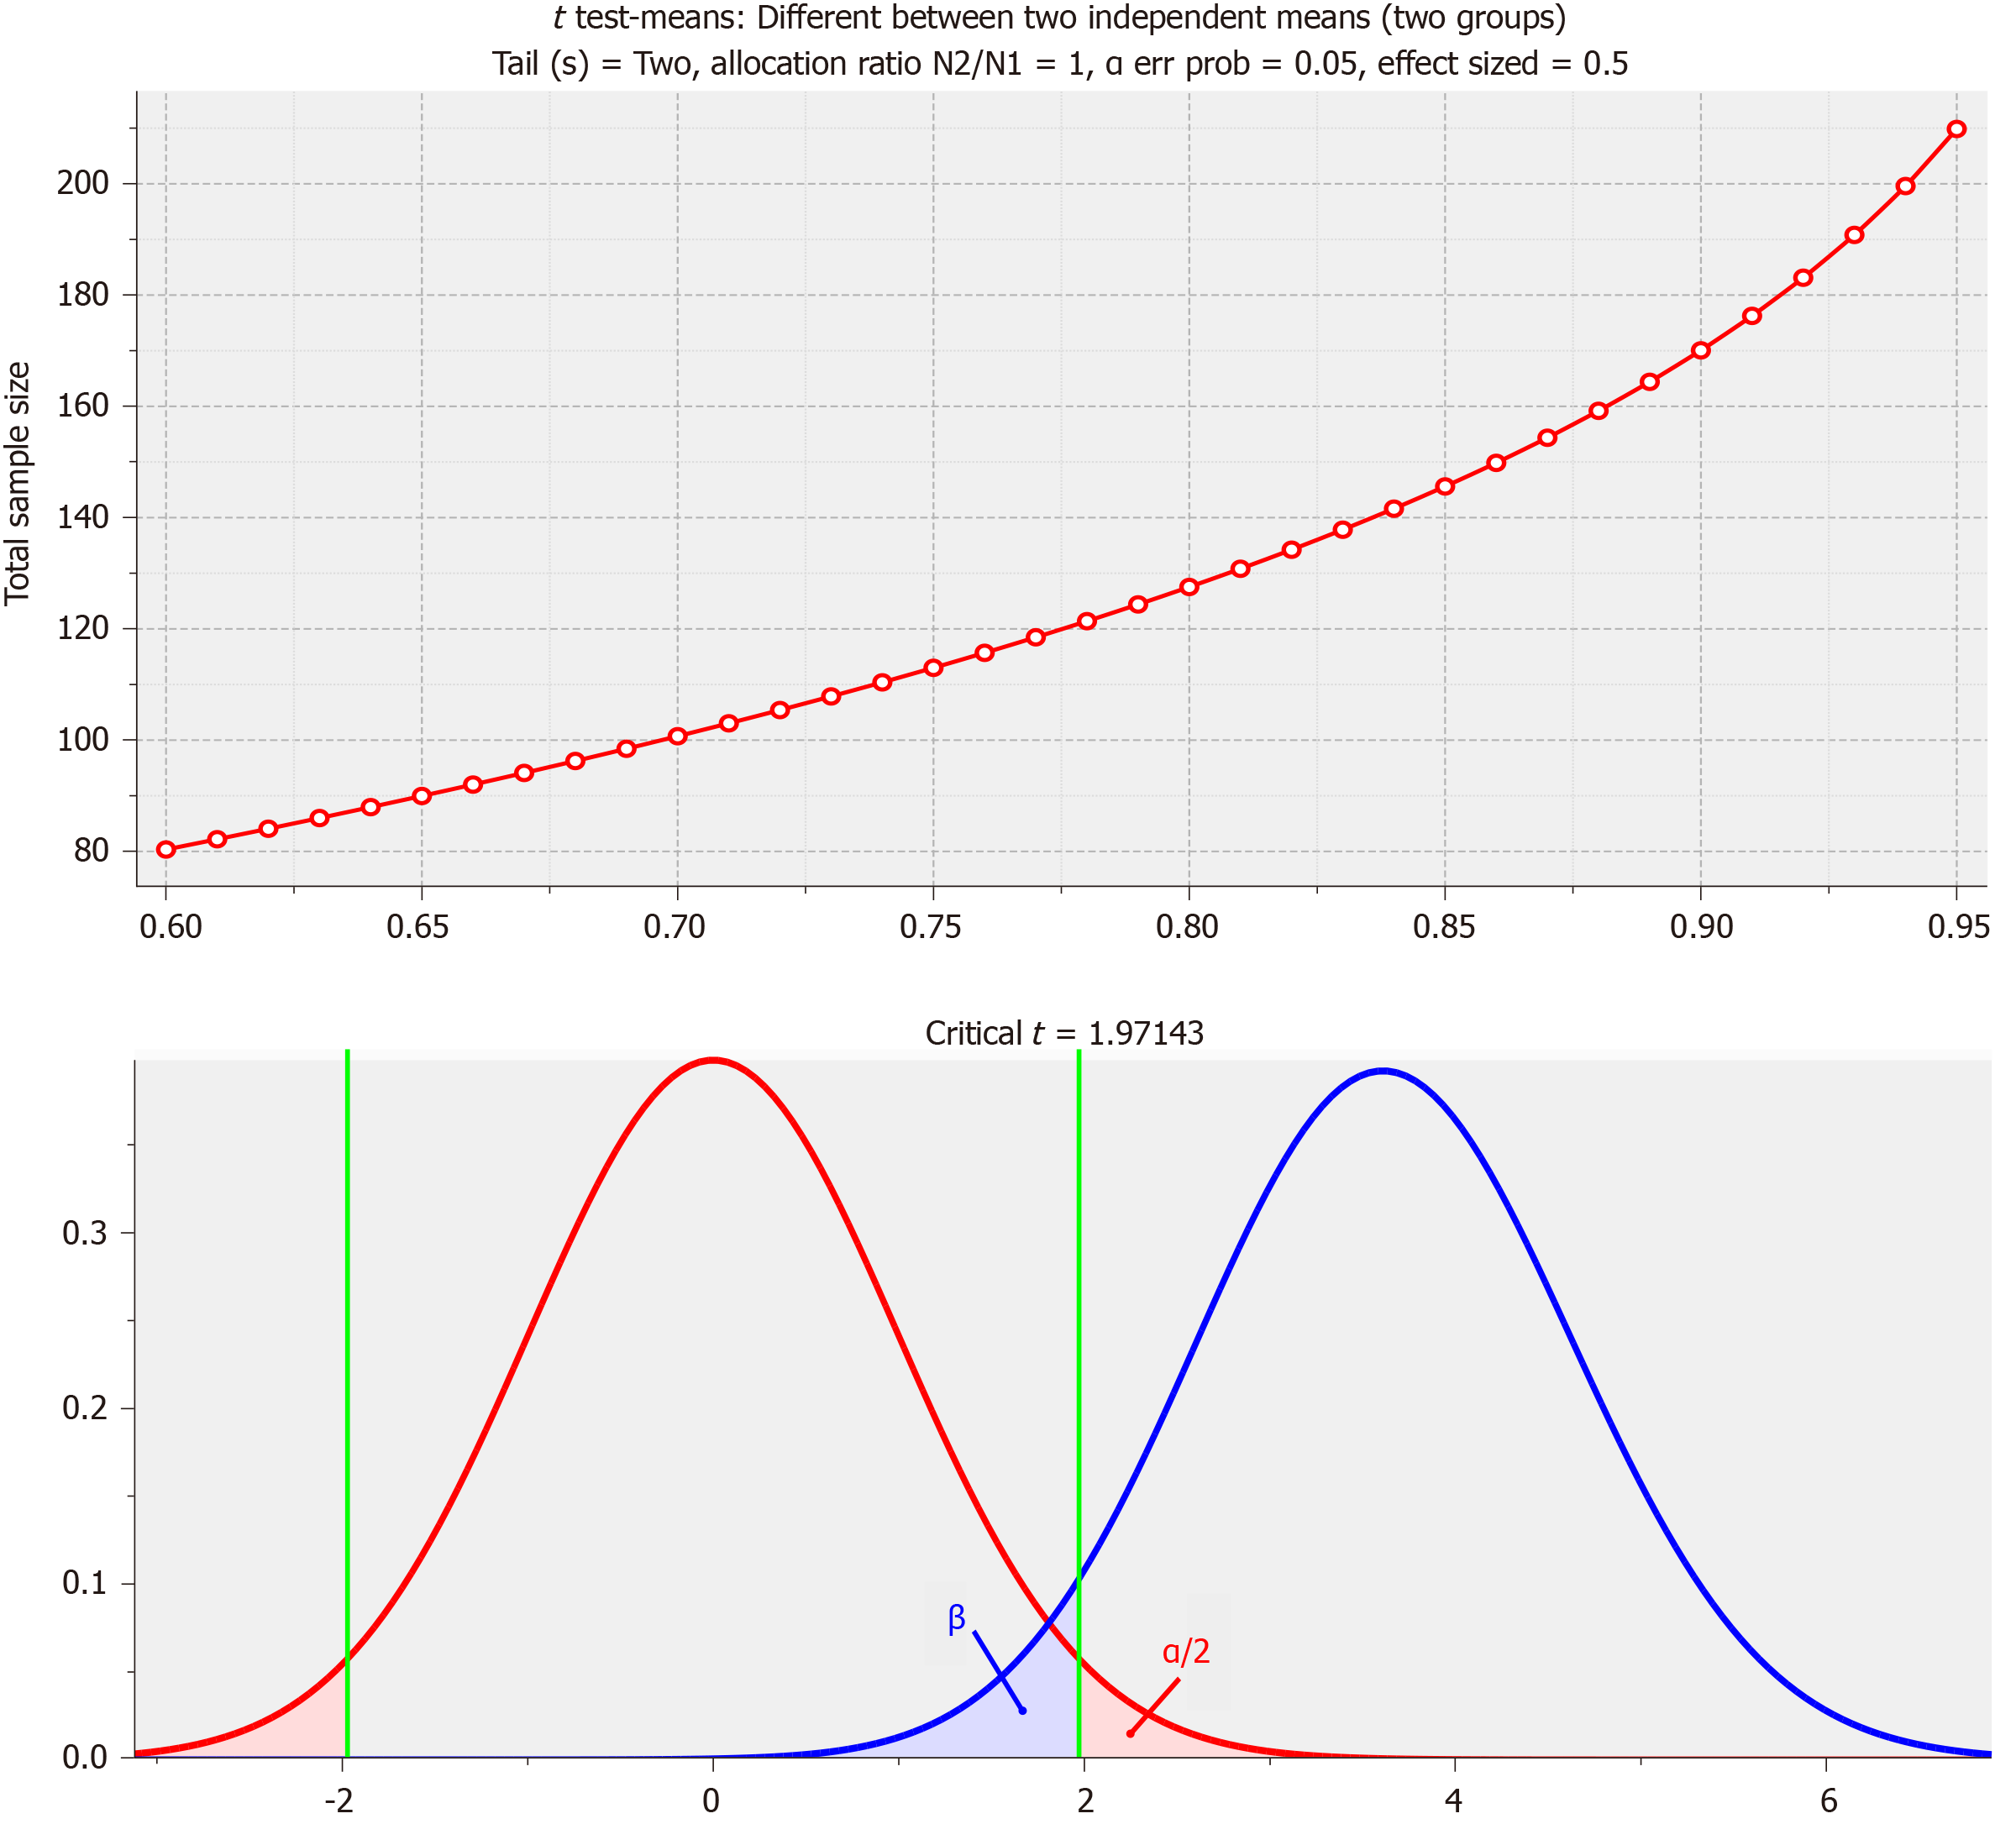
Figure 1 Sample size calculations.
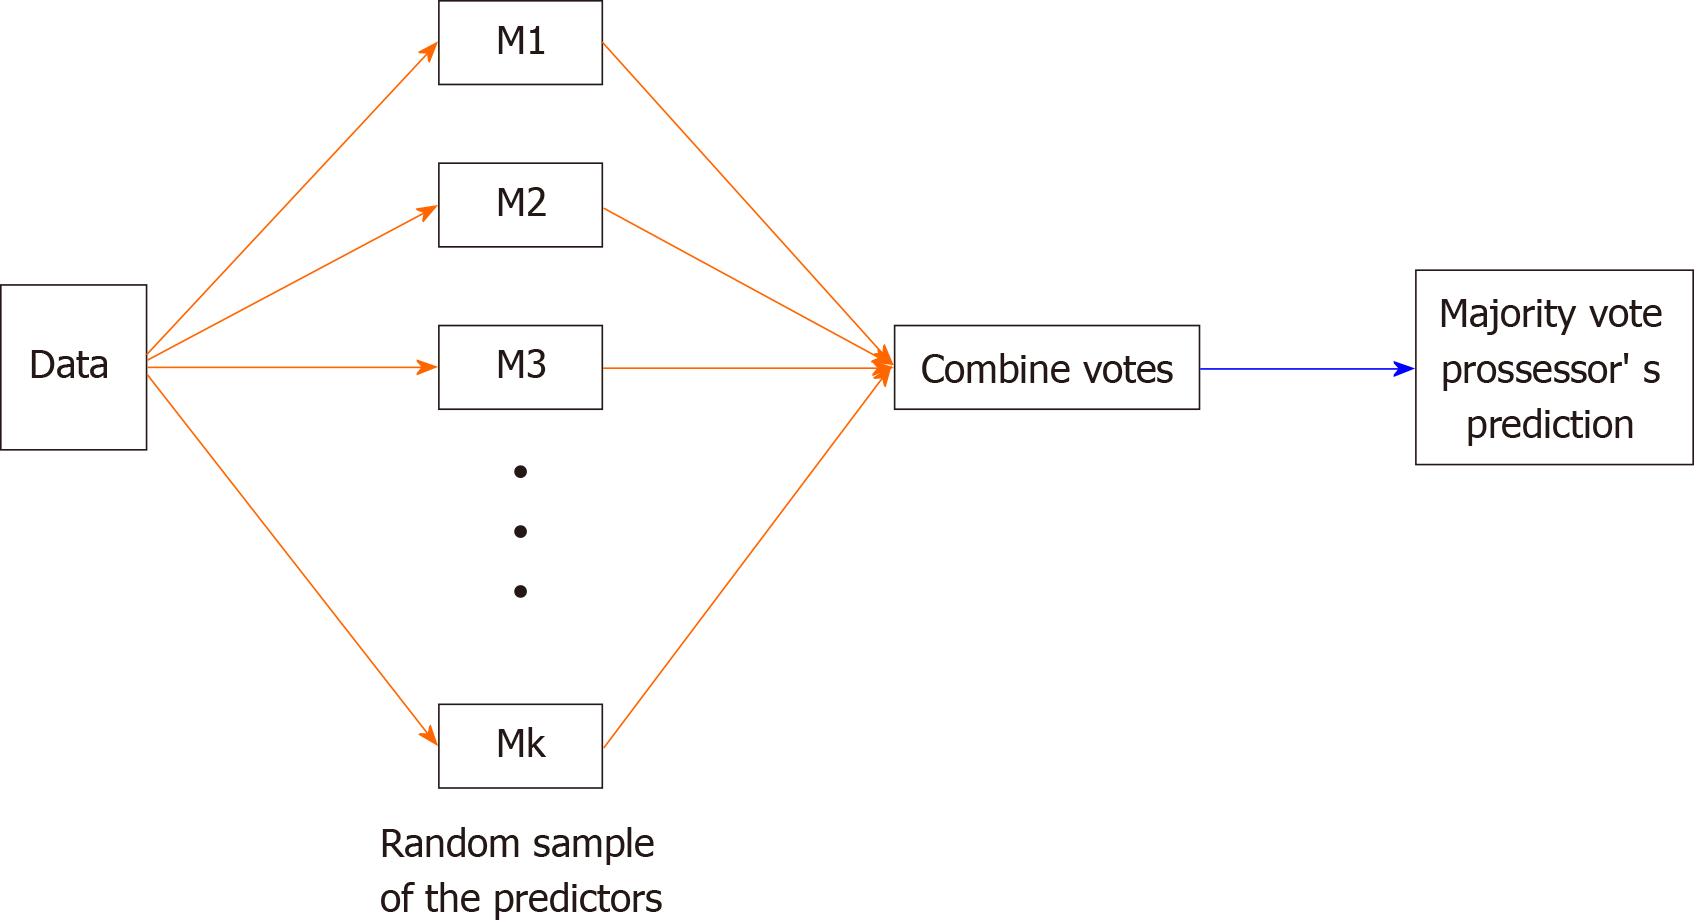
Figure 2 The random forest.
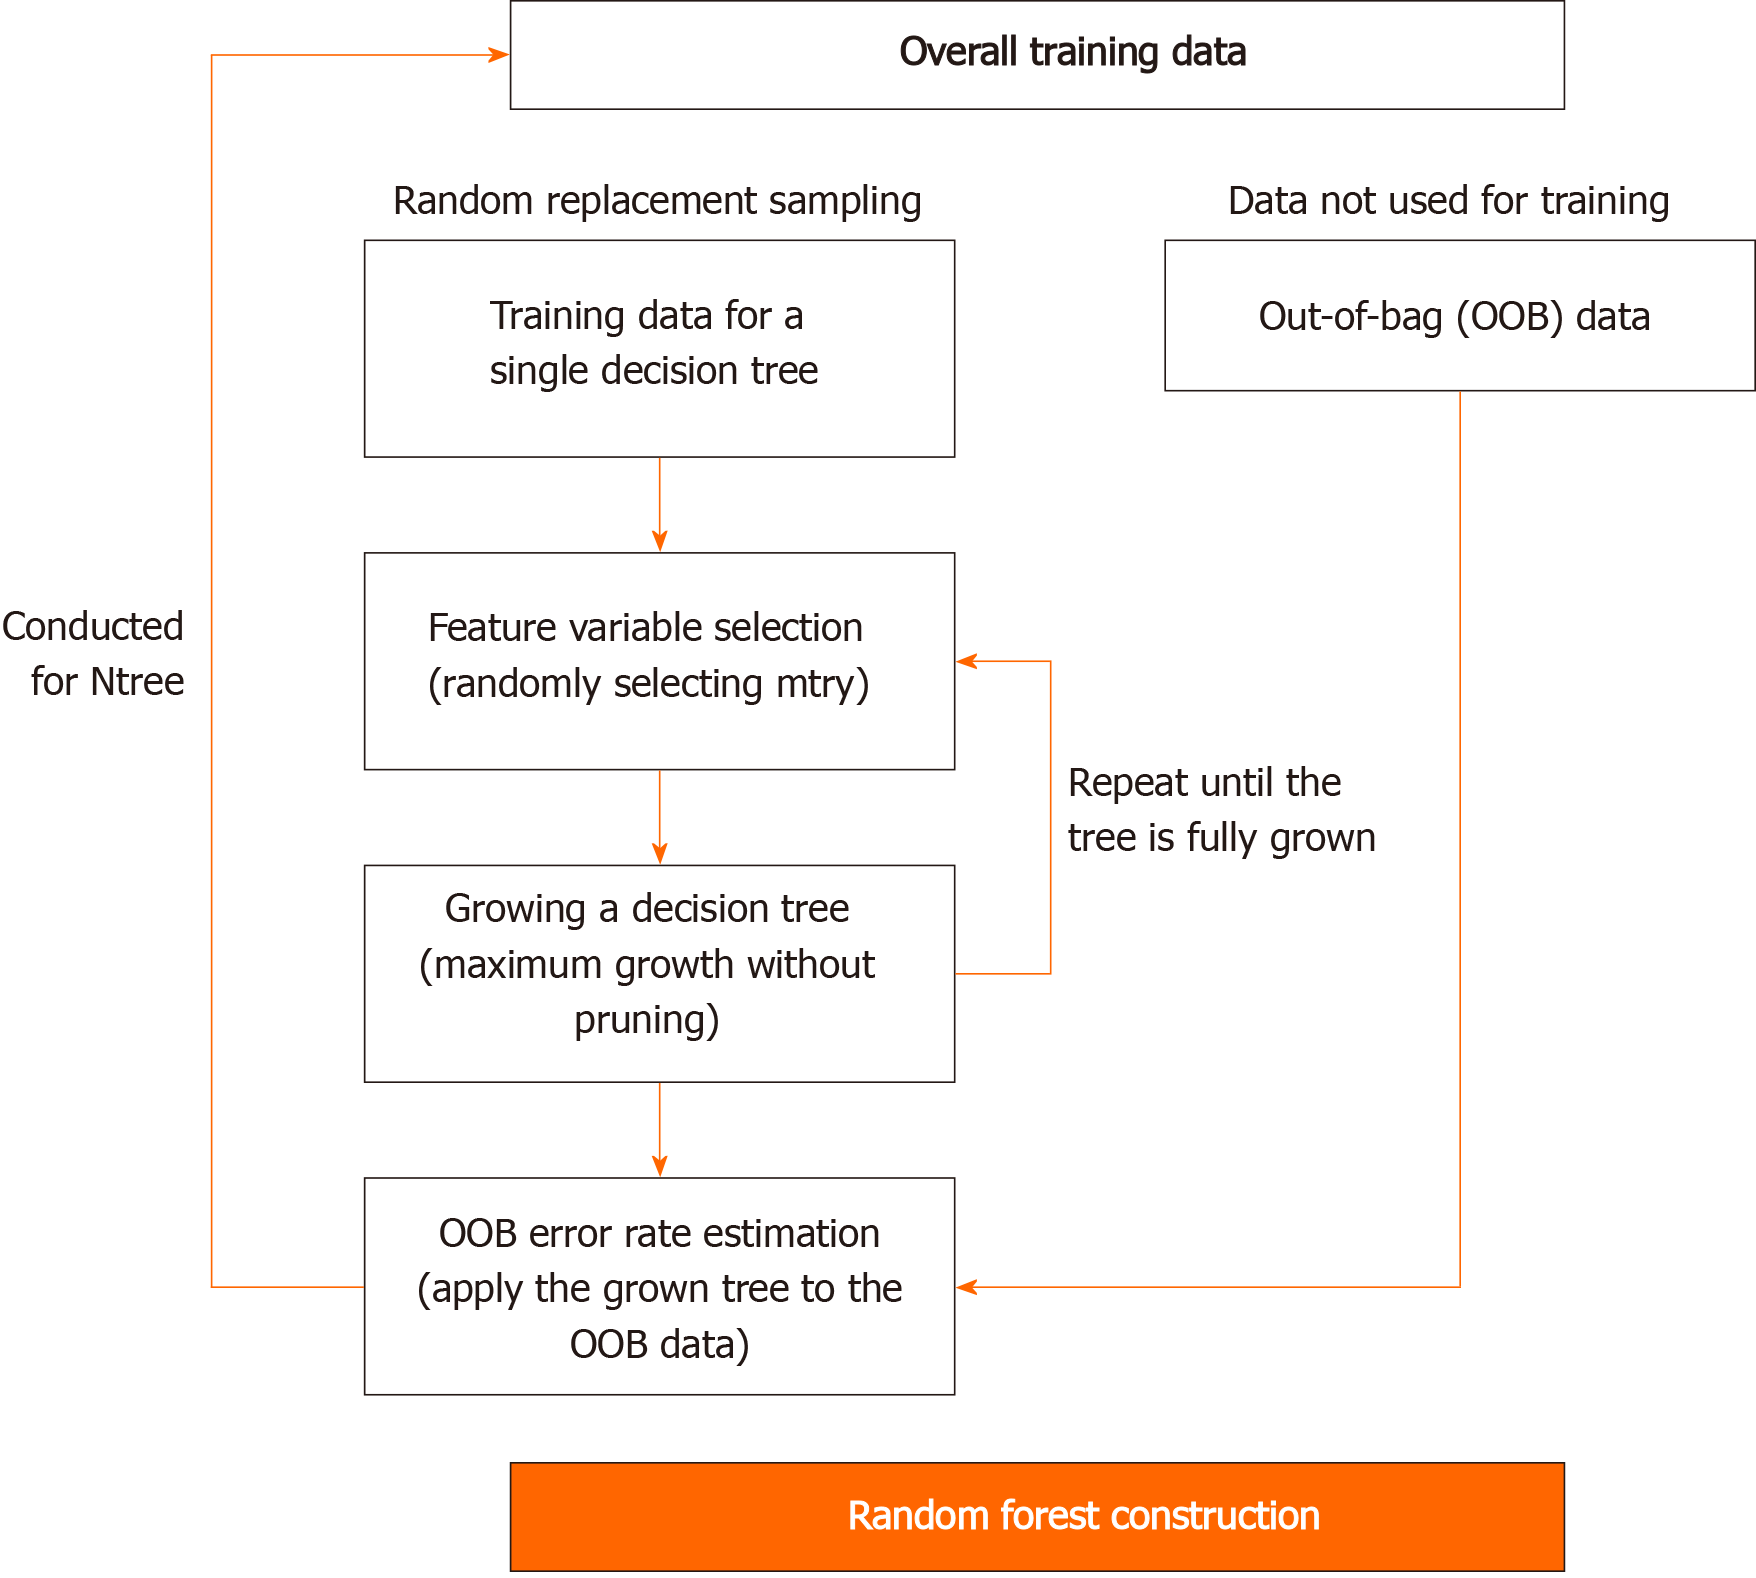
Figure 3 The development process of a random decision forest-based prediction model.
Figure 4 Error rate of the random forest model (500 trees).
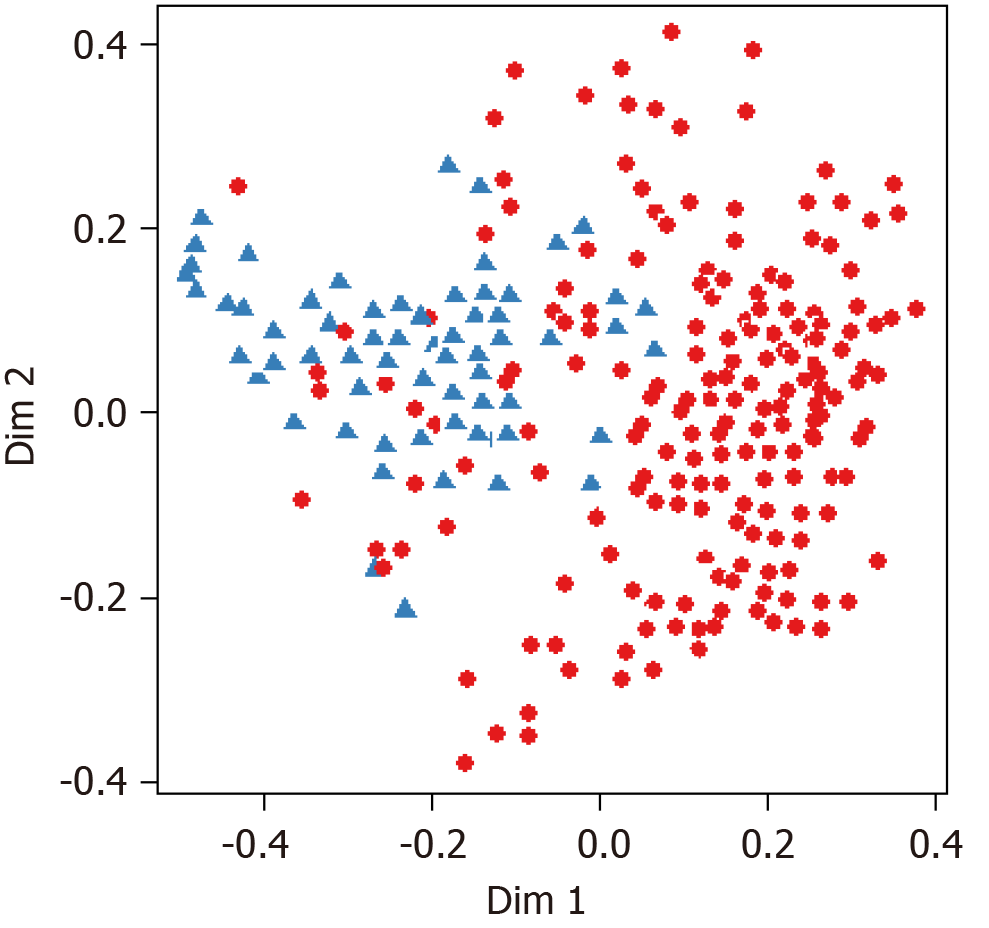
Figure 5 Multidimensional scaling plot of random forest (blue = early-onset Parkinson dementia and red = Parkinson’s disease)
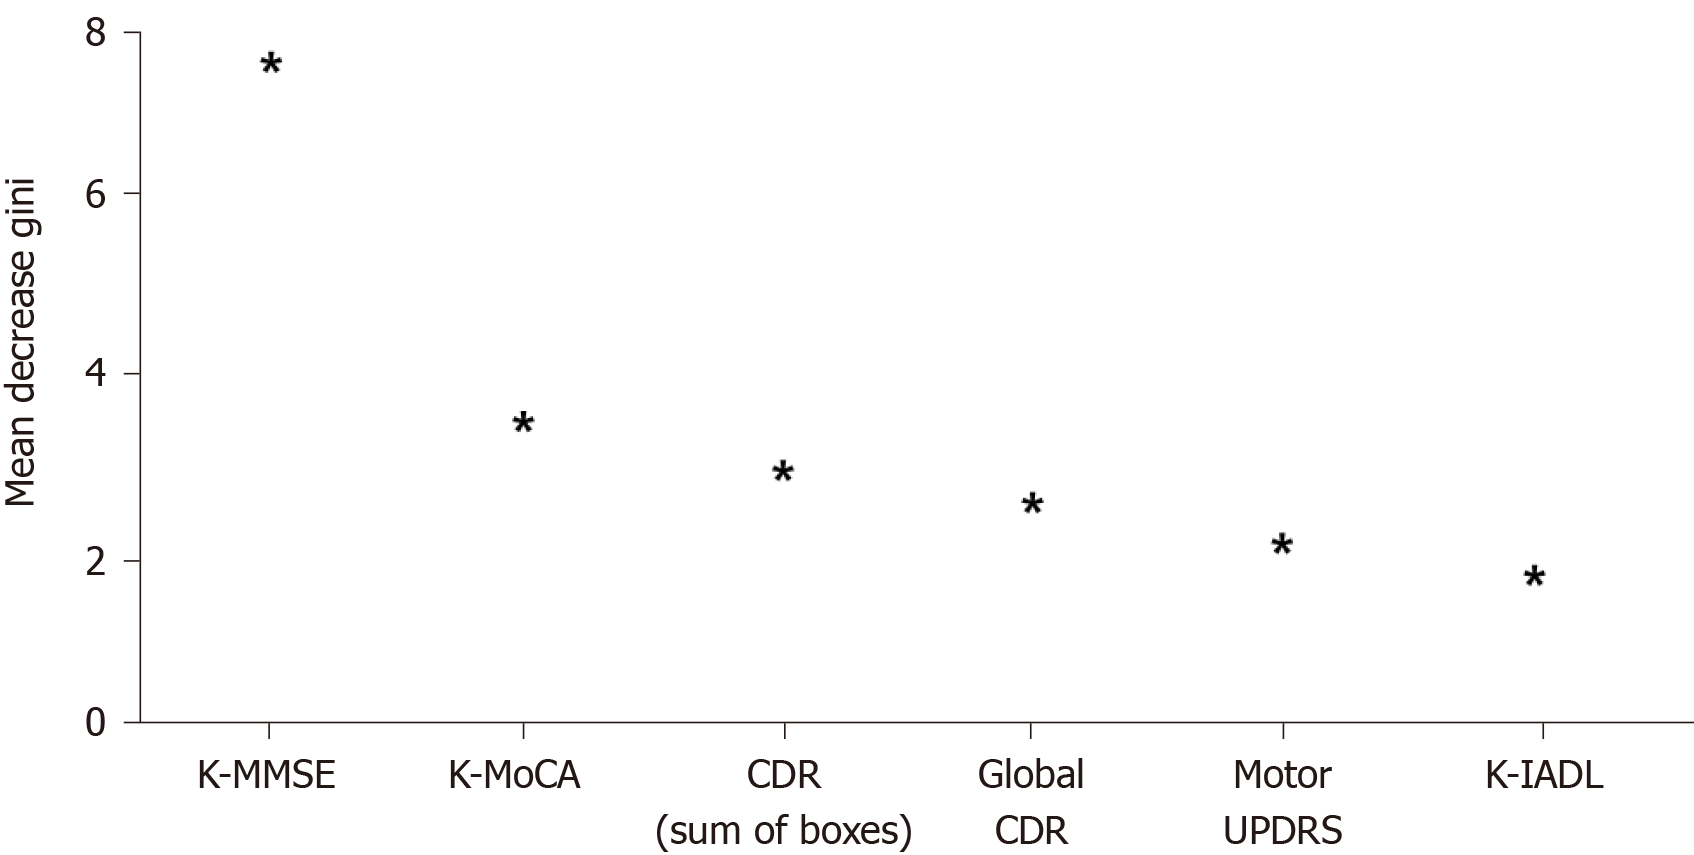
Figure 6 Importance of variables in the random forest-based early-onset Parkinson dementia prediction model (only the top six are presented).
K-MMSE: Korean Mini Mental State Examination; K-MoCA: Korean Montreal Cognitive Assessment; CDR: Clinical Dementia Rating; K-IADL: Korean Instrumental Activities of Daily Living; UPDRS: Score of Untitled Parkinson’s Disease Rating.
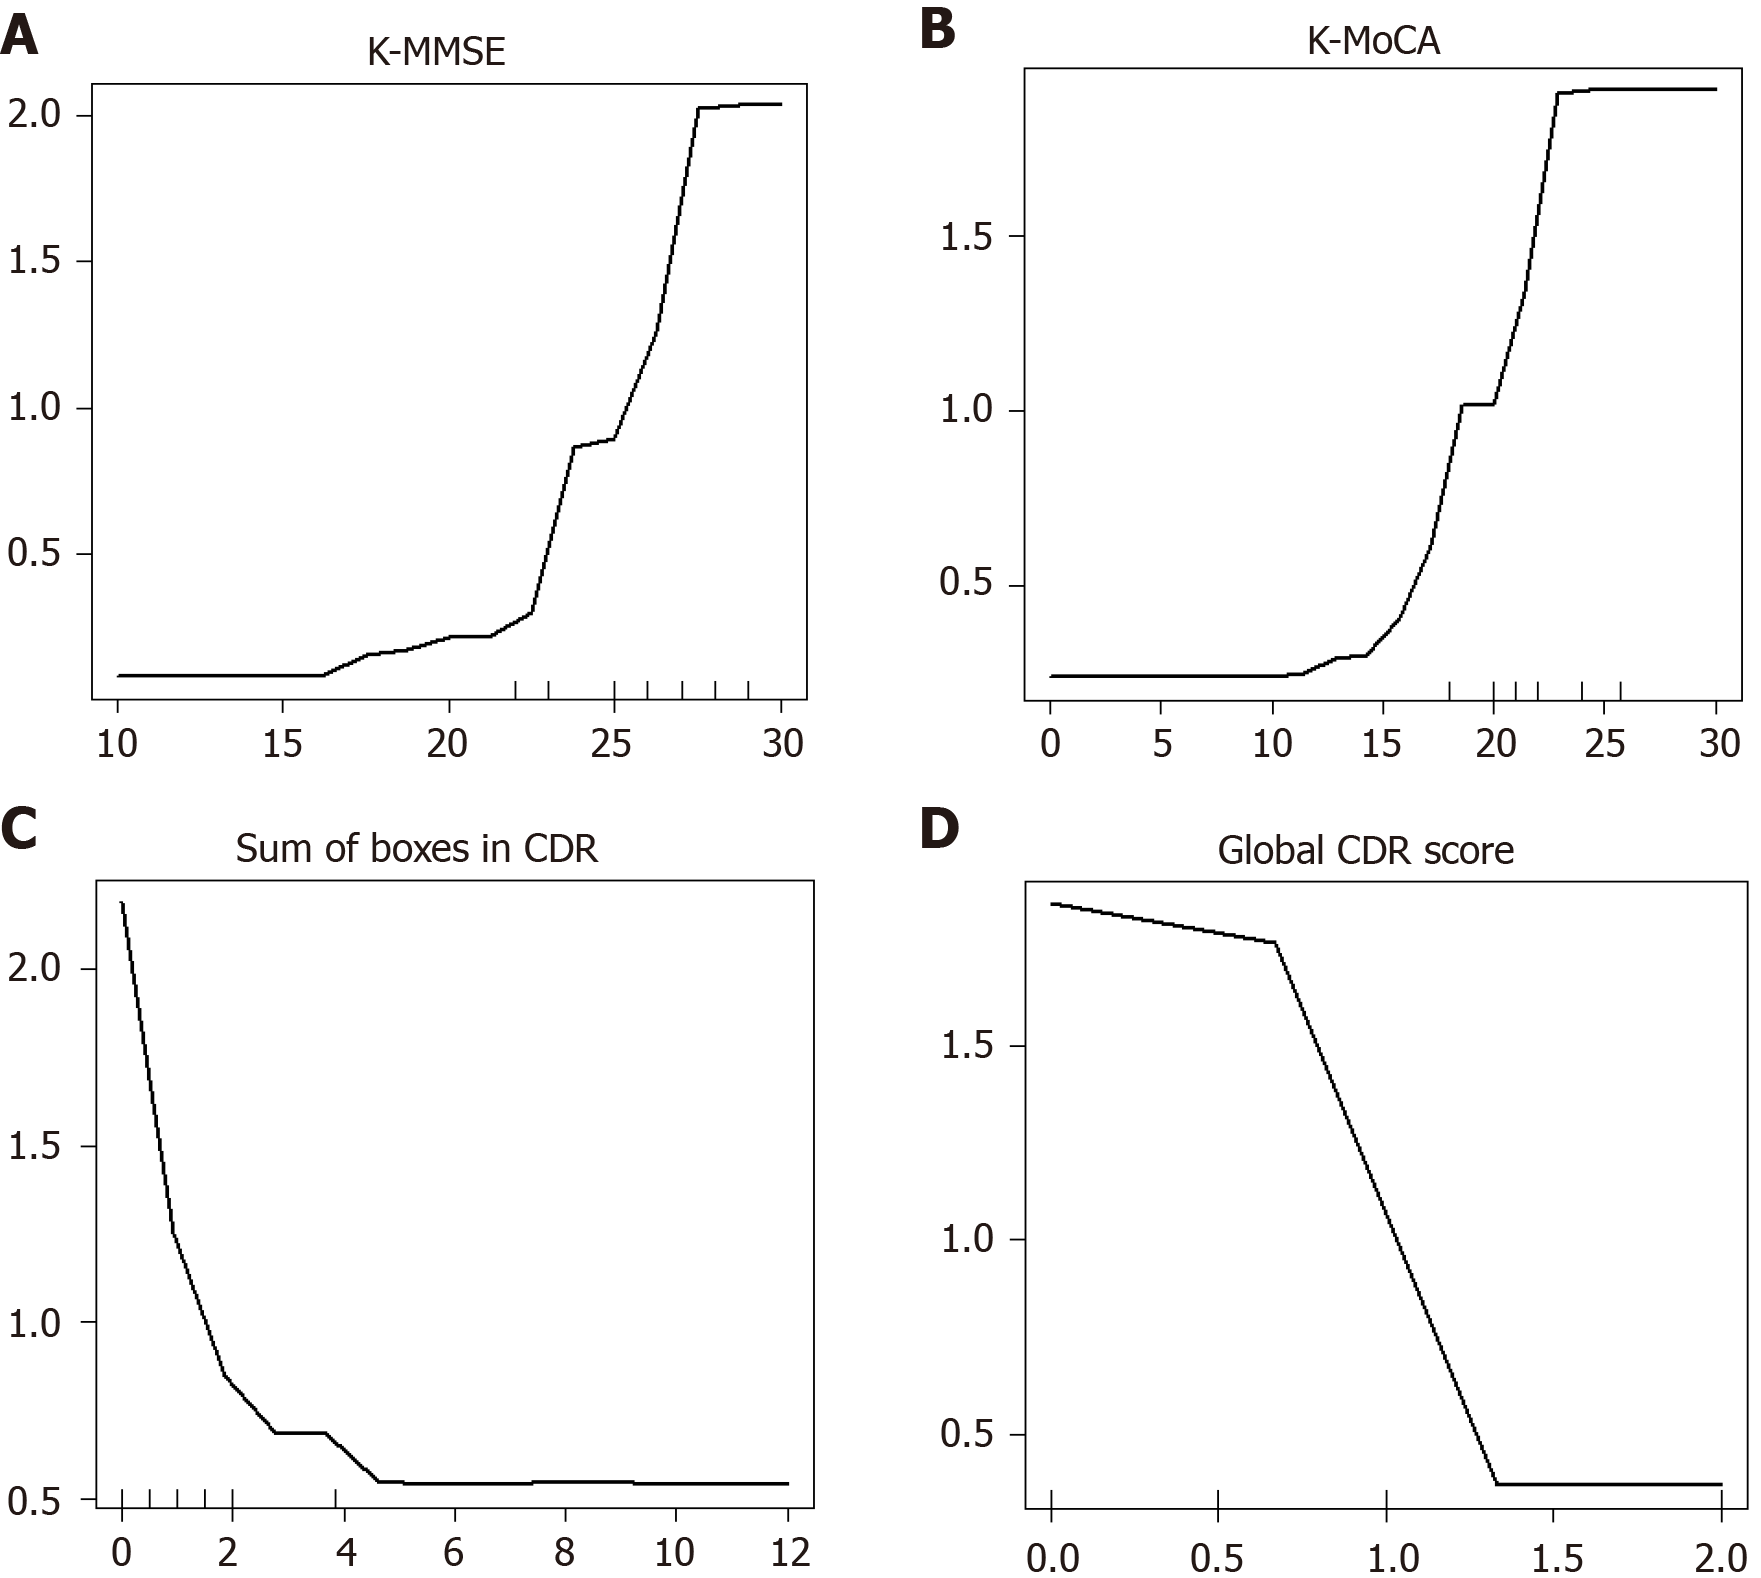
Figure 7 Partial dependence plot.
K-MMSE: Korean Mini Mental State Examination; K-MoCA: Korean Montreal Cognitive Assessment; CDR: Clinical Dementia Rating.
- Citation: Byeon H. Best early-onset Parkinson dementia predictor using ensemble learning among Parkinson's symptoms, rapid eye movement sleep disorder, and neuropsychological profile. World J Psychiatr 2020; 10(11): 245-259
- URL: https://www.wjgnet.com/2220-3206/full/v10/i11/245.htm
- DOI: https://dx.doi.org/10.5498/wjp.v10.i11.245


