Copyright
©The Author(s) 2022.
World J Pharmacol. Nov 28, 2022; 11(3): 27-47
Published online Nov 28, 2022. doi: 10.5497/wjp.v11.i3.27
Published online Nov 28, 2022. doi: 10.5497/wjp.v11.i3.27
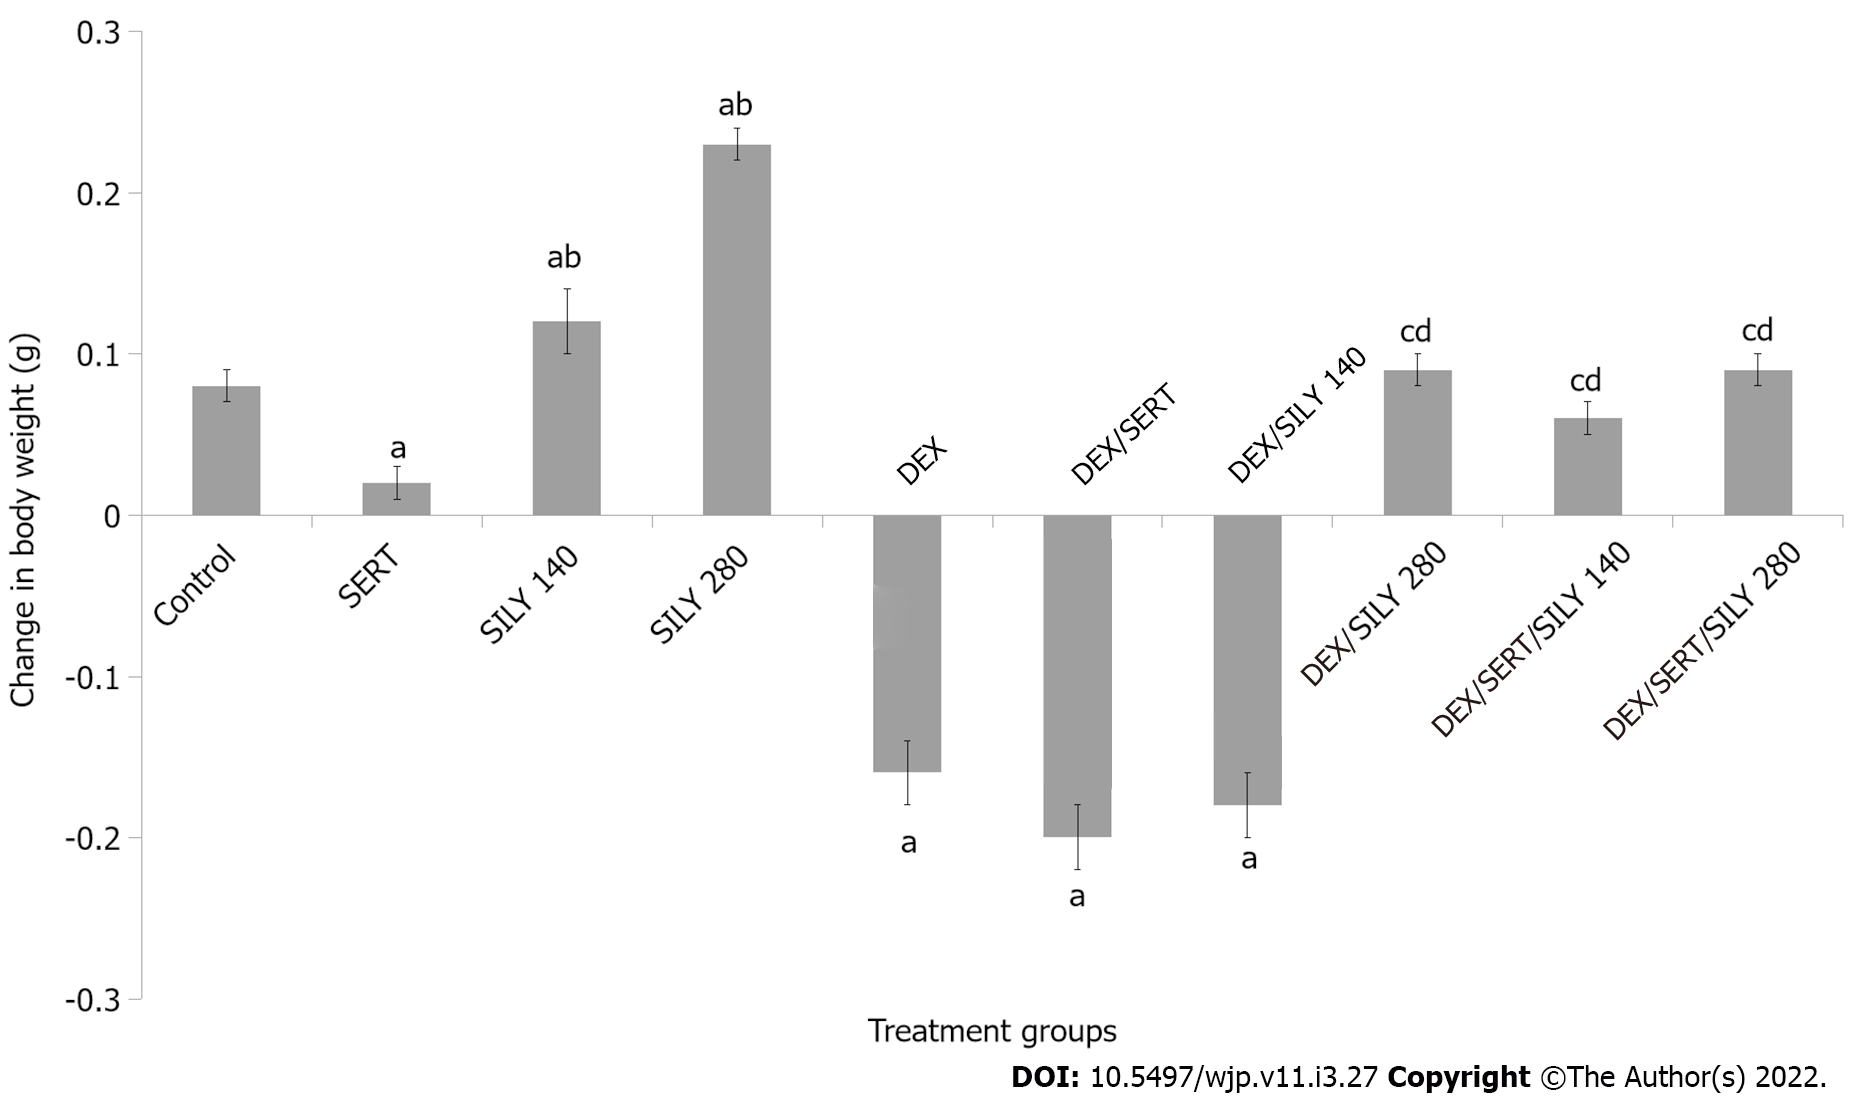
Figure 1 Effect of silymarin on change in body weight.
Each bar represents the mean ± SEM, aP < 0.05 vs control, bP < 0.05 vs SERT, cP < 0.05 vs DEX, dP < 0.05 vs DEX/SERT. SERT: Sertraline; DEX: Dexamethasone; SILY: Silymarin. Number of mice per treatment group = 10.
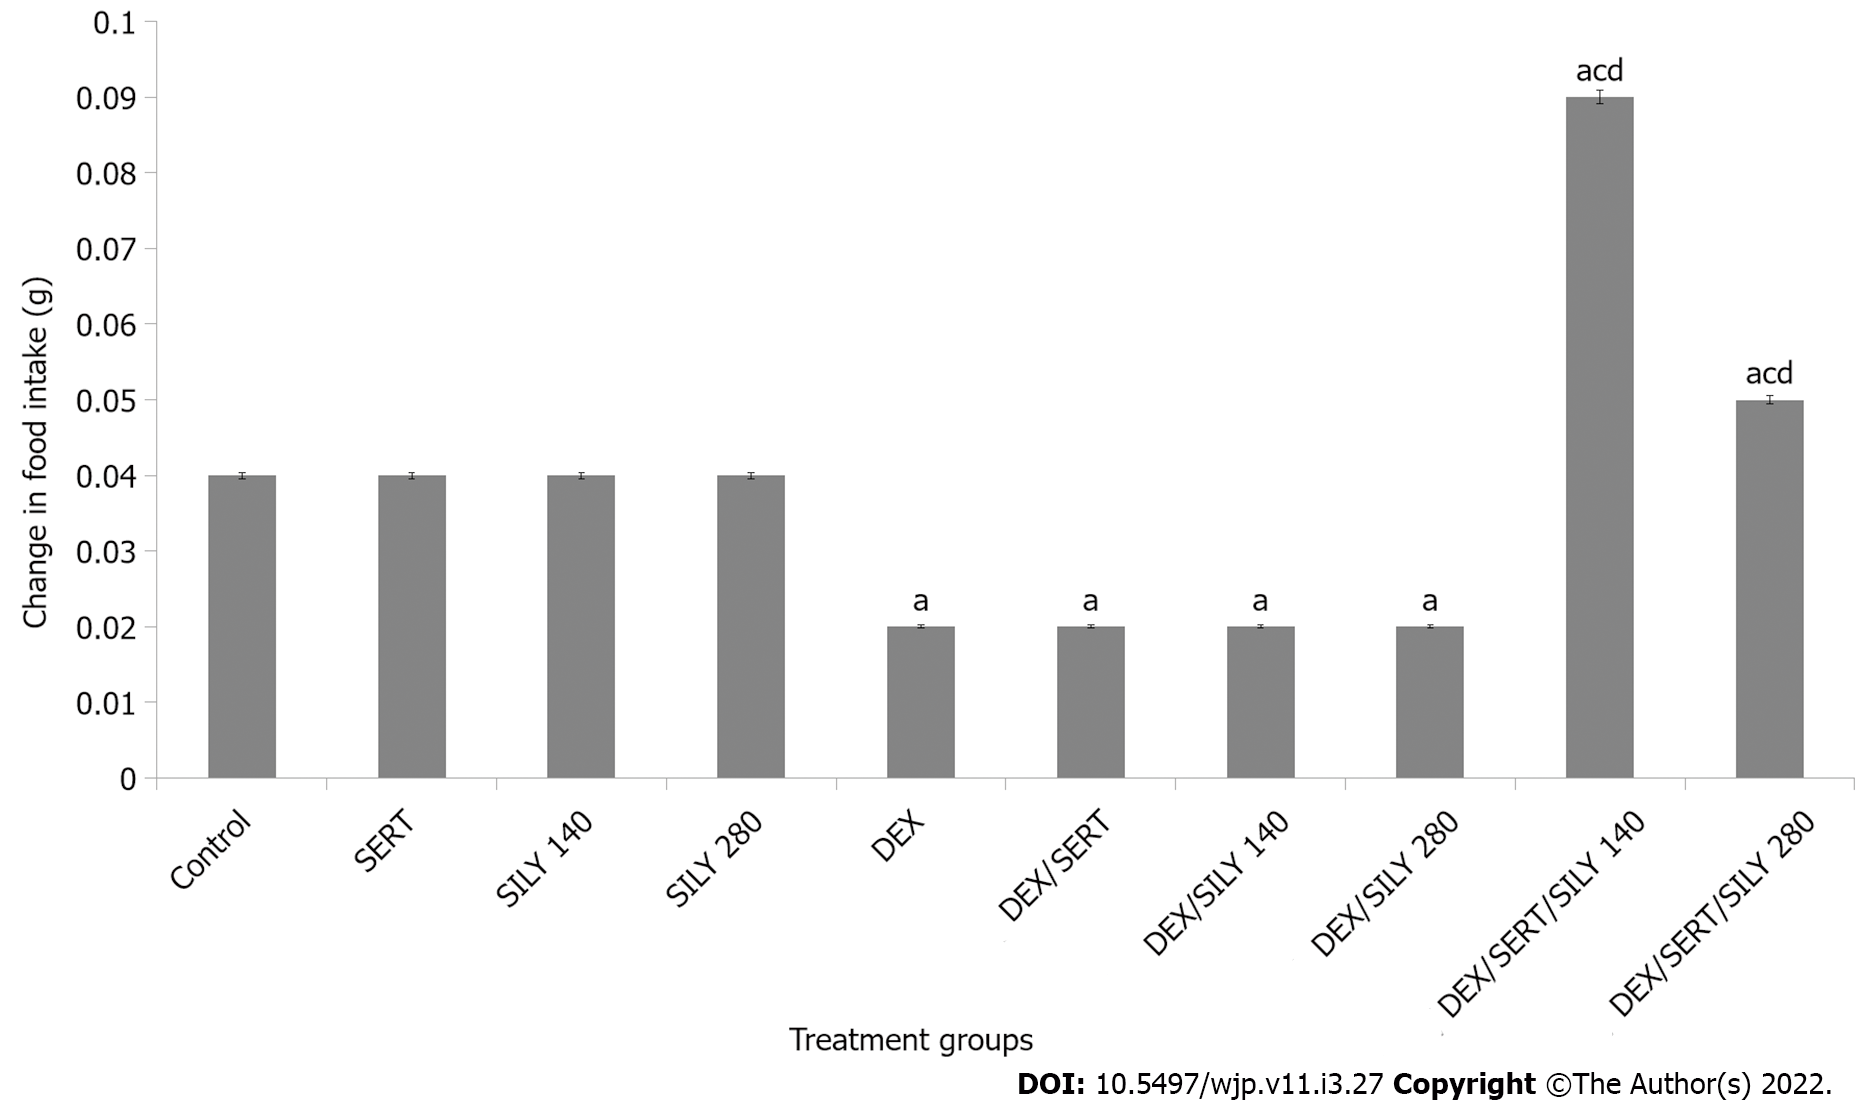
Figure 2 Effect of silymarin on changes in food intake.
Each bar represents the mean ± SEM, aP < 0.05 vs control, bP < 0.05 vs SERT, cP < 0.05 vs DEX, dP < 0.05 vs DEX/SERT. SERT: Sertraline; DEX: Dexamethasone; SILY: Silymarin. Number of mice per treatment group = 10.
Figure 3 Effect of silymarin on locomotor activity (upper panel) and rearing activity (lower panel).
Each bar represents the mean ± SEM, aP < 0.05 vs control, bP < 0.05 vs SERT, cP < 0.05 vs DEX, dP < 0.05 vs DEX/SERT. SERT: Sertraline; DEX: Dexamethasone; SILY: Silymarin. Number of mice per treatment group = 10.
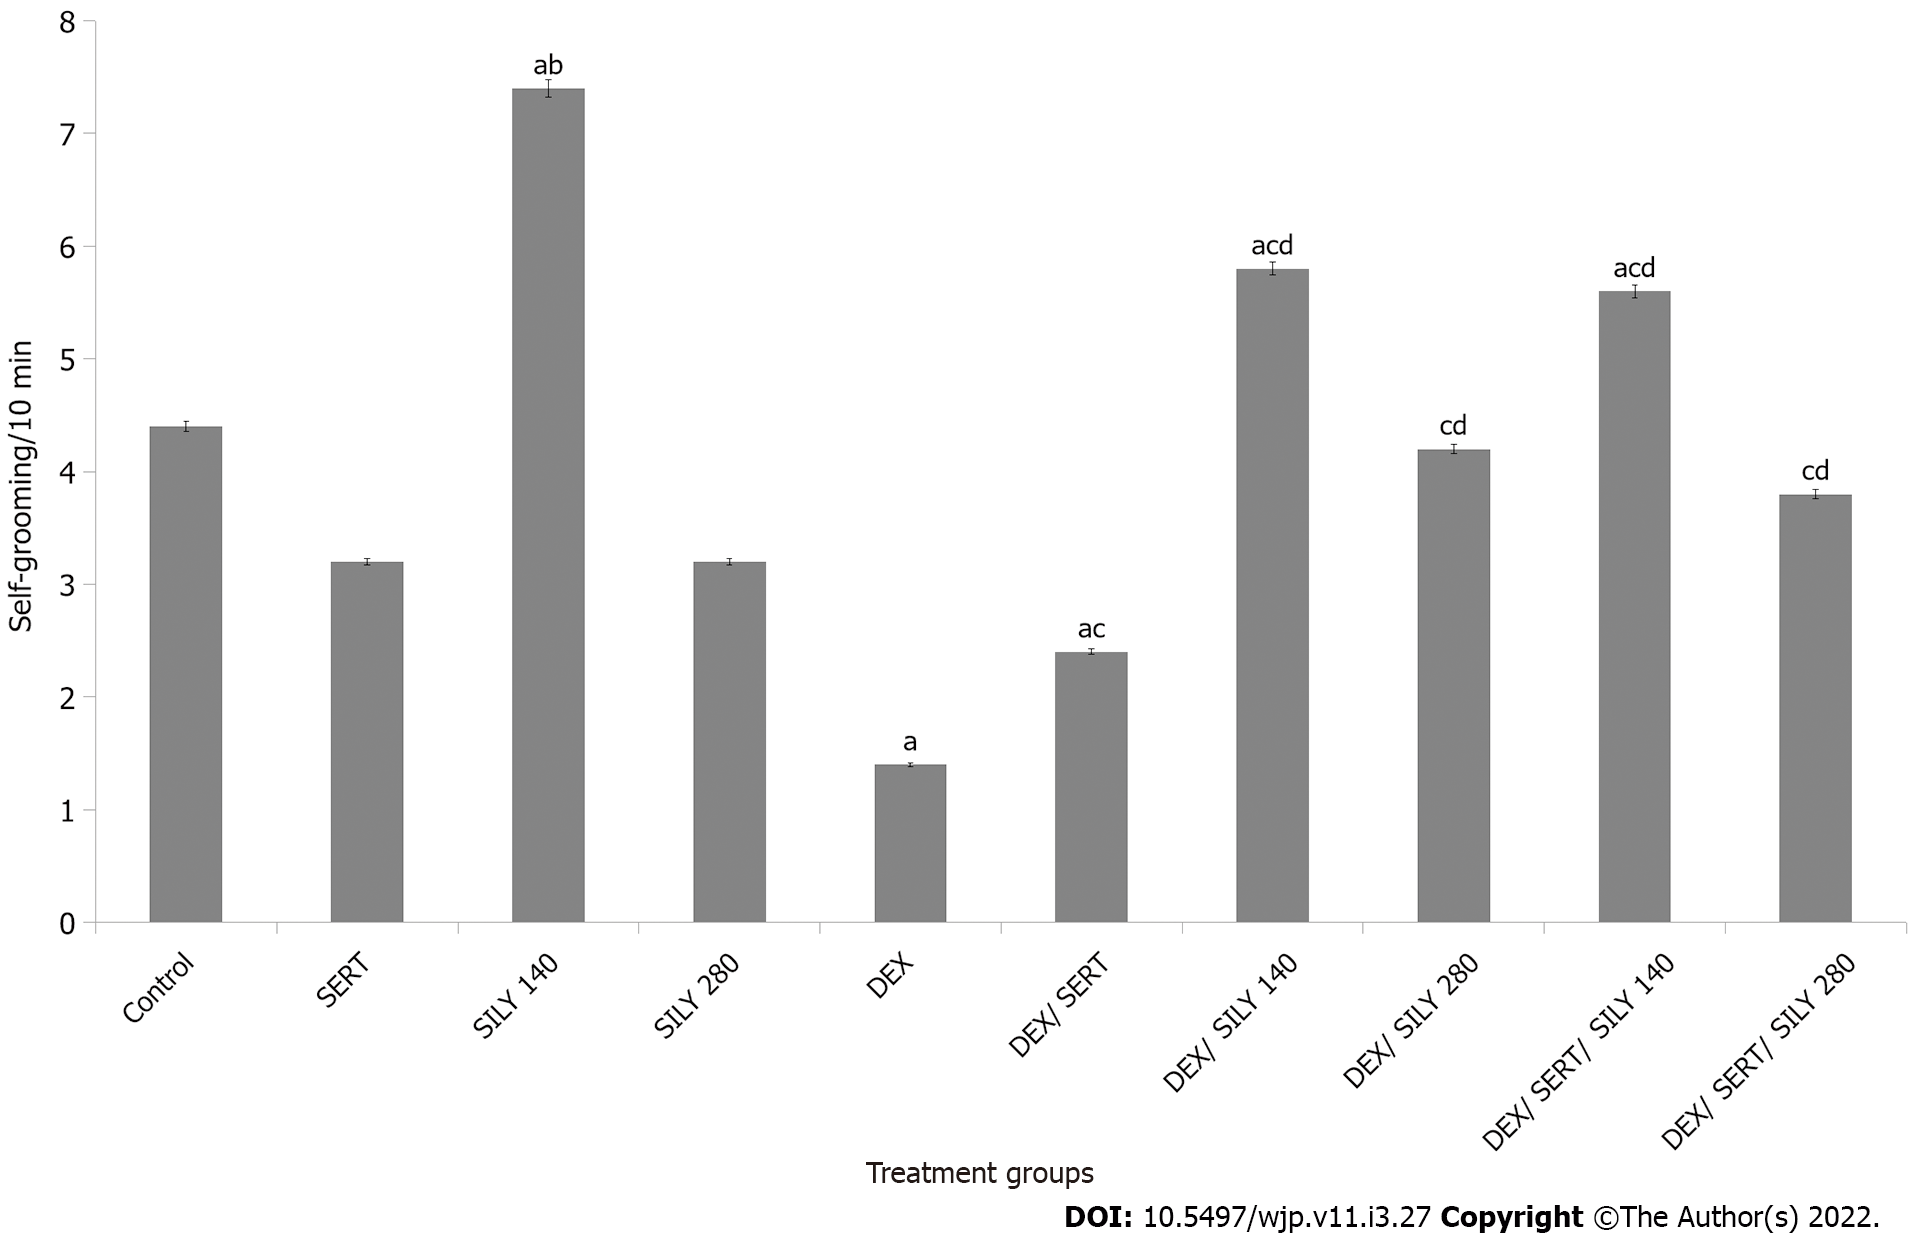
Figure 4 Effect of silymarin on self-grooming.
Each bar represents the mean ± SEM, cP < 0.05 vs control, bP < 0.05 vs SERT, cP < 0.05 vs DEX, dP < 0.05 vs DEX/SERT. SERT: Sertraline; DEX: Dexamethasone; SILY: Silymarin. Number of mice per treatment group = 10.
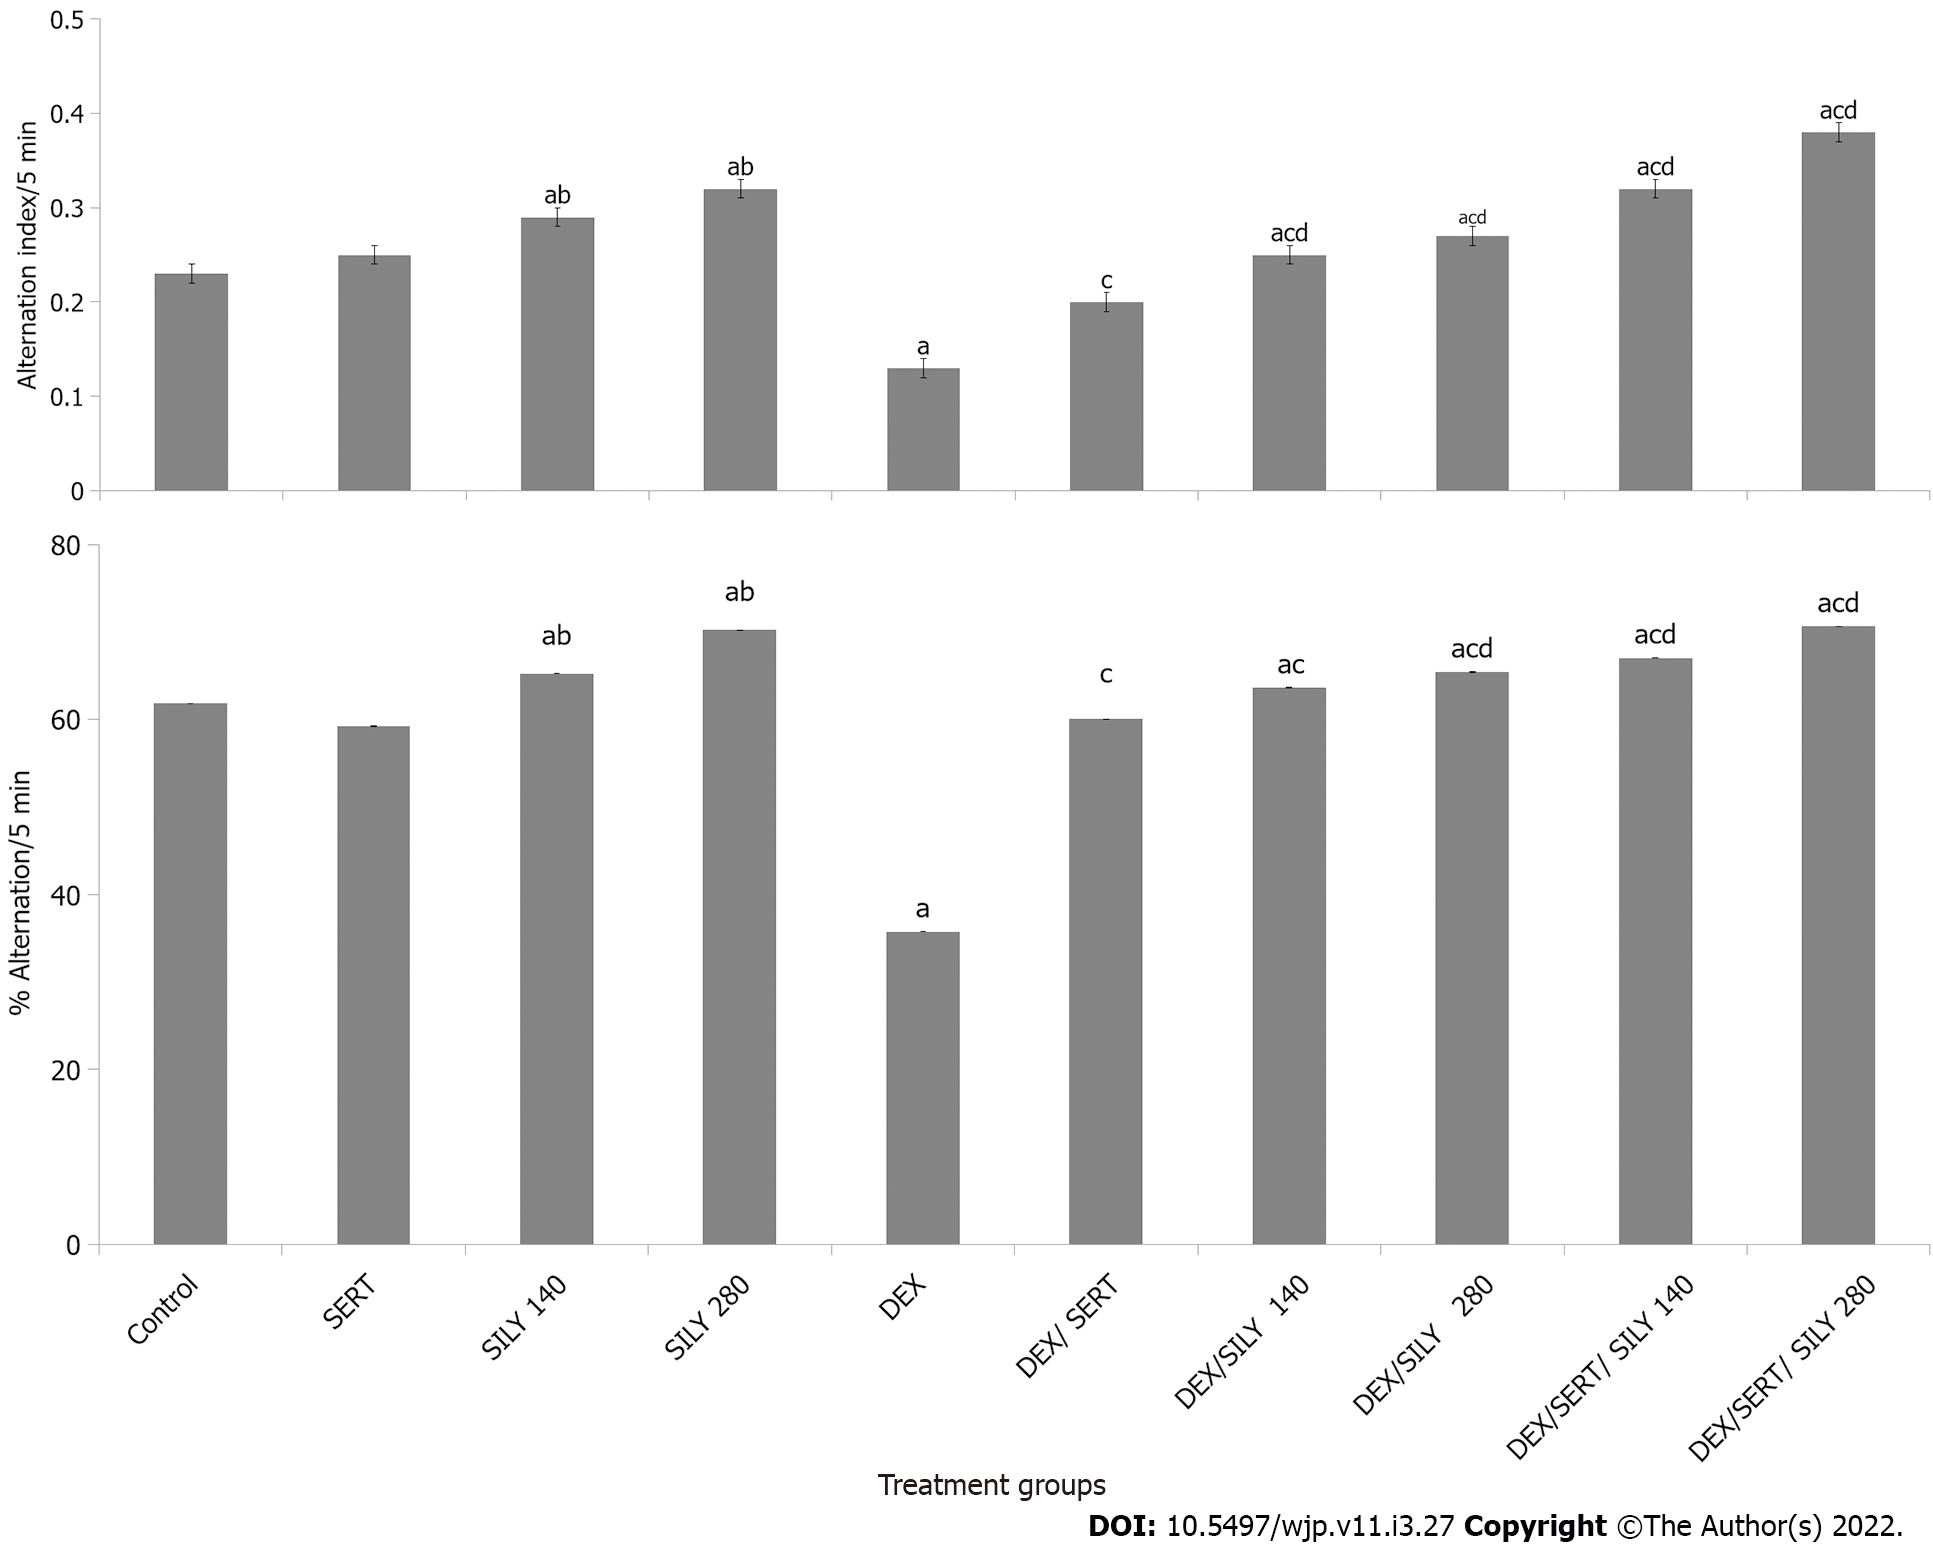
Figure 5 Effect of silymarin on radial arm maze (upper panel) and Y–maze (lower panel) spatial working memory.
Each bar represents the mean ± SEM, aP < 0.05 vs control, bP < 0.05 vs SERT, cP < 0.05 vs DEX, dP < 0.05 vs DEX/SERT. SERT: Sertraline; DEX: Dexamethasone; SILY: Silymarin. Number of mice per treatment group = 10.
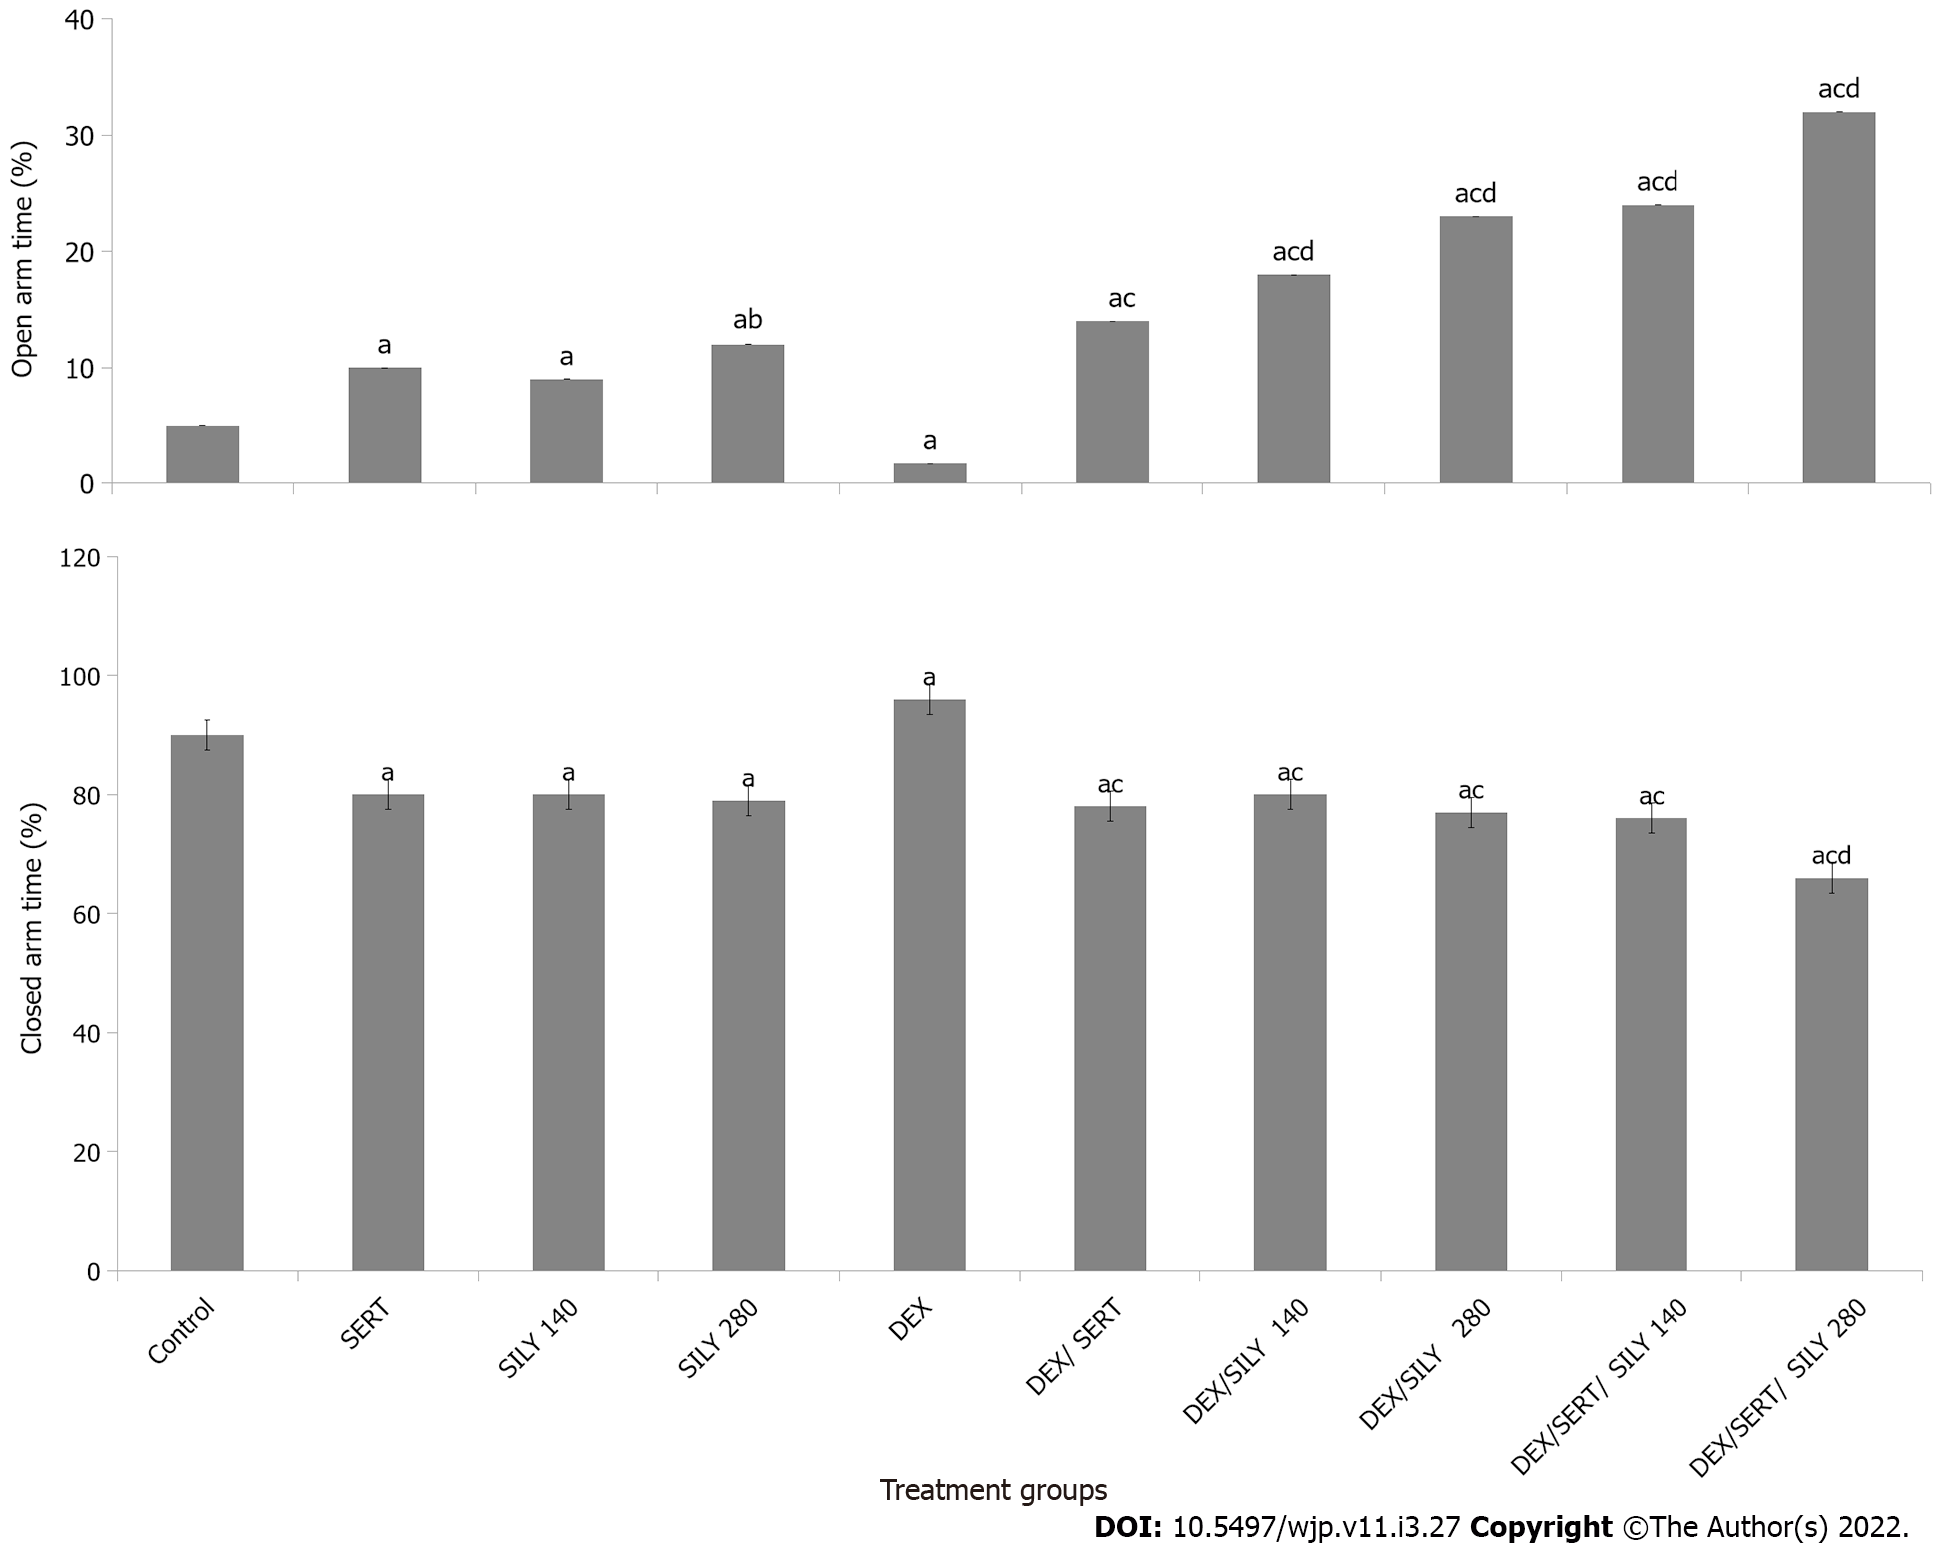
Figure 6 Effect of silymarin on time spent in the open-arm (upper panel) and closed arm (lower panel) of the elevated plus maze.
Each bar represents the mean ± SEM, aP < 0.05 vs control, bP < 0.05 vs SERT, cP < 0.05 vs DEX, dP < 0.05 vs DEX/SERT. SERT: Sertraline; DEX: Dexamethasone; SILY: Silymarin. Number of mice per treatment group = 10.
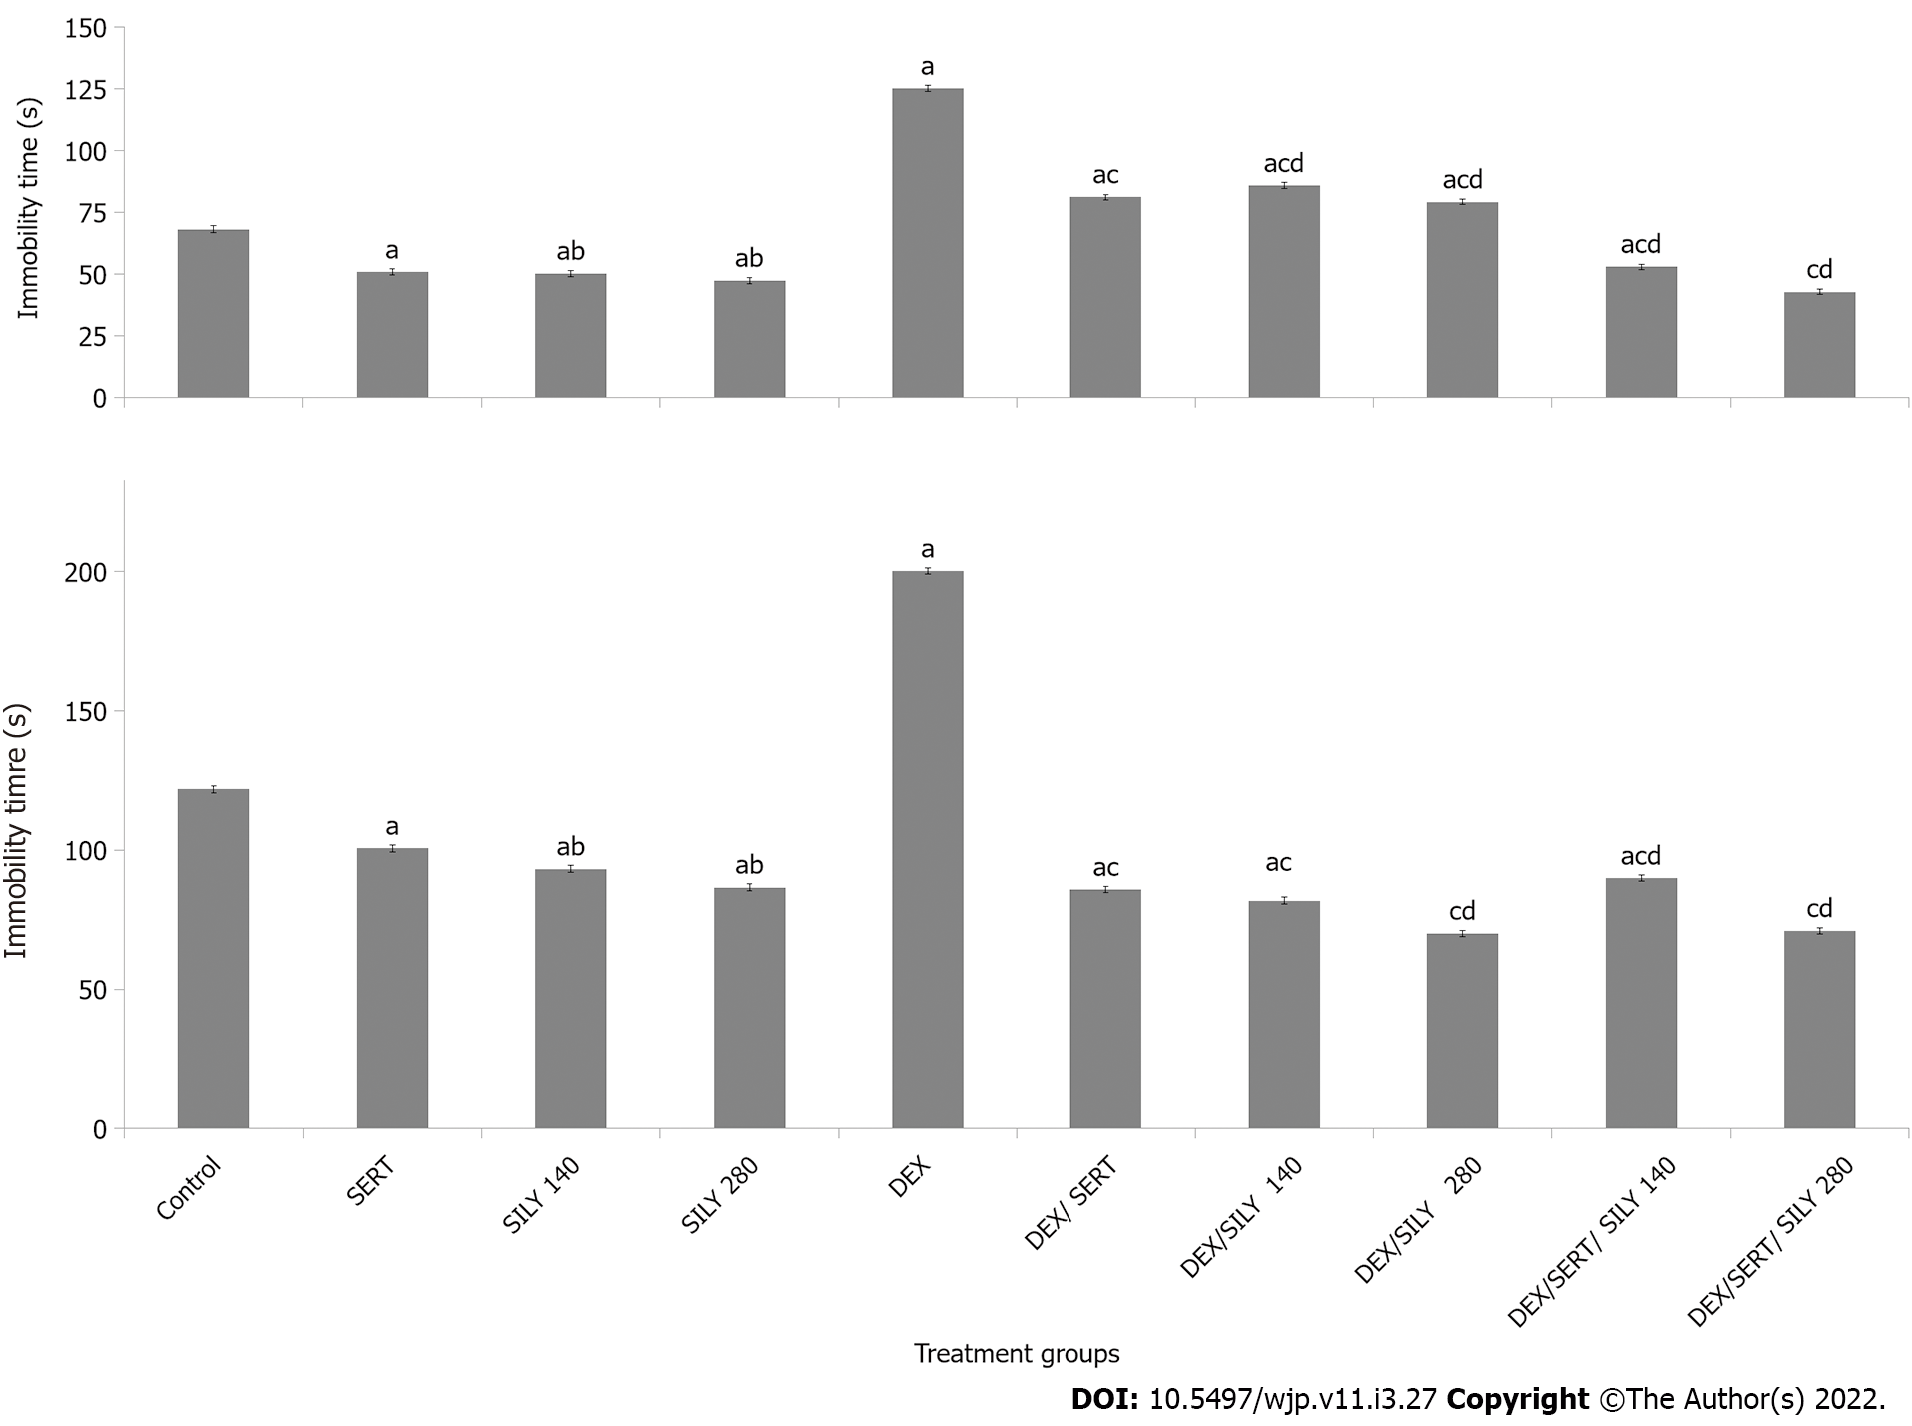
Figure 7 Effect of silymarin on immobility time in the tail suspension (upper panel) and forced swim (lower panel) tests.
Each bar represents the mean ± SEM, aP < 0.05 vs control, bP < 0.05 vs SERT, cP < 0.05 vs DEX, dP < 0.05 vs DEX/SERT. SERT: Sertraline; DEX: Dexamethasone; SILY: Silymarin. Number of mice per treatment group = 10.
Figure 8 Effect of silymarin on histomorphology of the cerebral cortex.
Photomicrographs show pyramidal cells, granule cells, and neuroglia. A: Vehicle; B: Sertraline C: Silymarin at 140mg/kg of food; D: Silymarin at 280 mg/kg of food; E: Dexamethasone, F: Dexamethasone and sertraline G: Dexamethasone and silymarin at 140; H: Dexamethasone and silymarin at 280; I: Dexamethasone, sertraline and silymarin at 140; J: Dexamethasone, sertraline and silymarin at 280. de-Pc: Degenerating pyramidal cells; de- Gc: Degenerating granule cells; de-Ng: Degenerating neuroglia; Gc: Granule cells; Pc: Pyramidal cells; Ng: Neuroglia. Number of mice per treatment group = 5.
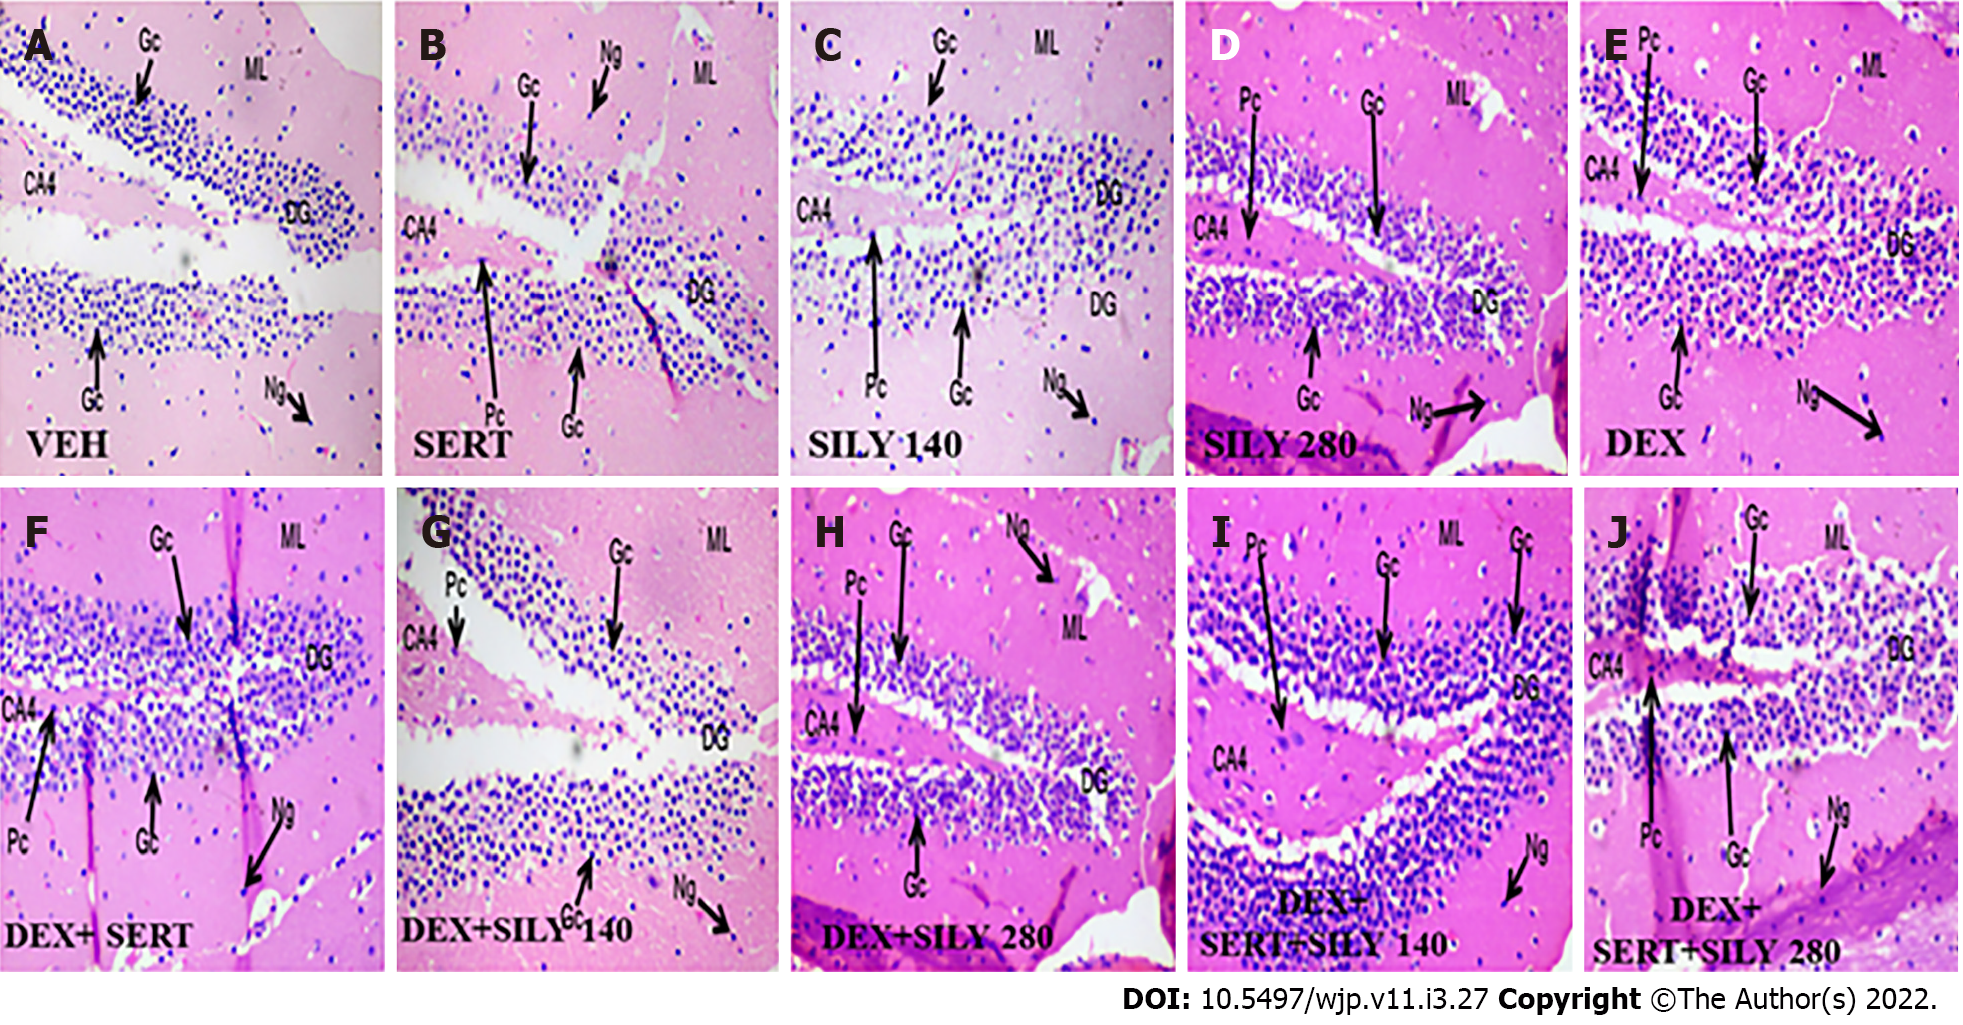
Figure 9 Effect of silymarin on histomorphology of the dentate gyrus of the hippocampus.
Photomicrographs show small pyramidal cells, small granule cells within the dentate gyrus proper, and neuroglia scattered within the molecular layer. A: Vehicle; B: Sertraline; C: Silymarin at 140mg/kg of food; D: Silymarin at 280 mg/kg of food E: Dexamethasone; F: Dexamethasone and sertraline; G: Dexamethasone and silymarin at 140; H: Dexamethasone and silymarin at 280; I: Dexamethasone, sertraline and silymarin at 140; J: Dexamethasone, sertraline and silymarin at 280. Gc: Granule cells; Pc: Pyramidal cells; Ng: Neuroglia; ML: Molecular layer. Number of mice per treatment group = 5.
- Citation: Onaolapo AY, Sulaiman H, Olofinnade AT, Onaolapo OJ. Antidepressant-like potential of silymarin and silymarin-sertraline combination in mice: Highlighting effects on behaviour, oxidative stress, and neuroinflammation. World J Pharmacol 2022; 11(3): 27-47
- URL: https://www.wjgnet.com/2220-3192/full/v11/i3/27.htm
- DOI: https://dx.doi.org/10.5497/wjp.v11.i3.27


