Copyright
©The Author(s) 2023.
World J Med Genet. Jun 2, 2023; 11(2): 8-20
Published online Jun 2, 2023. doi: 10.5496/wjmg.v11.i2.8
Published online Jun 2, 2023. doi: 10.5496/wjmg.v11.i2.8
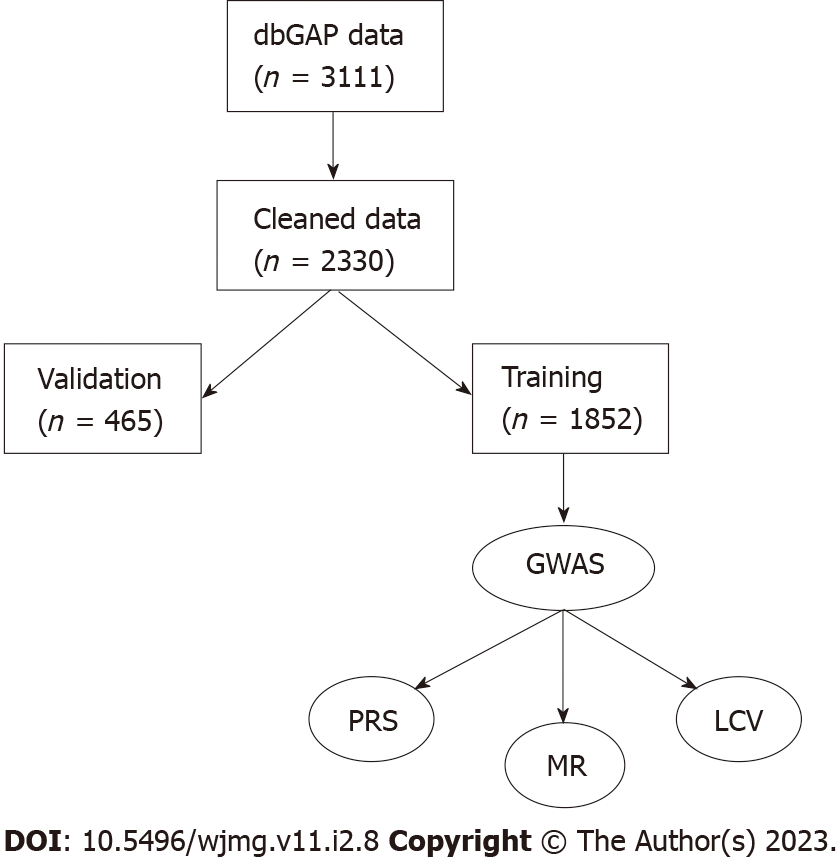
Figure 1 Flow diagram for data processing.
Rectangles are datasets with sample sizes in parentheses and ovals are processes. dbGAP: Database of Genotypes and Phenotypes; GWAS: Genome-wide association studies; LCV: latent causal variable; MR: Mendelian randomization; PRS: Polygenic risk score.
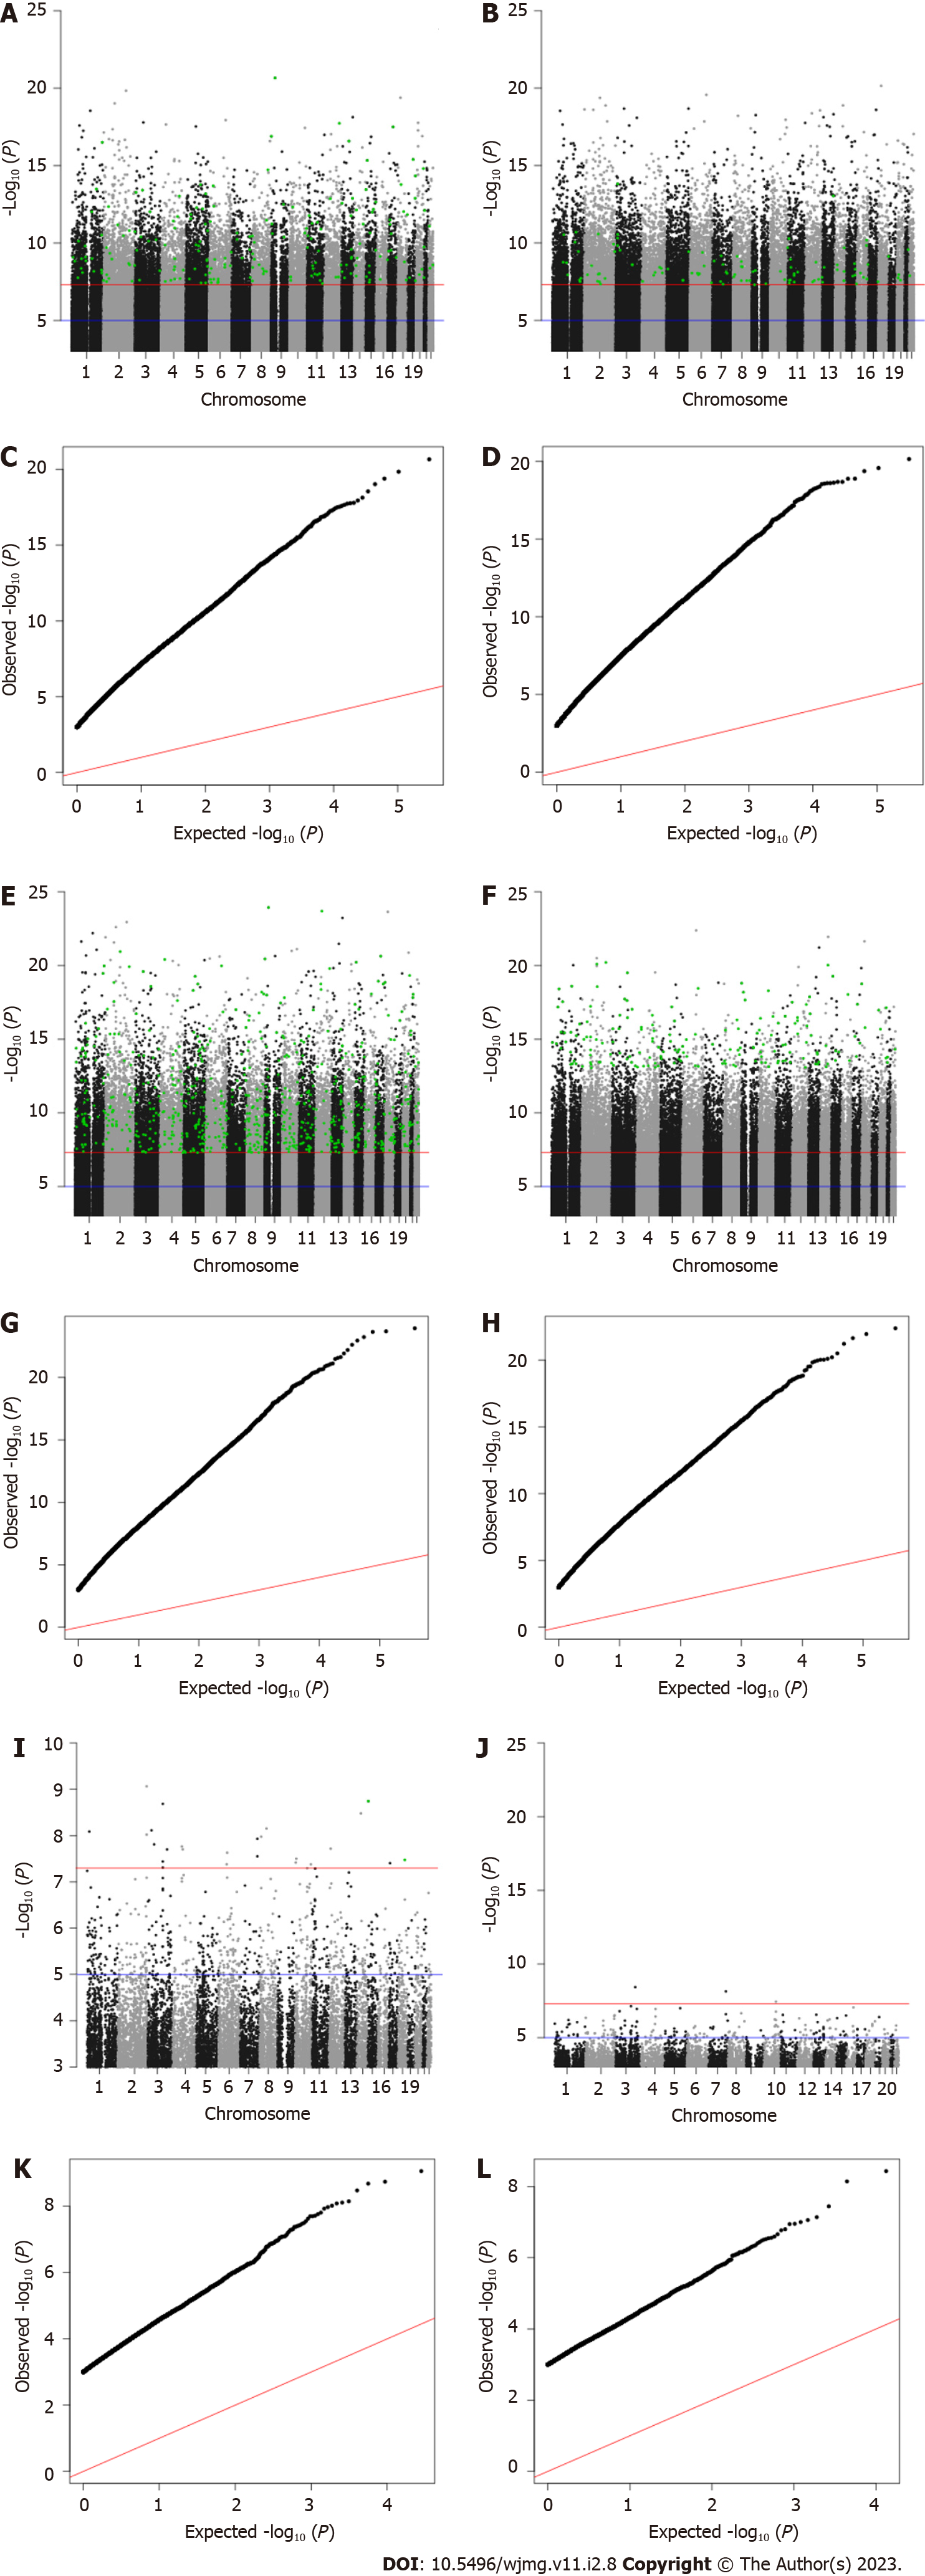
Figure 2 Manhattan and quantile-quantile plots of genome-wide associations.
A: Manhattan plot for cynical distrust score; B: Manhattan plot for high cynical distrust; C: QQ plot for cynical distrust score; D: QQ plot for high cynical distrust; E: Manhattan plot for cynicism score; F: Manhattan plot for high cynicism; G: QQ plot for cynicism score; H: QQ plot for high cynicism; I: Manhattan plot for John Henryism score; J: Manhattan plot for high John Henryism; K: QQ plot for John Henryism score; L: QQ plot for high John Henryism. Black dots = candidate associations from the training set (n = 1852); green dots = associations replicated in the verification set (n = 465); blue line = genome-wide suggestive association (P = 5 × 10⁻⁶); red line = genome-wide significant association (P = 5 × 10⁻⁸).
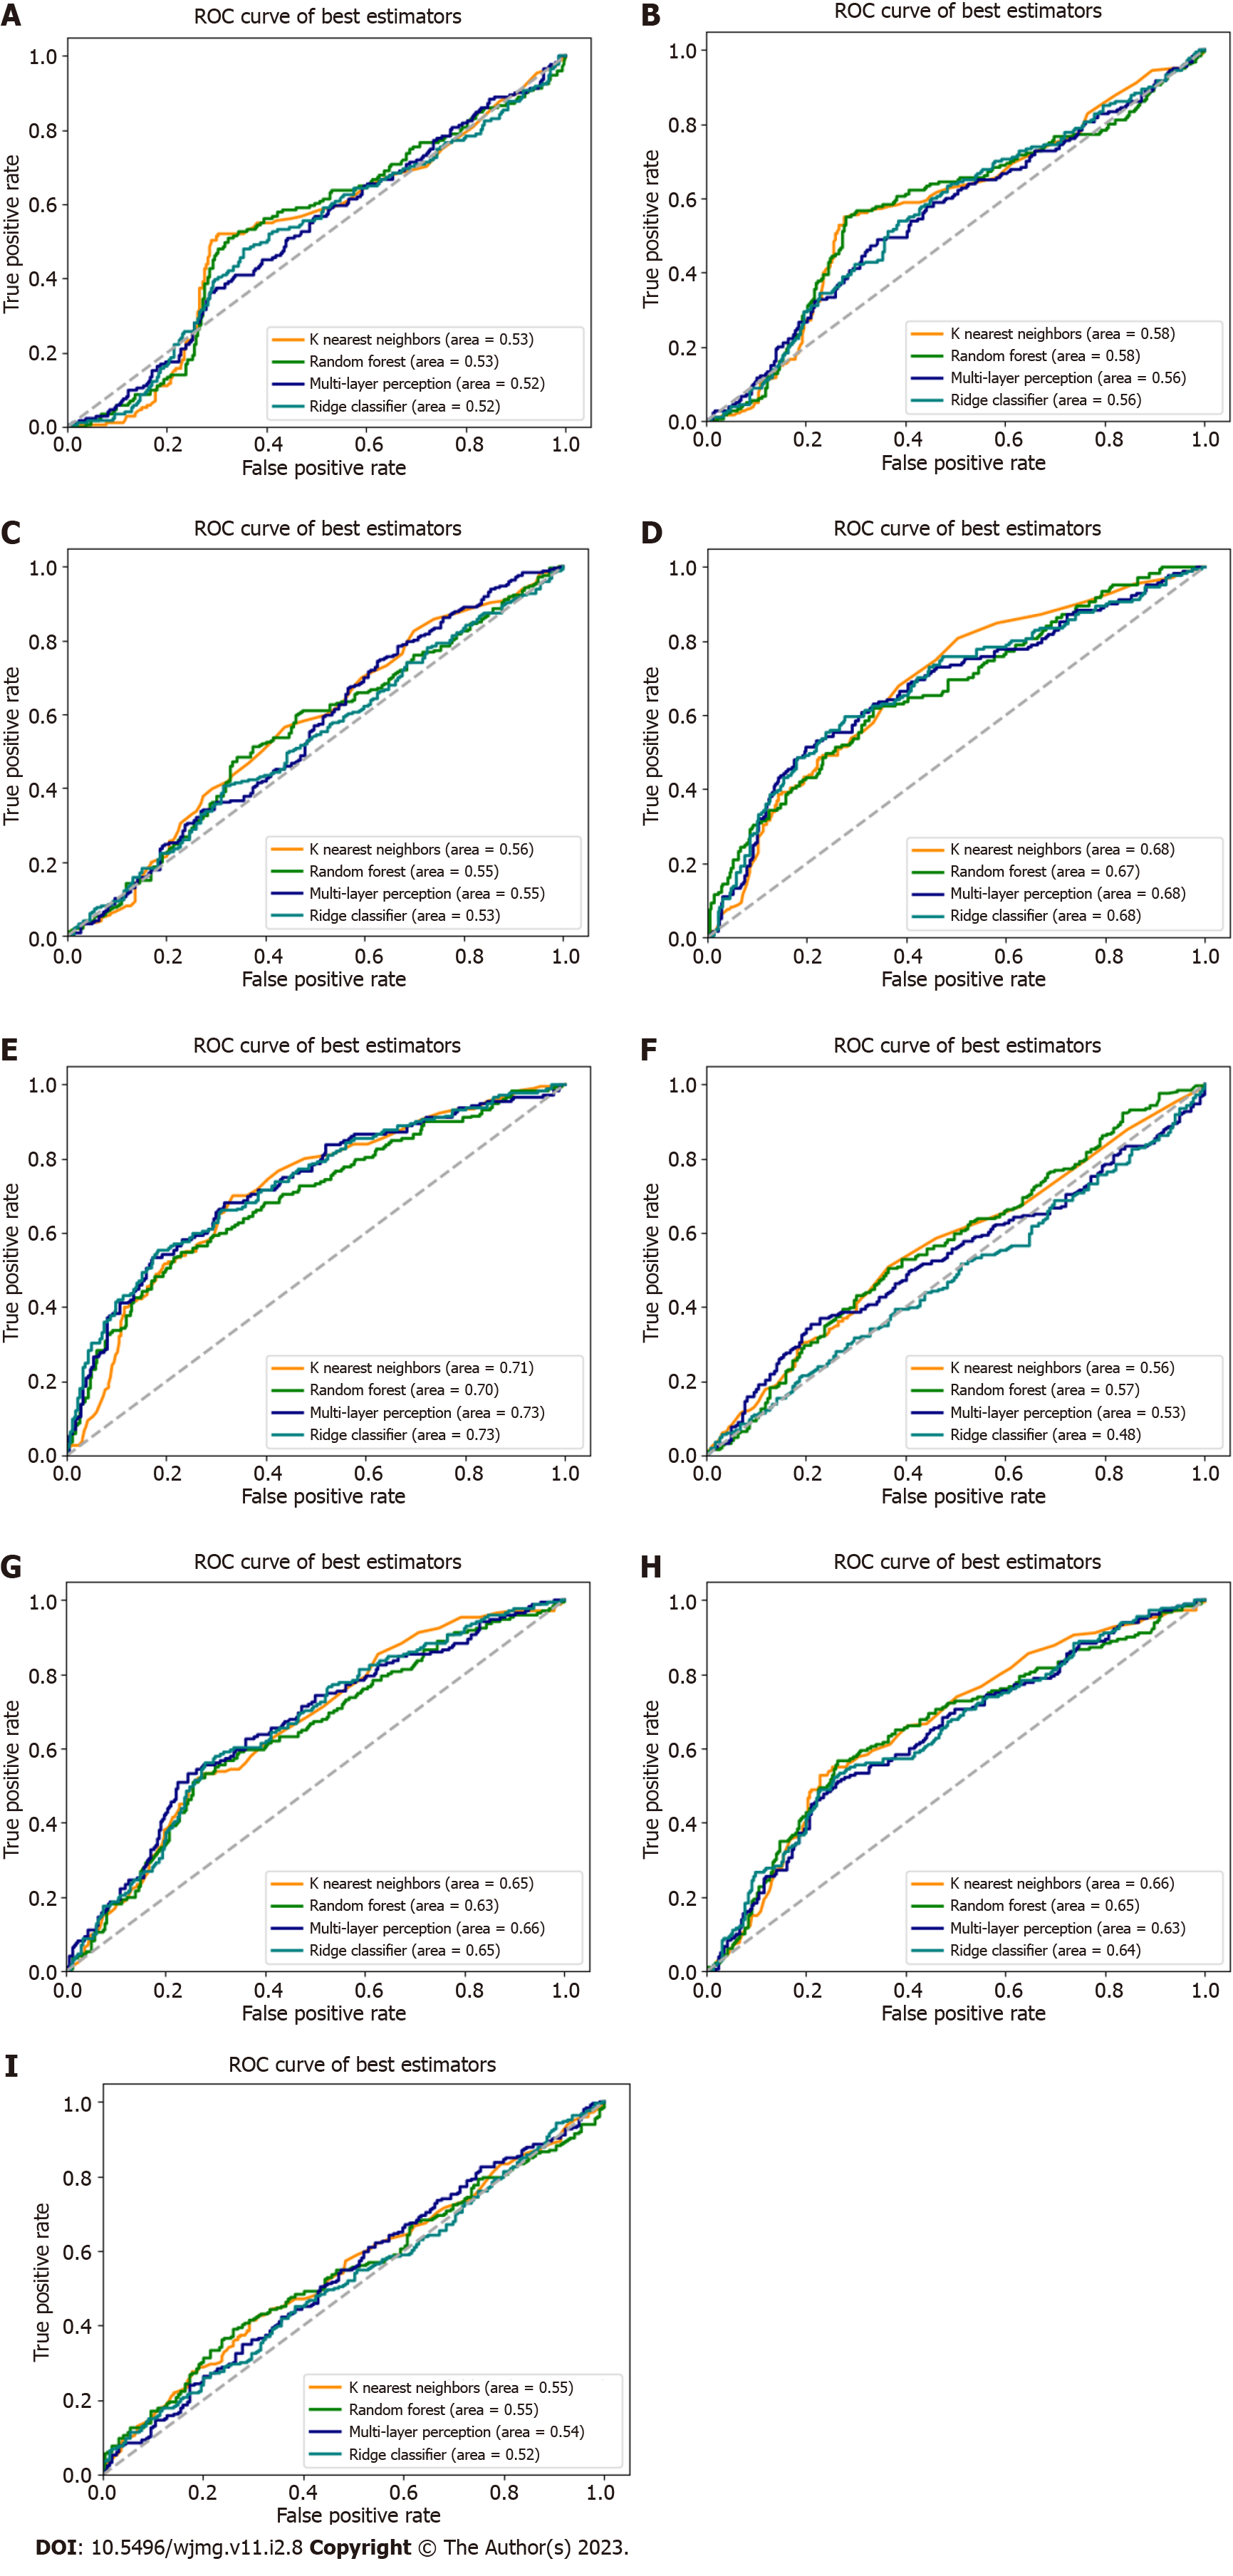
Figure 3 Receiver operator characteristics curves for genetic classification algorithms.
A: High cynical distrust classifier predicting high cynical distrust; B: High cynical distrust classifier predicting high cynicism; C: High cynical distrust classifier predicting high John Henryism; D: High cynicism classifier predicting high cynical distrust; E: High cynicism classifier predicting high cynicism; F: High cynicism classifier predicting high John Henryism; G: High John Henryism classifier predicting high cynical distrust; H: High John Henryism classifier predicting high cynical distrust; I: High John Henryism classifier predicting high John Henryism. Each panel shows four predictors (orange = K-nearest neighbors, green = random forest, navy = multi-layer perceptron, teal = ridge classification).
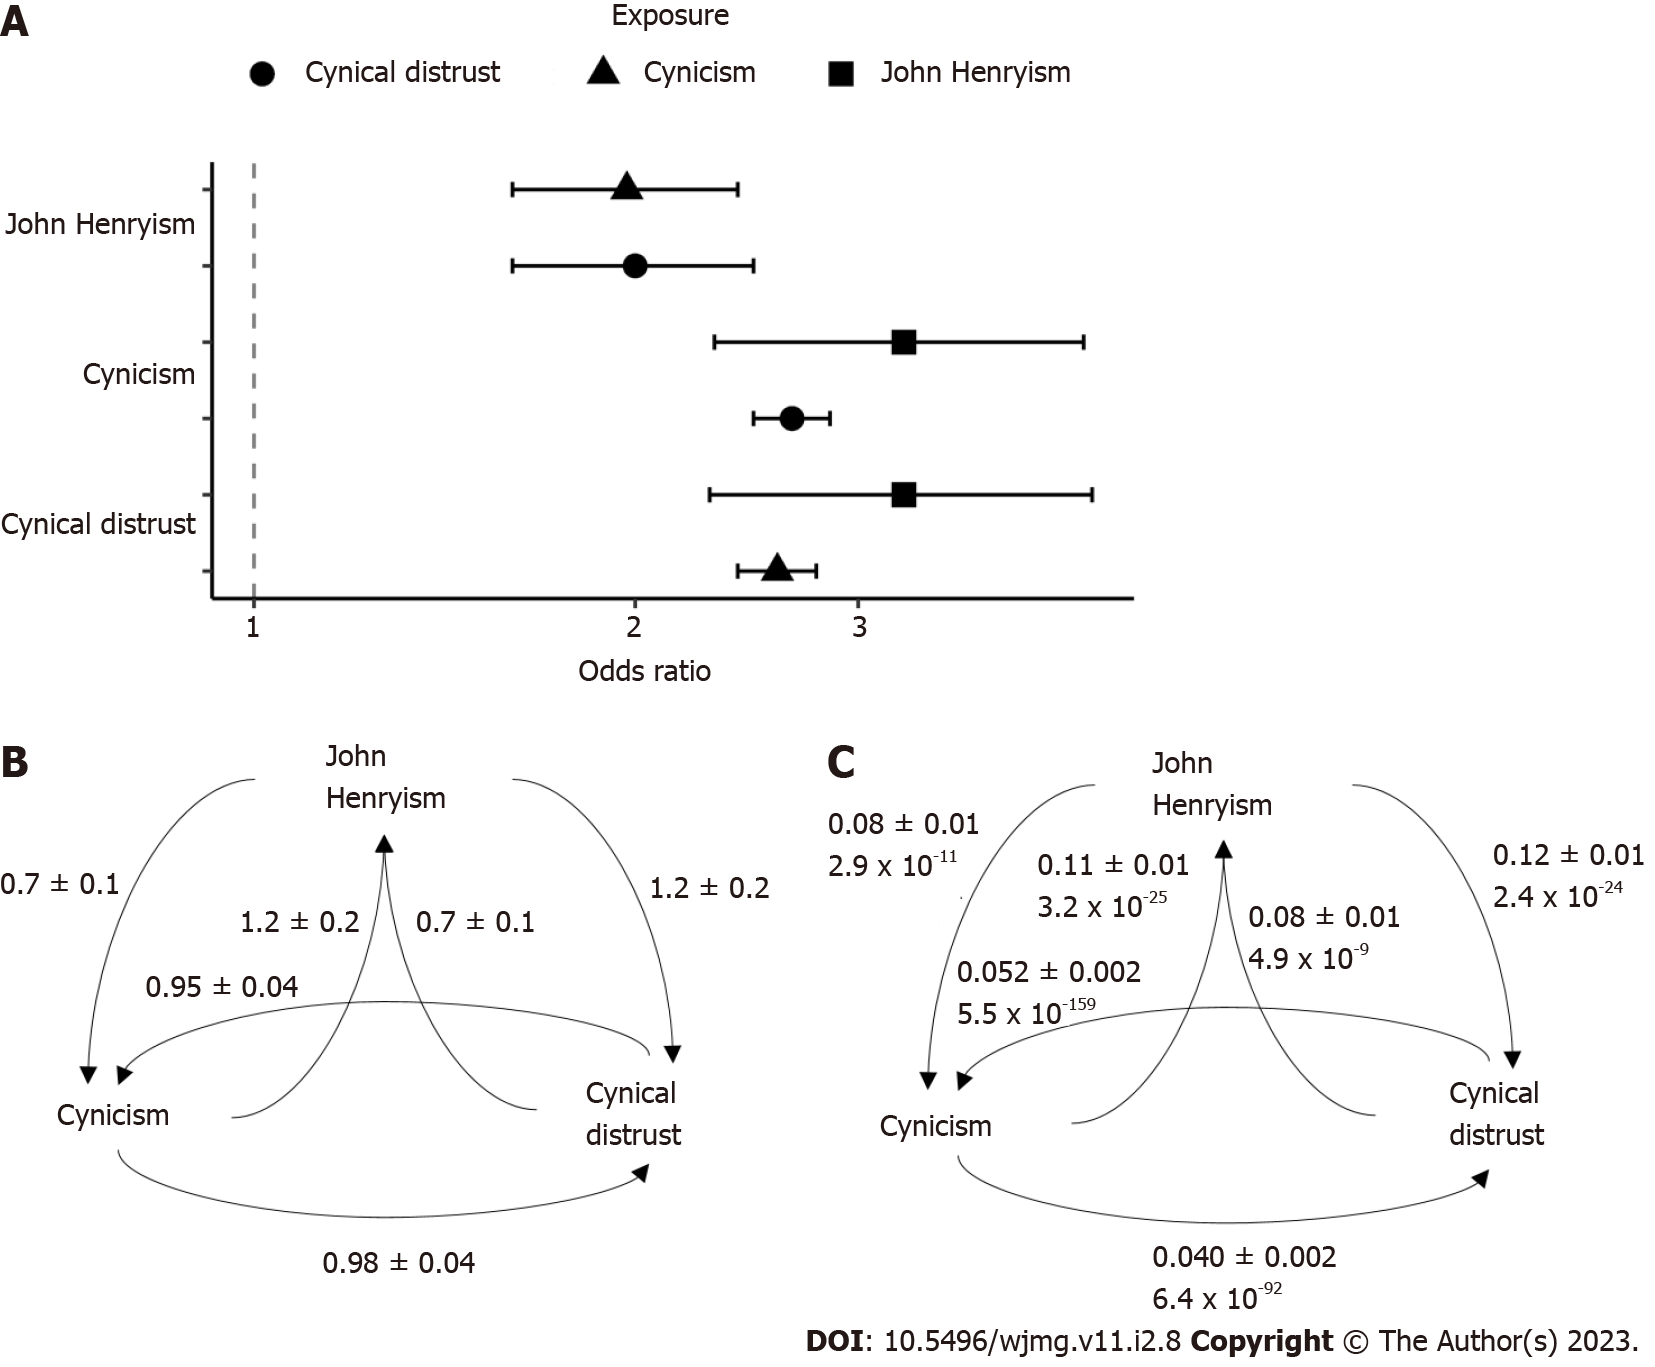
Figure 4 Results from Mendelian randomization.
A: Average odds ratios and 95% confidence intervals of the causal relationships between traits as determined by Mendelian randomization (MR); B: Average beta coefficients and standard errors from four MR methods; C: Egger intercepts, standard errors, and P values (italic) from pleiotropy analyses.
- Citation: Chapleau RR. Genome-wide associations, polygenic risk, and Mendelian randomization reveal limited interactions between John Henryism and cynicism. World J Med Genet 2023; 11(2): 8-20
- URL: https://www.wjgnet.com/2220-3184/full/v11/i2/8.htm
- DOI: https://dx.doi.org/10.5496/wjmg.v11.i2.8


