Copyright
©The Author(s) 2017.
World J Clin Infect Dis. May 25, 2017; 7(2): 21-31
Published online May 25, 2017. doi: 10.5495/wjcid.v7.i2.21
Published online May 25, 2017. doi: 10.5495/wjcid.v7.i2.21
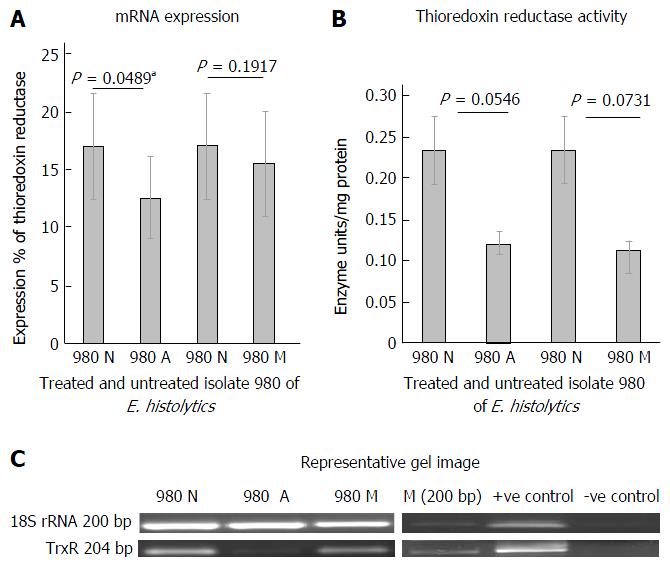
Figure 1 mRNA expression and activity levels of thioredoxin reductase in clinical isolate 980 of Entamoeba histolytica during treatment with antiamoebic drugs.
A: Graphical representation of densitometric data from semiquantitative RT-PCR analysis of Thioredoxin reductase in clinical isolate 980. Untreated (980 N), auranofin treated (980 A) and metronidazole treated (980 M). Densitometric values are expressed as percent after normalizing with 18S rRNA. Each pair of columns show the data for untreated and treated isolate. Data are mean ± SE of three independent experiments. aP < 0.05 in case of auranofin treatment; B: Activity of thioredoxin reductase in clinical isolate 980, untreated (980 N), auranofin treated (980 A) and metronidazole treated (980 M). Each pair of columns show the enzyme activity in units/mg protein, for the treated and untreated isolate; C: Representative gel image: 980 N: Untreated isolate; 980 A: Auranofin treated; 980 M: Metronidazole treated. M: Marker; +ve C: HM-1: IMSS cDNA used as +ve control; -ve C: cDNA from blank medim used as -ve control; TrxR: Thioredoxin reductase; E. histolytics: Entamoeba histolytica.
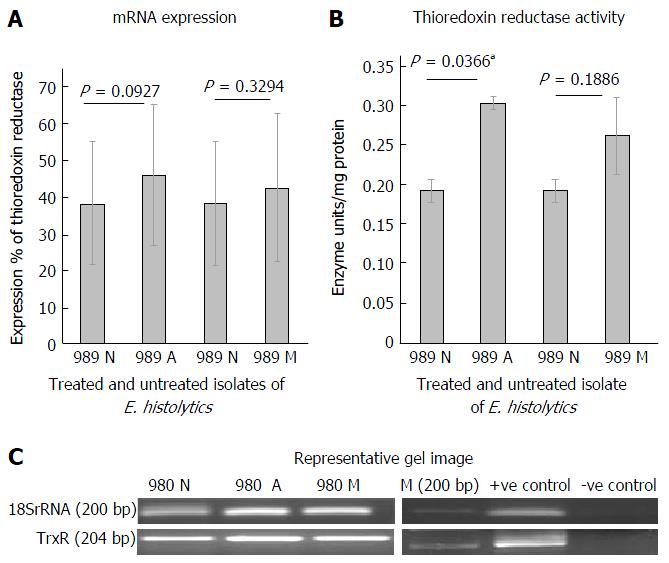
Figure 2 mRNA expression and activity levels of thioredoxin reductase in clinical isolates 989 of Entamoeba histolytica during treatment with antiamoebic drugs.
A: Graphical representation of densitometric data from semiquantitative RT-PCR analysis of Thioredoxin reductase in clinical isolate 989, untreated (989 N), auranofin treated (989 A) and metronidazole treated (980 M). Densitometric values are expressed as percent after normalizing with 18S rRNA. Each pair of columns show the data for untreated and treated isolate. Data are mean ± SE for three independent experiments; B: Activity of thioredoxin reductase in clinical isolate 989, untreated (989 N) and after treatment with auranofin (989 A) and metronidazole (989 M). Each pair of columns show the data for untreated and treated isolate. Data are mean ± SE for three independent experiments. aP < 0.05 in case of auranofin treatment; C: Representative gel image of thioredoxin reductase expression. 989 N: Untreated isolate; 989 A: Auranofin treated; 989 M: Metronidazole treated; M: Marker; +ve C: HM-1: IMSS cDNA used as +ve control; -ve C: cDNA from blank medim used as -ve control; TrxR: Thioredoxin reductase; E. histolytics: Entamoeba histolytica.
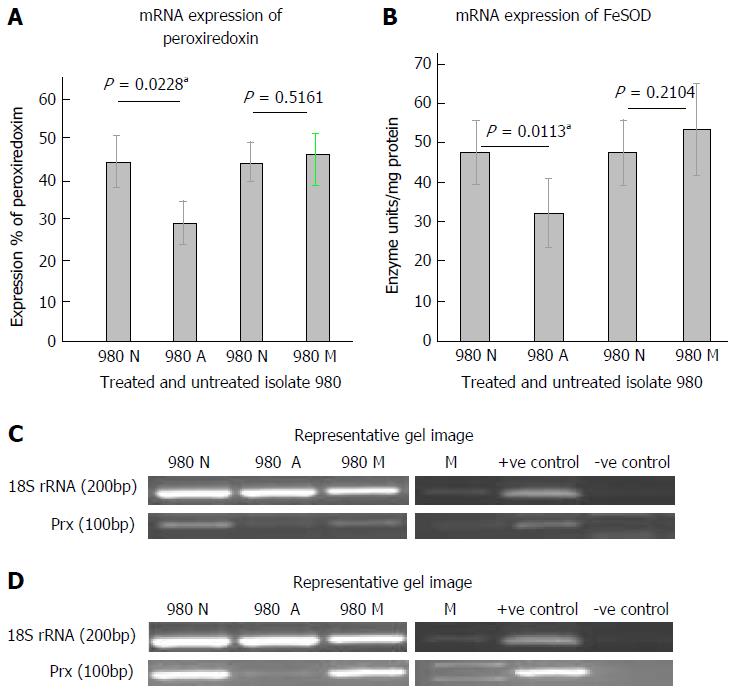
Figure 3 mRNA expression and activity levels of peroxiredoxin and FeSOD in clinical isolate 980 of Entamoeba histolytica during tatment with antiamoebic drugs.
A: Graphical representation of densitometric data from semiquantitative RT-PCR analysis of Peroxiredoxin in clinical isolate 980, untreated (980 N) and after auranofin (980 A) and metronidazole treatment (980 M). Densitometric values are expressed as percent after normalizing with 18S rRNA. Each pair of columns show the data for untreated and treated isolate. Data are mean ± SE for three independent experiments. In case of auranofin treatment (aP < 0.05); B: Graphical representation of densitometric data from semiquantitative RT-PCR analysis of FeSOD in clinical isolate 980. Densitometric values are expressed as percent after normalizing with 18S rRNA. Each pair of columns show the data for untreated and treated isolate. Data are mean ± SE for three independent experiments. In case of auranofin treatment (aP < 0.05); C: Representative gel pictures of peroxiredoxin expression. 980 N: Untreated isolate; 980 A: Auranofin treated; 980 M: Metronidazole treated; M: Marker; +ve C: HM-1: IMSS cDNA used as +ve control; -ve C: cDNA from blank medim used as -ve control; D: Representative gel pictures of FeSOD expression. 989 N: Untreated isolate; 989 A: Auranofin treated; 989 M: Metronidazole treated; M: Marker; +ve C: HM-1: IMSS cDNA used as +ve control; -ve C: cDNA from blank medim used as -ve control.
- Citation: Iyer LR, Banyal N, Naik S, Paul J. Antioxidant enzyme profile of two clinical isolates of Entamoeba histolytica varying in sensitivity to antiamoebic drugs. World J Clin Infect Dis 2017; 7(2): 21-31
- URL: https://www.wjgnet.com/2220-3176/full/v7/i2/21.htm
- DOI: https://dx.doi.org/10.5495/wjcid.v7.i2.21


