Copyright
©The Author(s) 2015.
World J Clin Infect Dis. May 25, 2015; 5(2): 44-50
Published online May 25, 2015. doi: 10.5495/wjcid.v5.i2.44
Published online May 25, 2015. doi: 10.5495/wjcid.v5.i2.44
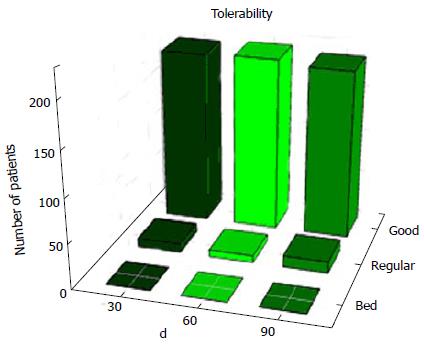
Figure 1 Assessment of Phyto V7 tolerability.
The assessment of tolerability is based on the medical examination and the participant’s feedback and general feeling.
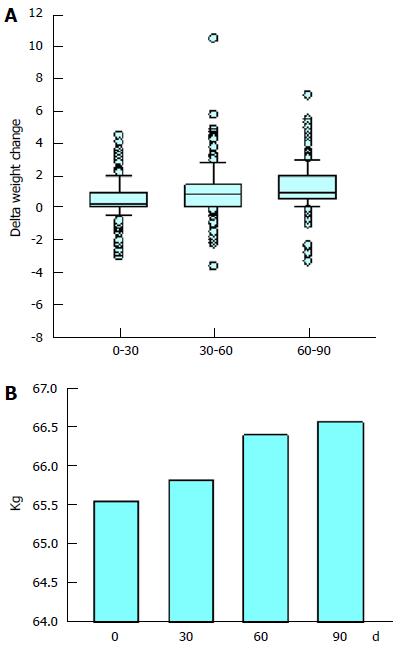
Figure 2 Participant body weight.
A: Box plots describing the delta change in the weight of the study participants. The boxes represent the middle 50% of the data values. The horizontal line across the box marks the median value. The error bars show the 10th and 90th percentiles of the population. Individual data-points falling beyond these boundaries are shown as dots; B: The mean weight of the study participants.
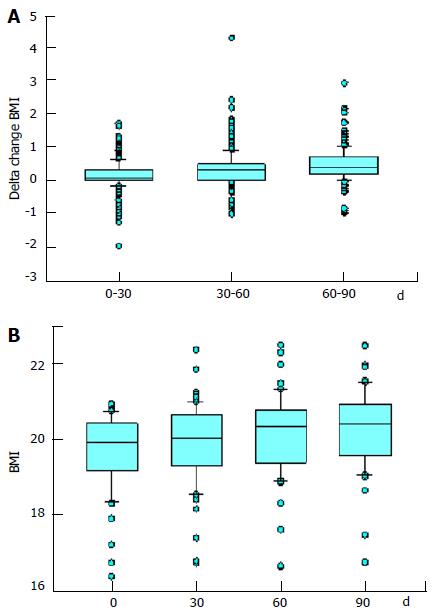
Figure 3 Body mass index of study participants.
Box plots describing (A) the delta change in body mass index (BMI) of all the study participants over time and (B) the BMI of the participants who had a BMI of less than 21 at the onset of the study.
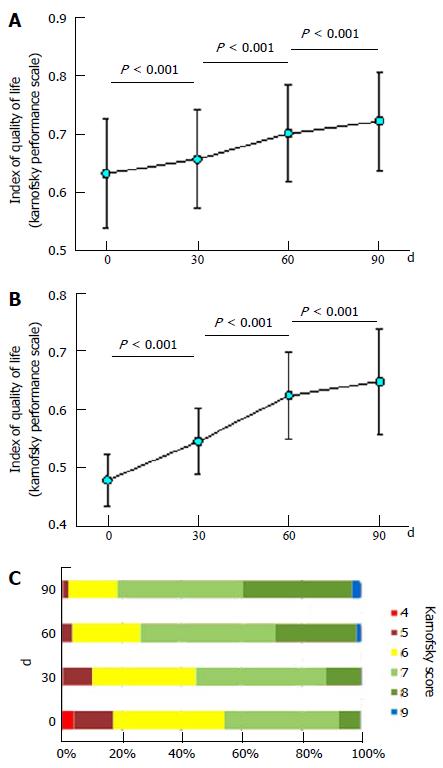
Figure 4 Quality of life of study participants based on the Karnofsky score.
A: The mean and standard deviation of the Index of Quality of Life score of all study participants and of (B) participants who had a Karnofsky score of 5 or less at the onset of the study; C: The proportions of Karnofsky score at days 0, 30, 60 and 90. The P values of Wilcoxon Signed Rank Tests between each day are shown.
- Citation: Wernik R, Priore JL, Goldman WF, Elias ADC, Borkow G. Improvement in human immunodeficiency virus-1/acquired immune deficiency syndrome patients’ well-being following administration of “Phyto V7”. World J Clin Infect Dis 2015; 5(2): 44-50
- URL: https://www.wjgnet.com/2220-3176/full/v5/i2/44.htm
- DOI: https://dx.doi.org/10.5495/wjcid.v5.i2.44


