Copyright
©The Author(s) 2022.
World J Clin Infect Dis. Apr 26, 2022; 12(1): 1-19
Published online Apr 26, 2022. doi: 10.5495/wjcid.v12.i1.1
Published online Apr 26, 2022. doi: 10.5495/wjcid.v12.i1.1
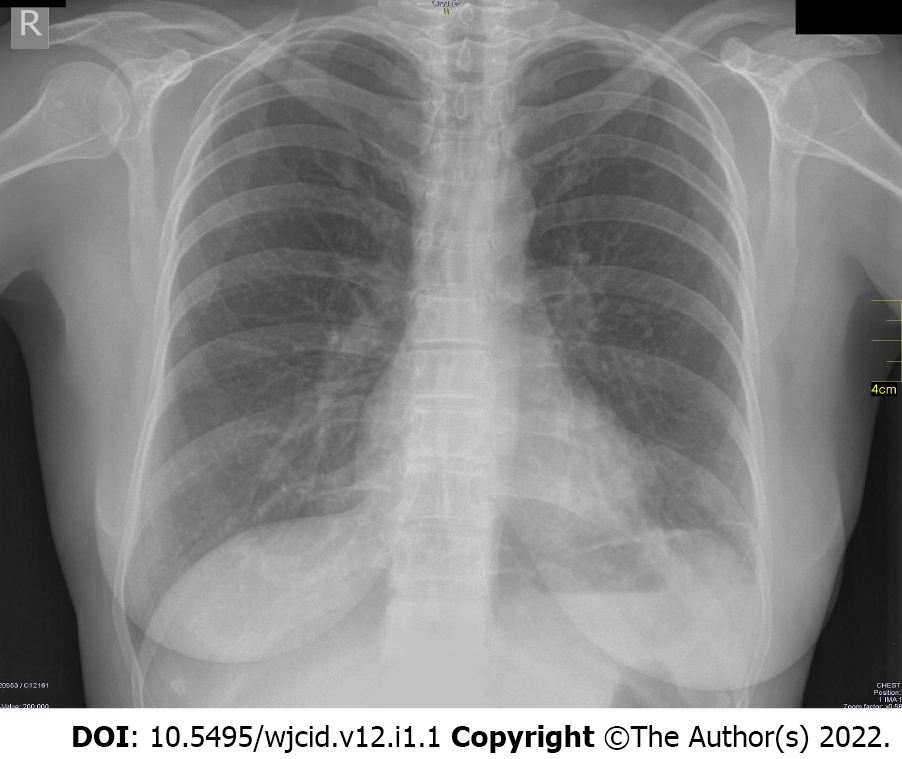
Figure 1 Negative radiography of an asymptomatic patient.
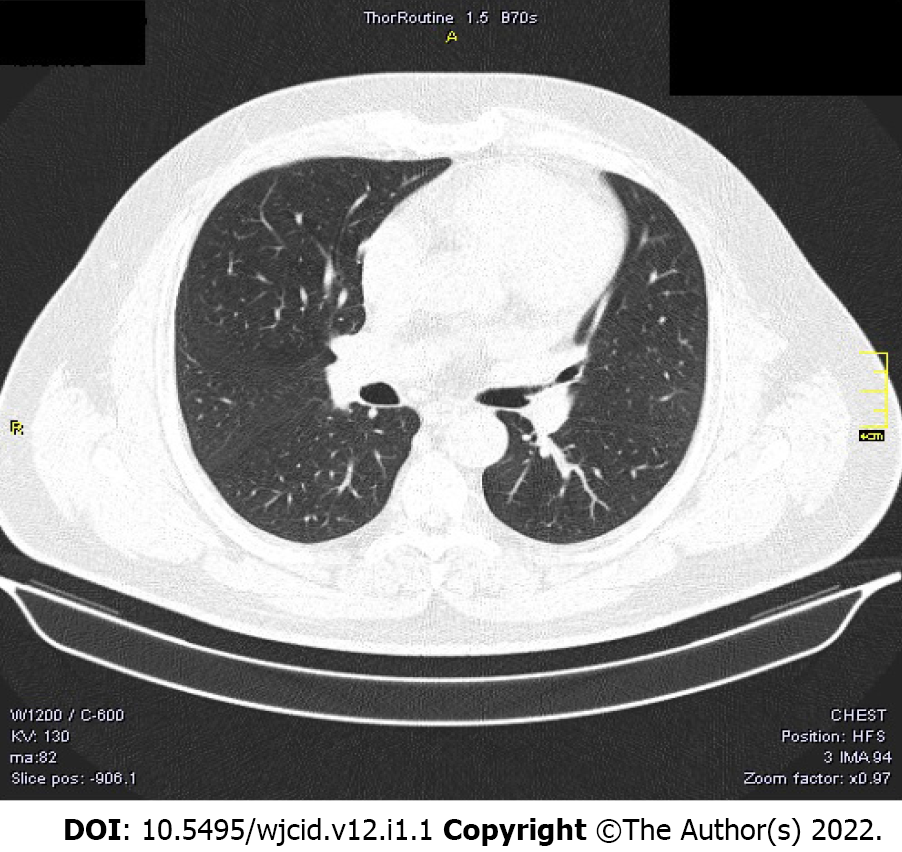
Figure 2 Negative computed tomography of an asymptomatic patient.
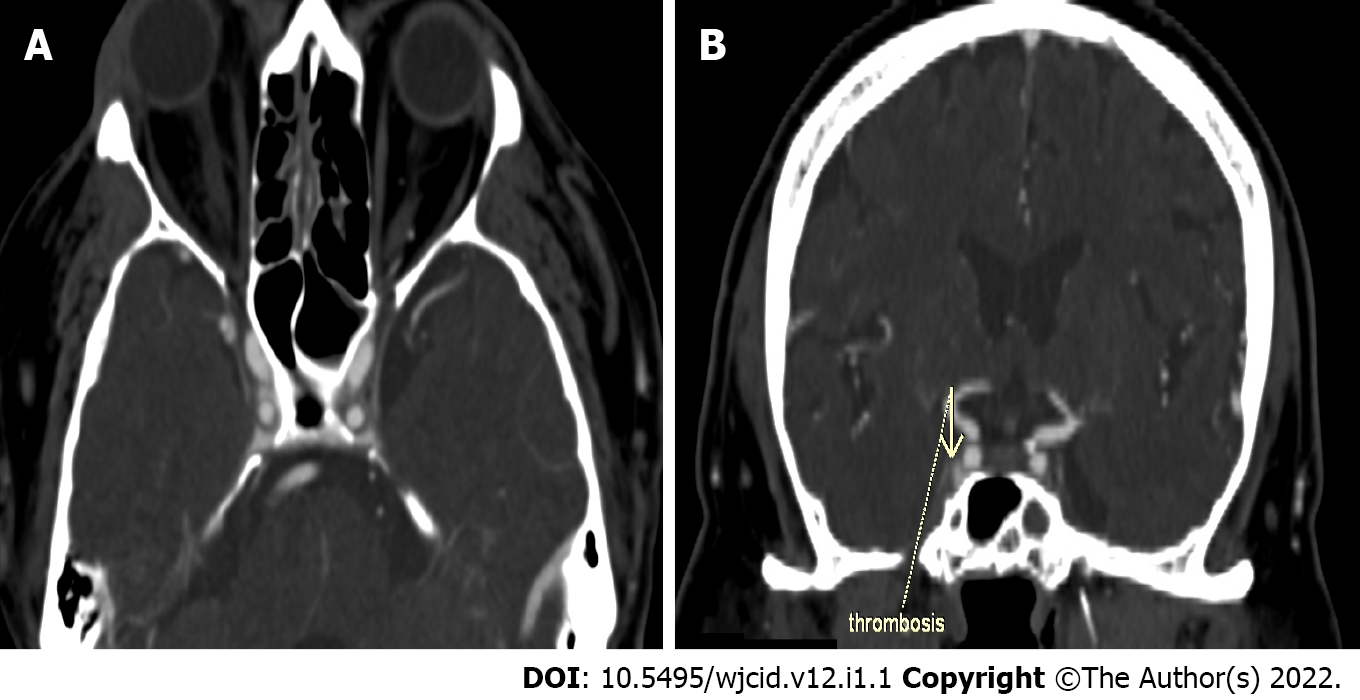
Figure 3 Computed tomography with contrast enhancement.
A: Axial slice of thrombosis of the right sinus cavernosus; B: Coronal reconstruction of thrombosis of the right sinus cavernosus.
Figure 4 Imaging findings on conventional radiography range from normal findings to diffuse changes in the lung parenchyma.
A: Posteroanterior (PA) chest X-ray 7 d after symptom onset. Predominantly peripheral ground glass opacities in both mid and lower zones of the lungs (white arrows); B: PA chest X-ray 11 d after symptom onset. Bilateral dense peripheral and basal air space consolidation (white arrows) more pronounced on the left and loss of lung markings in the mid and lower zones on the left; C: PA chest X-ray 3 d after symptom onset. Bilaterally, approximately proportionally in the middle and lower lung lobes, confluent ill-defined patchy opacities are visualized (white arrows). There is a relative preservation of the central areas of the lungs; D: PA chest X-ray 4 d after symptom onset. Bilaterally, predominantly in the right lower lobe, fine linear opacities (white arrows) are seen. Additionally, small patchy ground glass opacities (black arrow) are visualized in the peripheral region of right middle lobe.
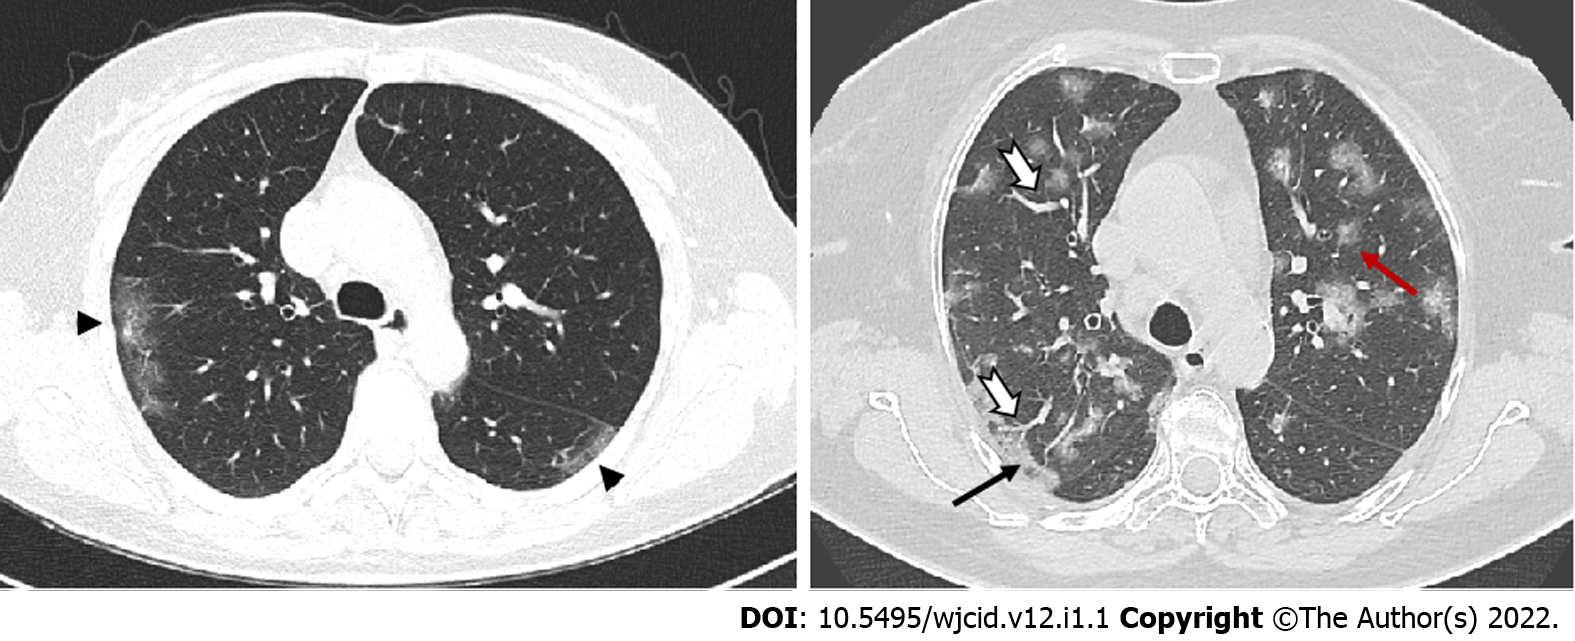
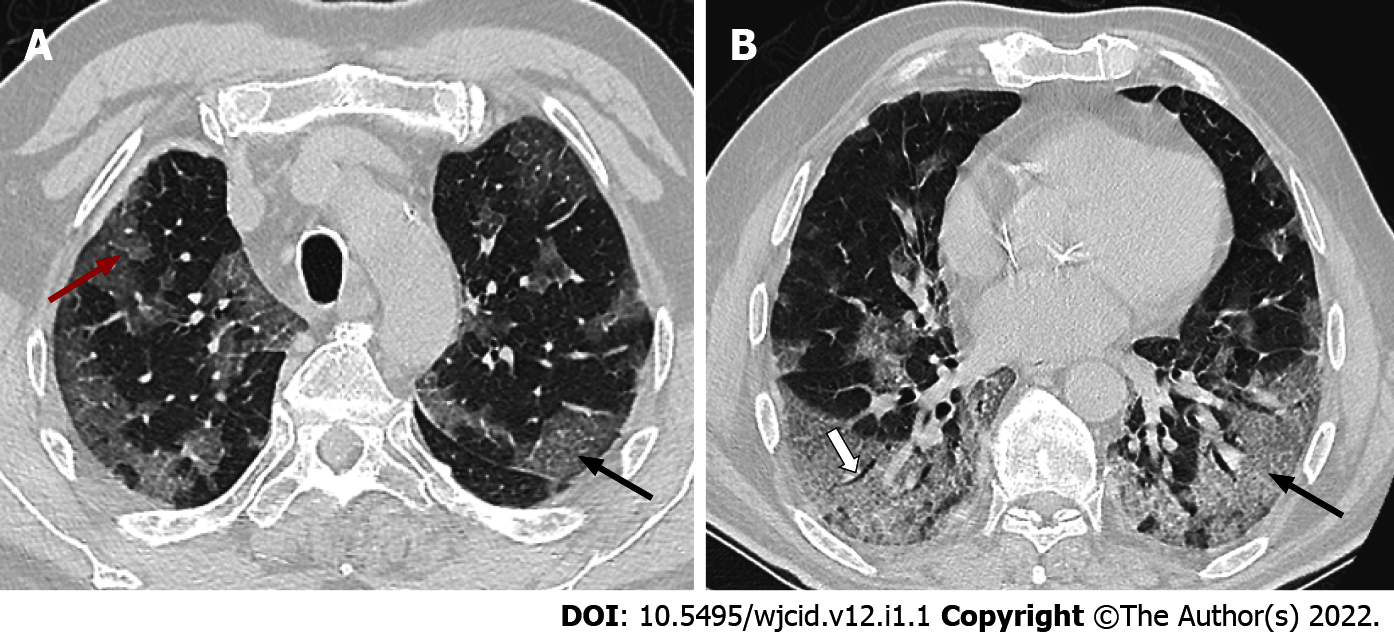
Figure 5 Axial computed tomography images show different patterns of ground glass opacities – round (red arrow), linear (arrowheads) and crazy paving (black arrow) with vascular enlargement (thick white arrow) within ground glass opacities areas.
Figure 6 Axial computed tomography scans (7 days after symptom onset) show peripheral bilateral ground-glass opacities.
A: Superimposed reticular interstitial thickening (red arrow) within the ground-glass opacities (GGO) giving a ‘crazy-paving’ appearance (black arrow); B: Air bronchogram (thick arrow) within the GGO.
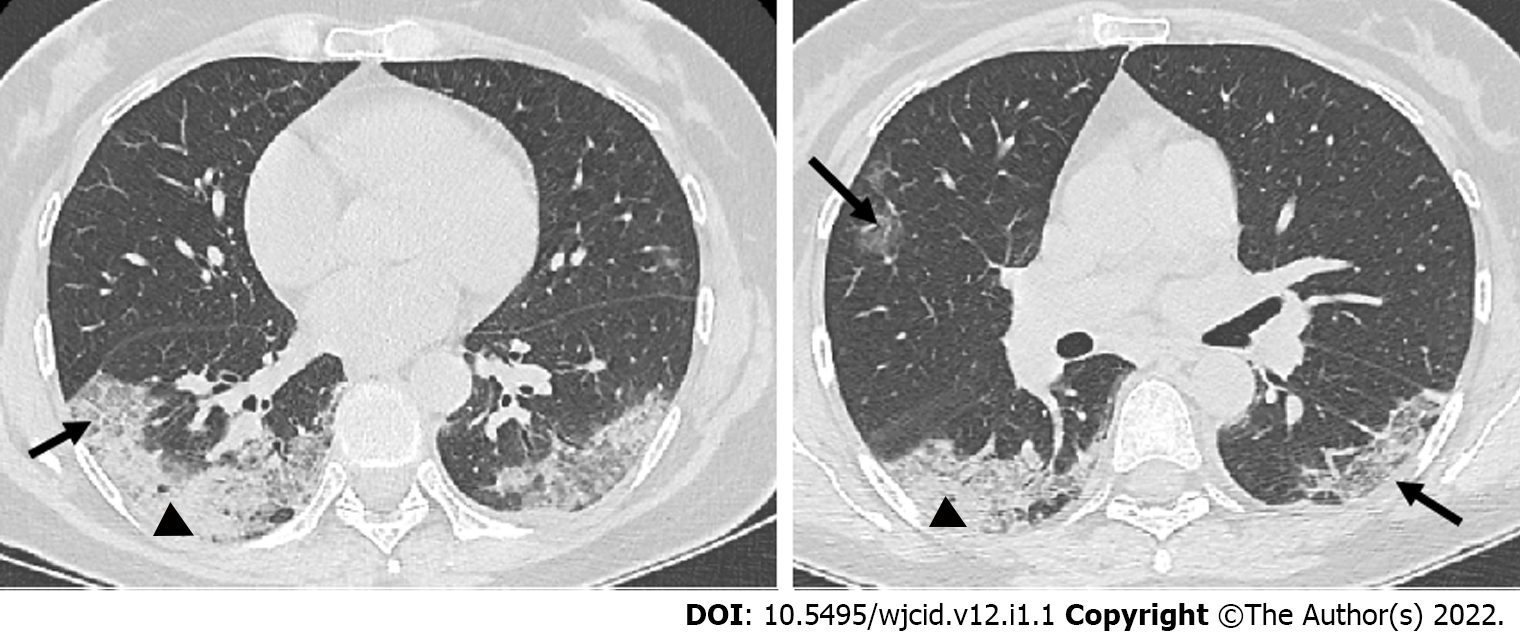
Figure 7 Axial computed tomography images 11 days after symptom onset demonstrate bilateral confluent zones of ground-glass opacities and crazy paving (arrows) with subpleural, predominantly dorsal distribution and with superimposed areas of consolidation (arrowheads), more extensive in the right thoracic half.
Figure 8 Axial computed tomography images of patients with different time of symptoms onset showing various types of lung abnormalities distribution.
A: Subpleural with involvement of peripheral one third of lungs; B: Random with central and subpleural location; C: Diffuse with confluence of changes and continuous involvement.
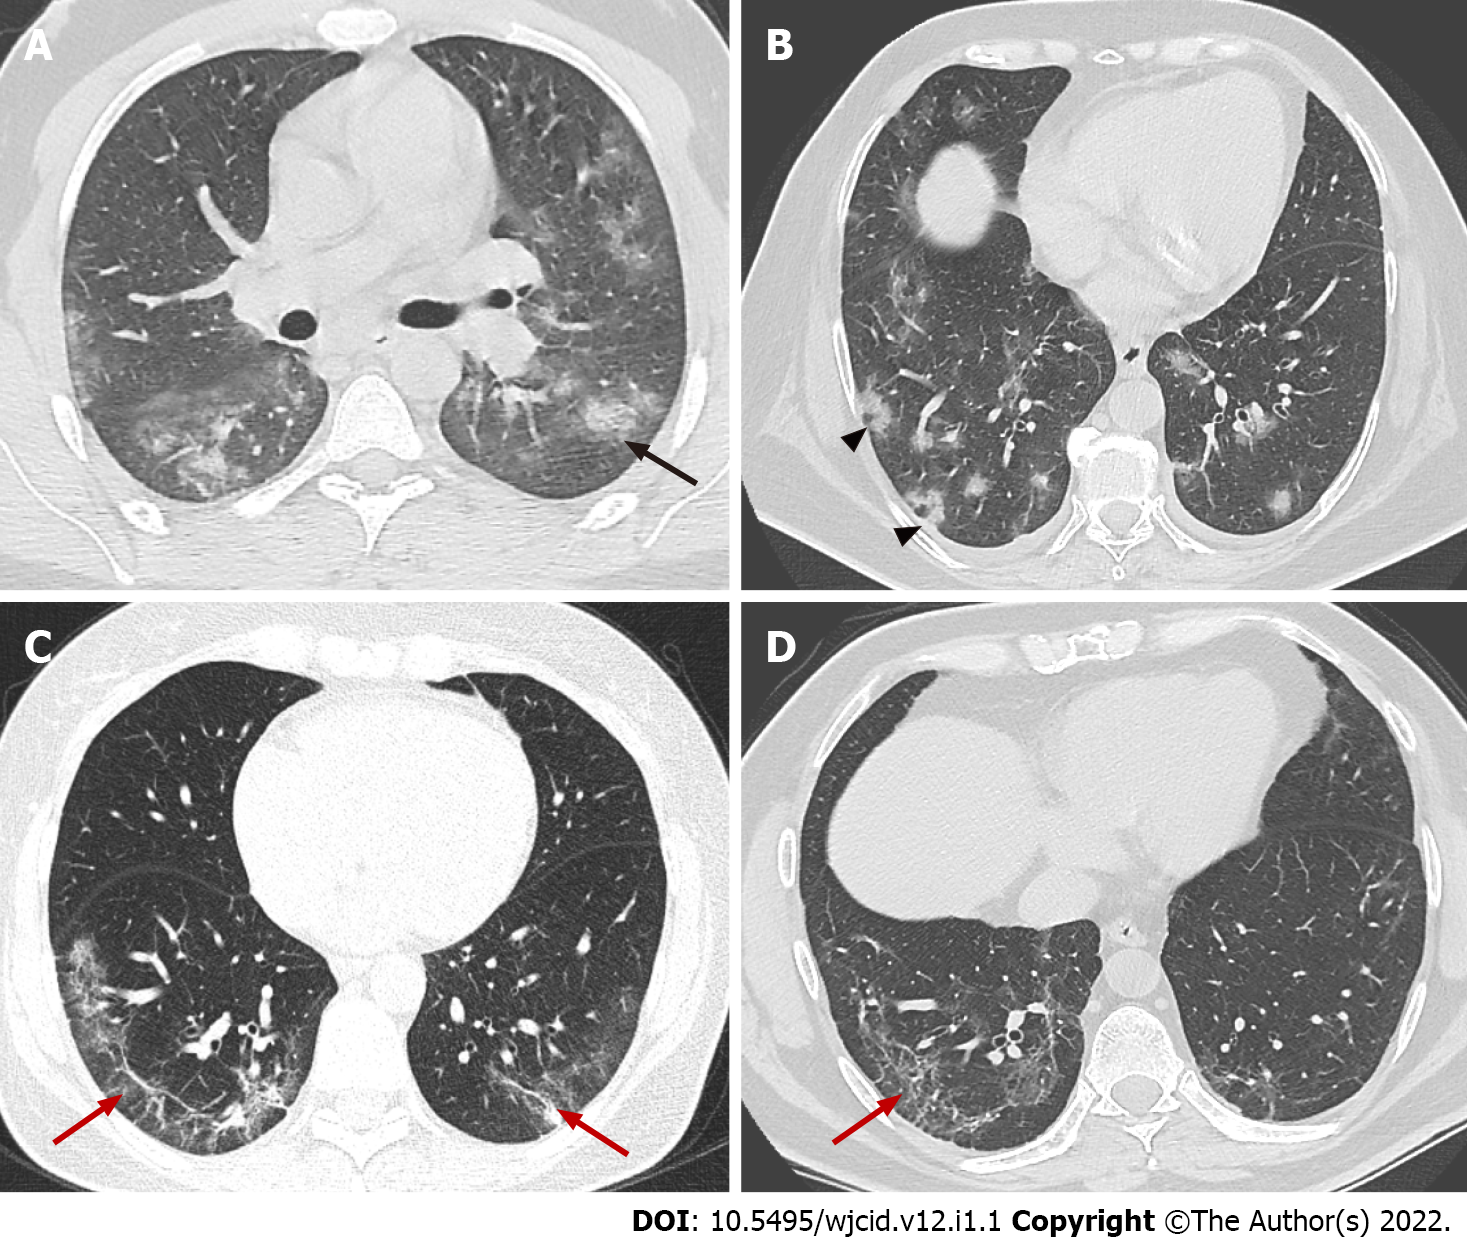
Figure 9 Axial computed tomography images demonstrate features seen in organizing pneumonia.
A: Ground-glass opacities (GGO) surrounding small area of consolidation, “halo sign” (black arrow); B: Central GGO surrounded by denser consolidation of crescentic shape, “reverse halo sign” (arrowheads); C and D: Аrchitectural distortion with interstitial thickening and irregular fibrous bands (red arrows).
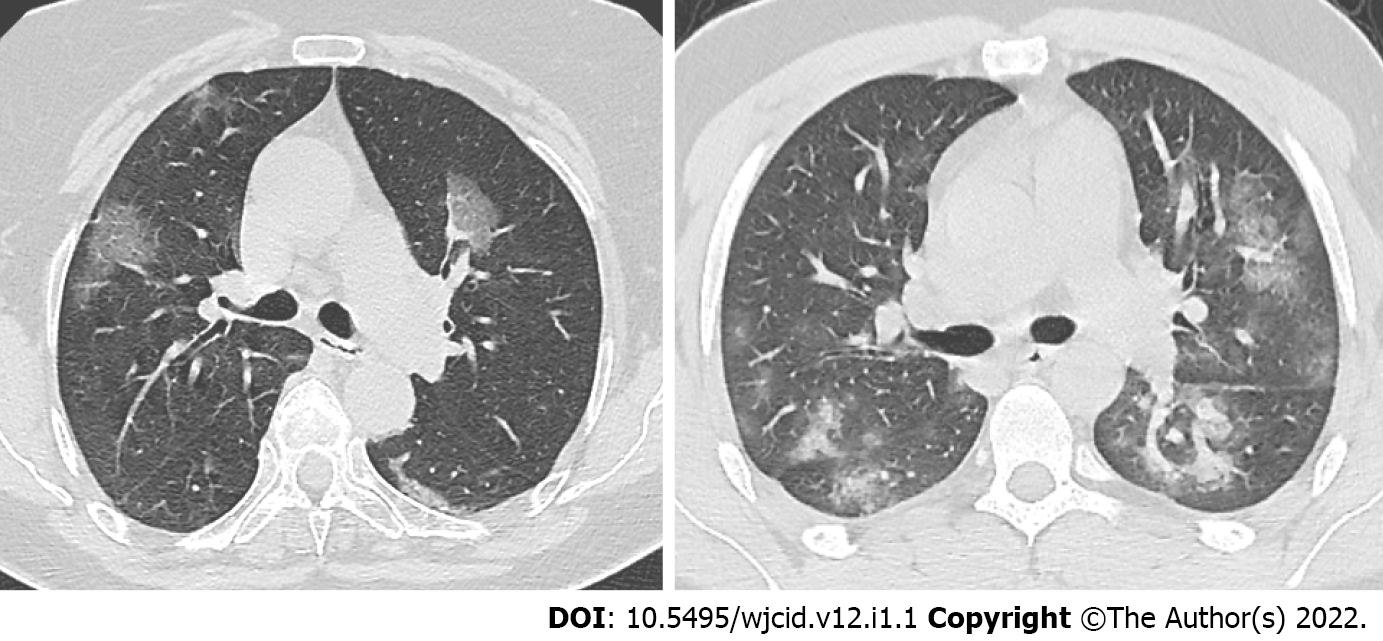
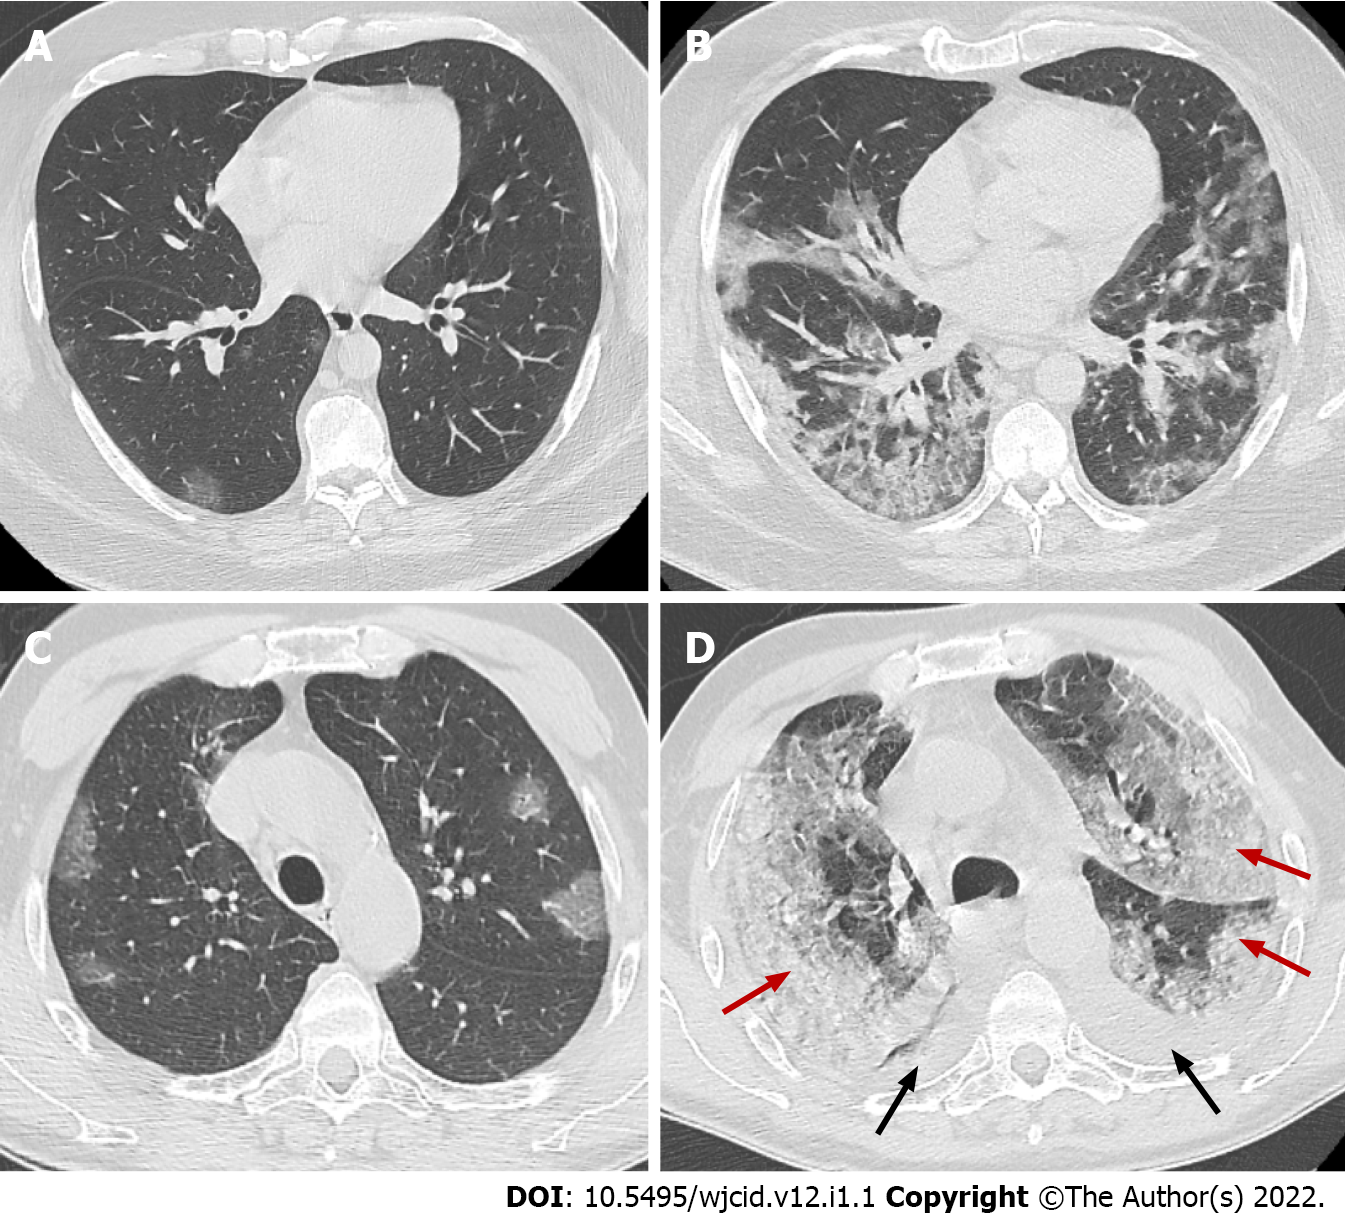
Figure 10 Axial computed tomography images in two different patients 5 days after onset of symptoms show various degree of ground-glass opacities abnormalities (early stage of COVID-19).
Figure 11 Axial computed tomography images.
Axial computed tomography images on day 2 (A) and day 10 (B) from onset of symptoms of patient with clinical worsening demonstrate increased ground-glass opacities with confluence, crazy-paving appearance and typical peripheral subpleural location, early (A) and progressive (B) stage. Axial images from CT on day 5 (C) and day 15 (D) from onset of symptoms of patient with pronounced clinical worsening demonstrate increased ground-glass opacities with confluence, crazy-paving appearance and extensive areas of consolidation (red arrows) with predominant posterior and lateral distribution. In addition, bilateral pleural effusions (black arrows) are noted, early (C) and peak (D) stage.
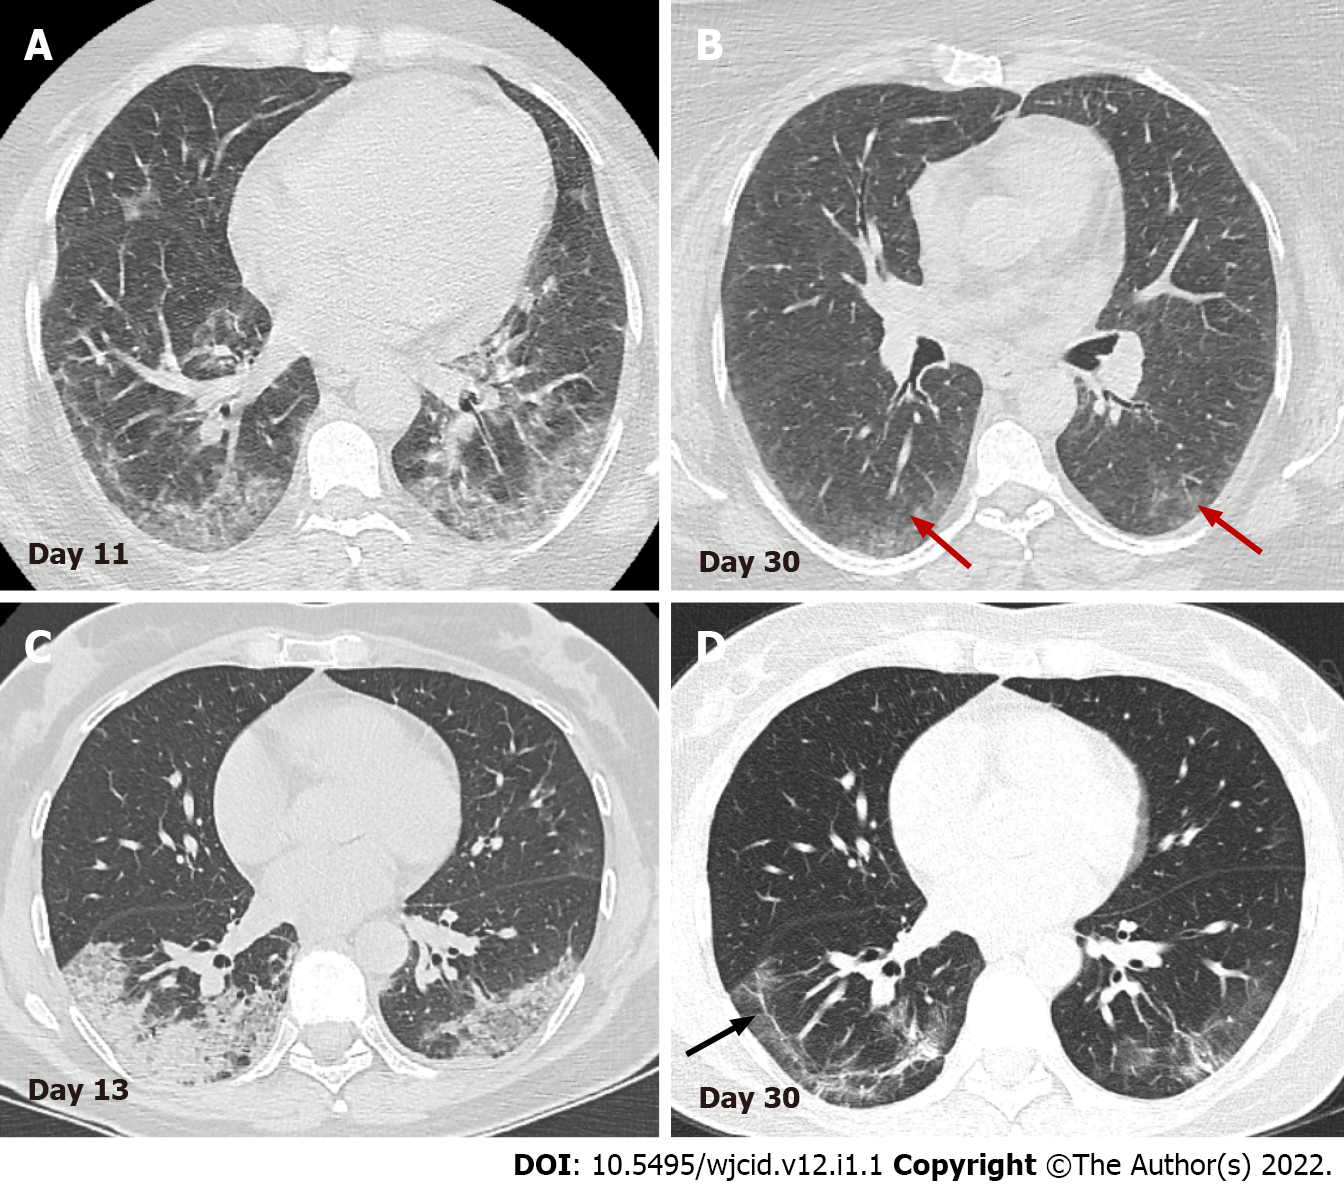
Figure 12 Serial axial computed tomography images.
Serial axial computed tomography images in two different patients show gradual decrease of GGO and consolidations in the late stage of disease (B) and (D). In patient 1 (A) and (B) advanced resorption of the abnormalities is seen with very low density GGO at the sight of previous lung changes (red arrows). In patient 2 (C) and (D) architectural distortion with fibrous bands parallel to the pleura (black arrow) and traction bronchiectasis are visualized (arrowheads).
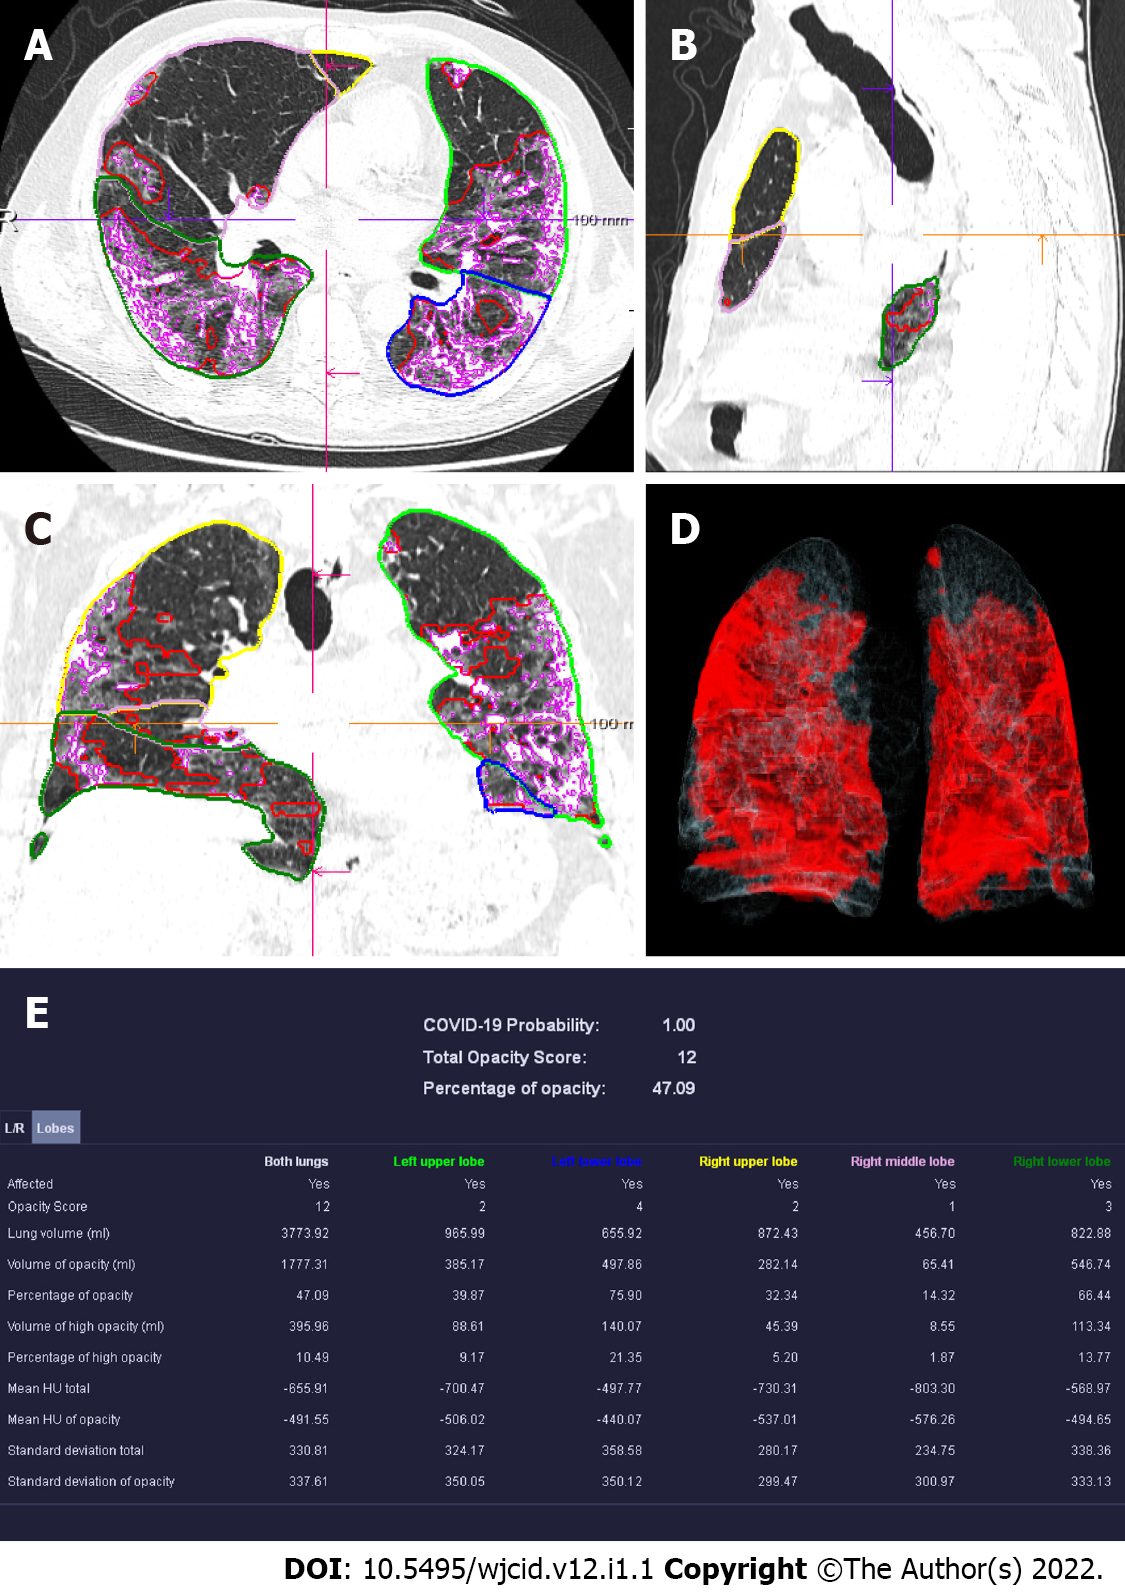
Figure 13 Computed tomography pneumonia analysis (automated lung opacity analysis).
A-C: Мulti-planar reconstruction views overlaid with delineations of the opacities and the lungs; D: Volume rendering image showing a quick overview of the spatial distribution of the opacities; E: Table with measurements demonstrating relative (“percentage of opacities”) and absolute volume of opacities, mean and standard deviation of HU values between lung parenchyma and the detected opacities, separately segmented quantitative results per left and right lung and per lung lobe.
Figure 14 Lung ultrasound image.
A: Lung ultrasound image obtained with convex probe shows multiple B-lines (arrow) and subpleural consolidations seen as hypoechoic regions (asterix) that appear tissue-like with an irregular deep border (shredded fractal line) abutting the more aerated lung, which has echogenic artefacts (arrowhead); B: Lung ultrasound image obtained with convex probe. Multiple linear vertical artefacts - B-lines (arrows), and thickened pleural line (between arrowheads) are visualized; C: Lung ultrasound image obtained with convex probe. Multiple confluent B-lines are seen (white lung).
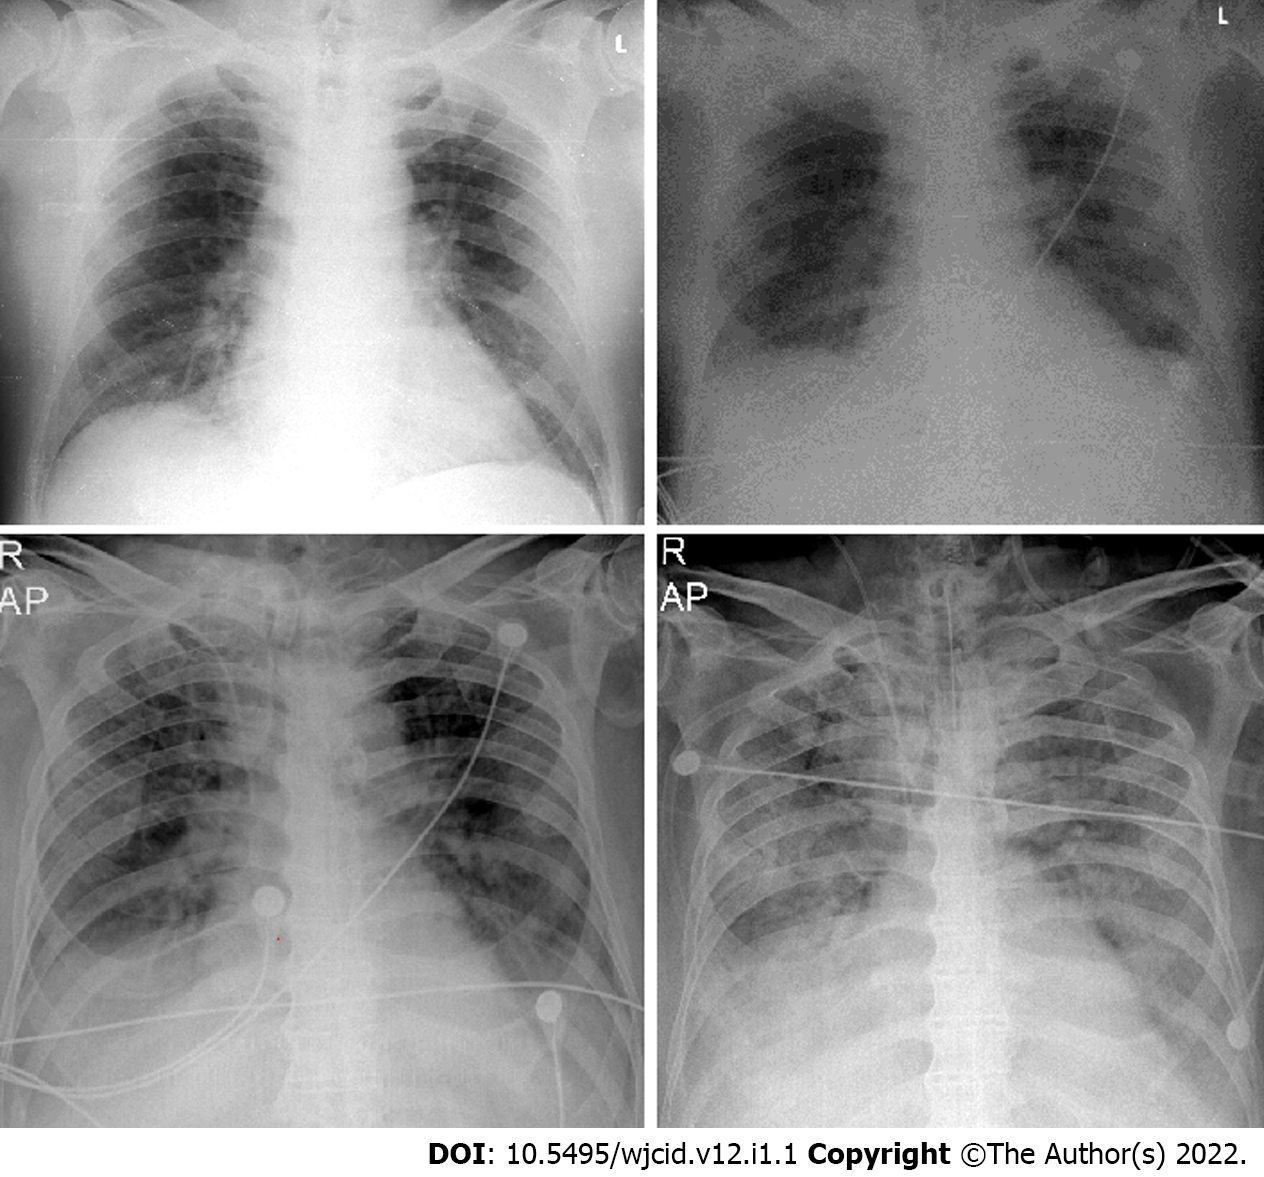
Figure 15 Serial chest X-ray imaging of coronavirus disease-2019 infected 65-year-old man with rapid respiratory deterioration after symptom onset showing progression from lower lung predominant interstitial and airspace opacities on day 1 and day 3 to diffuse and worsening involvement with extensive airspace disease on days 4 and 6.
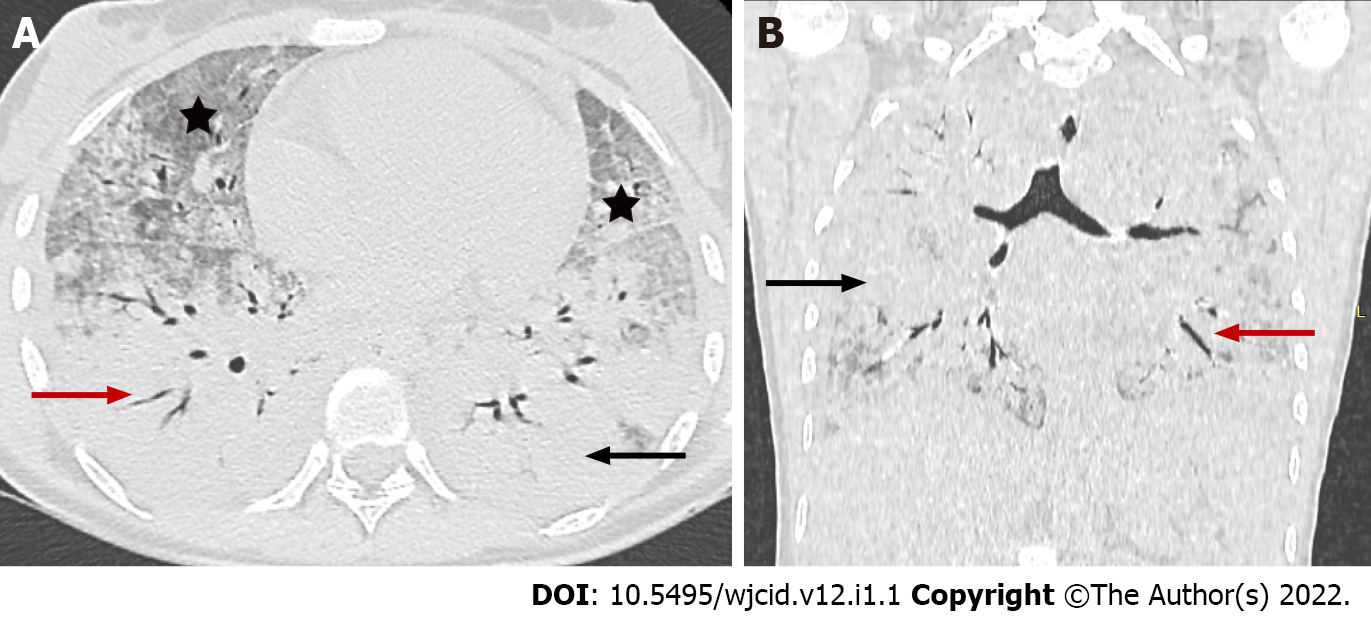
Figure 16 Coronavirus disease-2019 related acute respiratory distress syndrome, early stage.
Axial (A) and coronal (B) computed tomography images demonstrate widespread ground glass opacities (asterix) and large areas of consolidation (black arrow) with air bronchogram (red arrow) showing anteroposterior density gradient in both lungs.
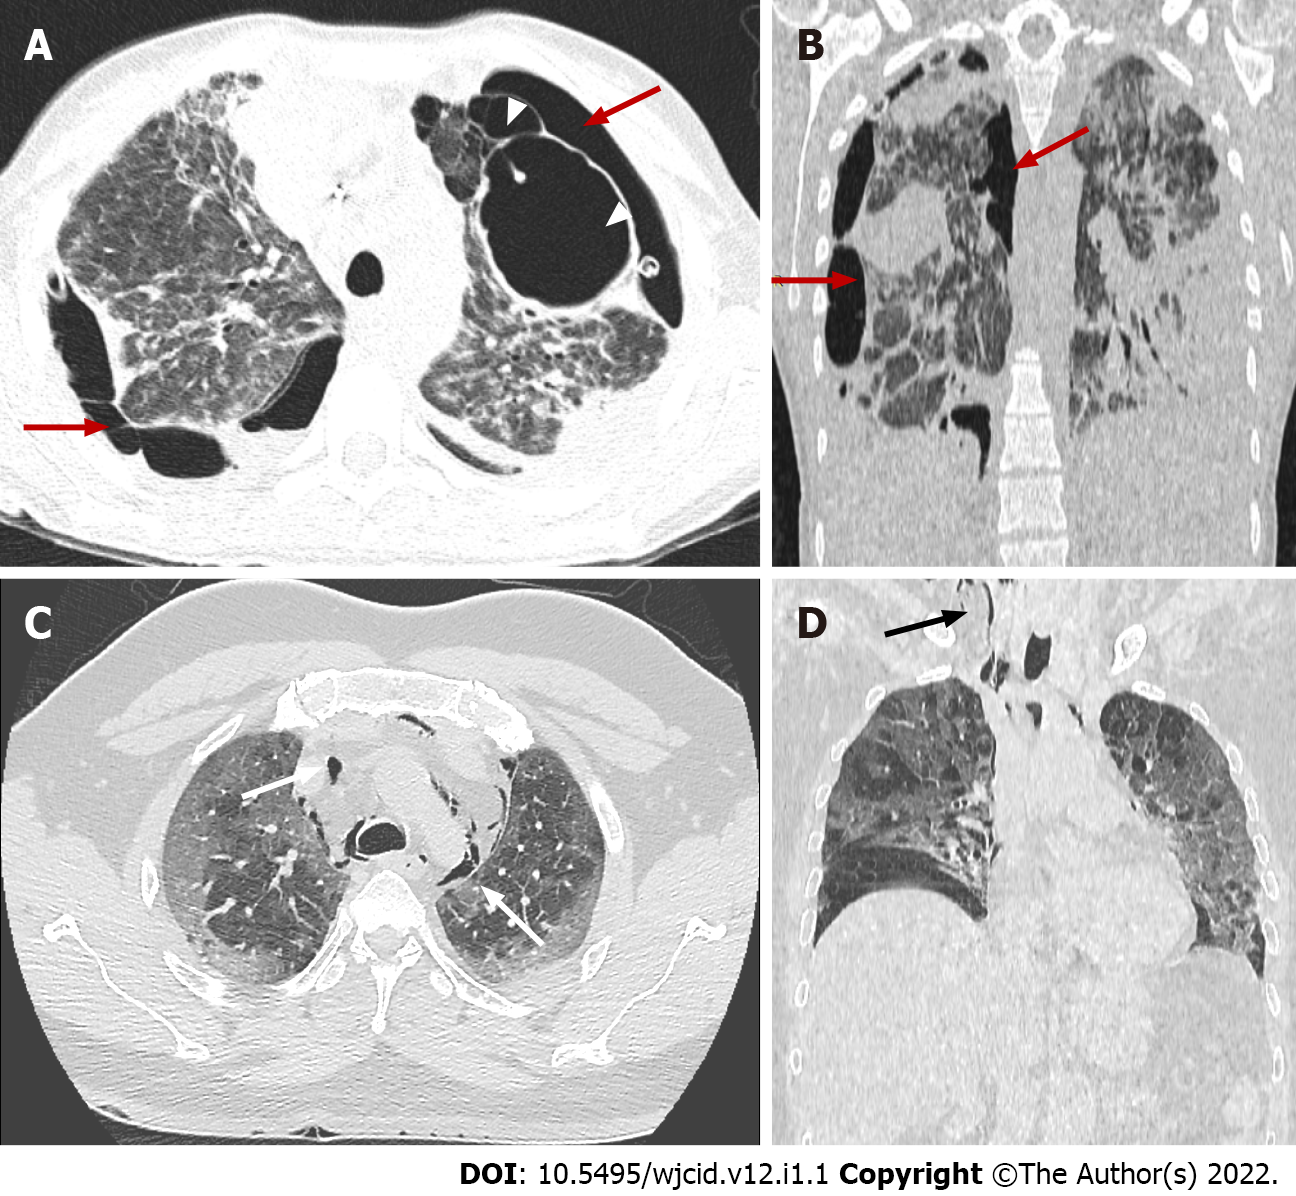
Figure 17 Coronavirus disease-2019 related acute respiratory distress syndrome, late stage.
Axial (A) and coronal computed tomography (CT) (B) images demonstrate typical complications in mechanically ventilated patients with subpleural bullae formation (arrowheads) and bilateral pneumothorax (red arrows). Axial (C) and coronal (D) CT images in different patient showing spontaneous pneumomediastinum (white arrows), extending into the neck as subcutaneous emphysema (black arrow).
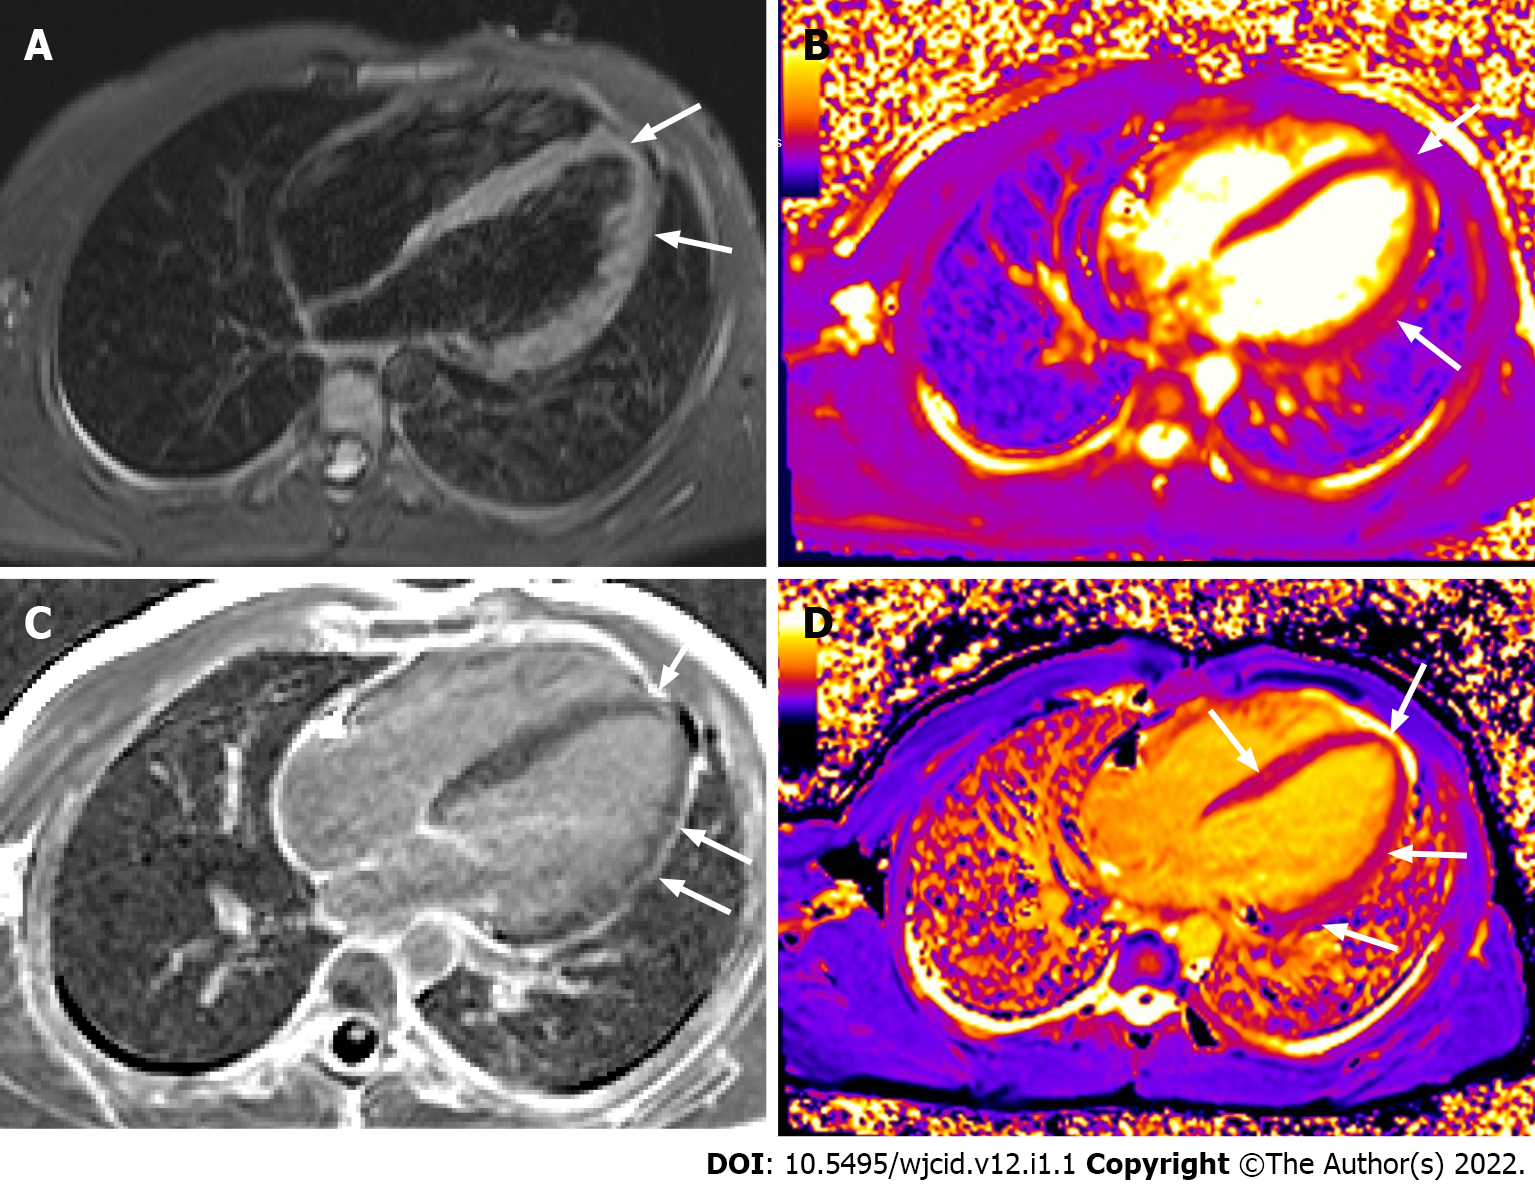
Figure 18 Cardiac magnetic resonance imaging.
Horizontal long axis TIRM image (A) displaying high signal in the myocardium at the apex and along the free wall of the left ventricle (LV). Horizontal long axis T2 (B) and T1 (D) mapping depicting prolonged T2 and T1 relaxation times at the same area and in the middle septum (D). Horizontal long axis image post gadolinium administration (C) showing late enhancement at the apex and along the free wall of LV. There is also pericardial enhancement along the free wall of LV.
- Citation: Ilieva E, Boyapati A, Chervenkov L, Gulinac M, Borisov J, Genova K, Velikova T. Imaging related to underlying immunological and pathological processes in COVID-19. World J Clin Infect Dis 2022; 12(1): 1-19
- URL: https://www.wjgnet.com/2220-3176/full/v12/i1/1.htm
- DOI: https://dx.doi.org/10.5495/wjcid.v12.i1.1


