Copyright
©The Author(s) 2021.
World J Clin Infect Dis. Nov 5, 2021; 11(3): 49-59
Published online Nov 5, 2021. doi: 10.5495/wjcid.v11.i3.49
Published online Nov 5, 2021. doi: 10.5495/wjcid.v11.i3.49
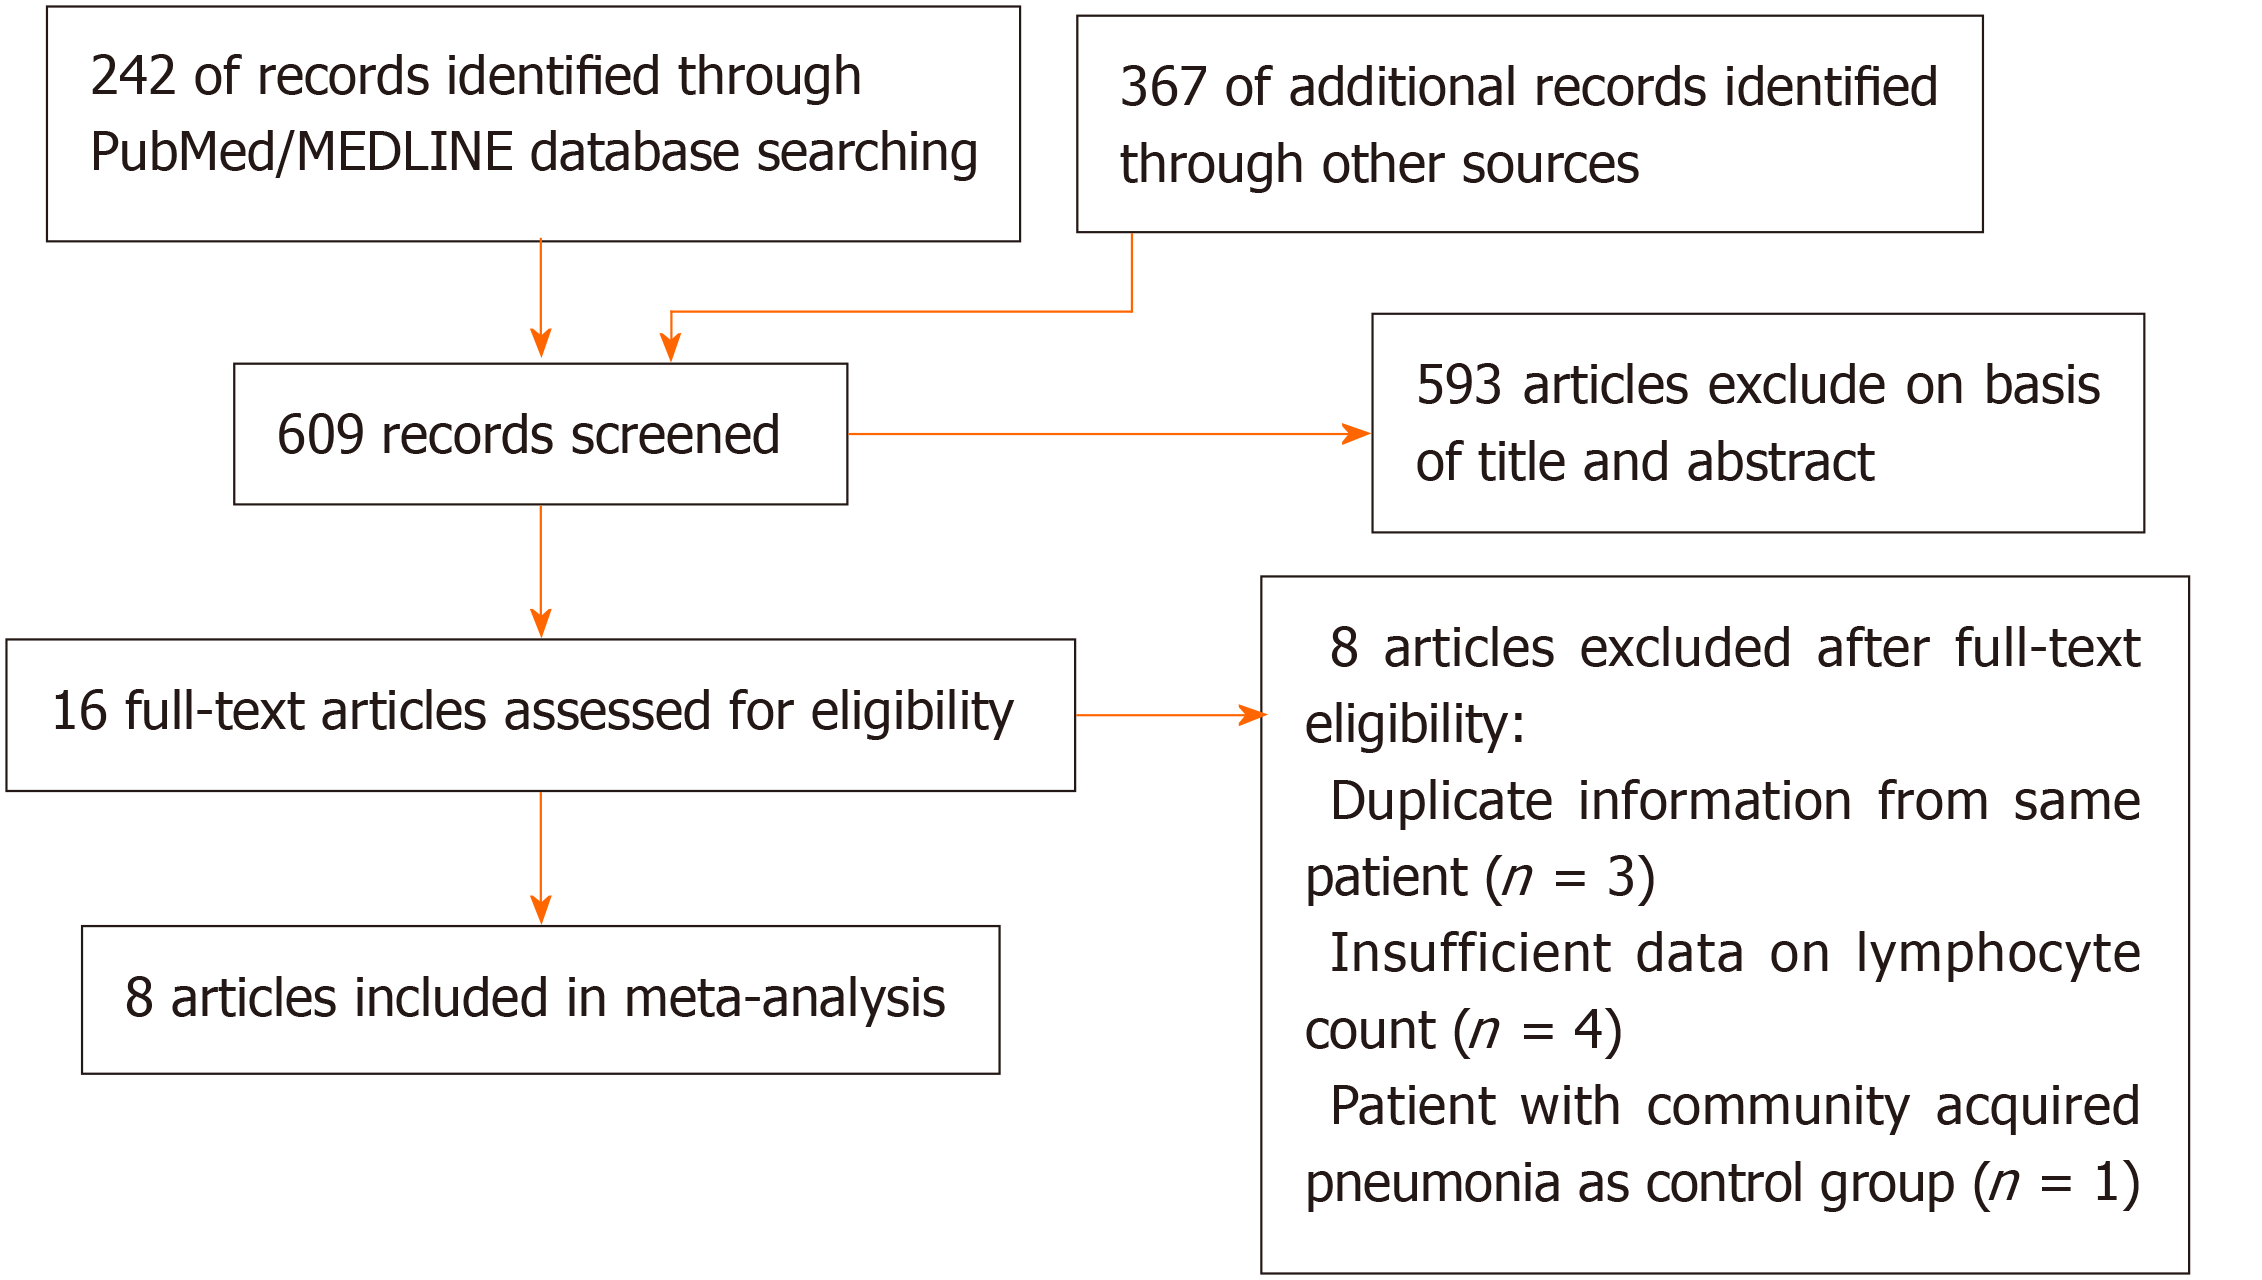
Figure 1 Article selection process.
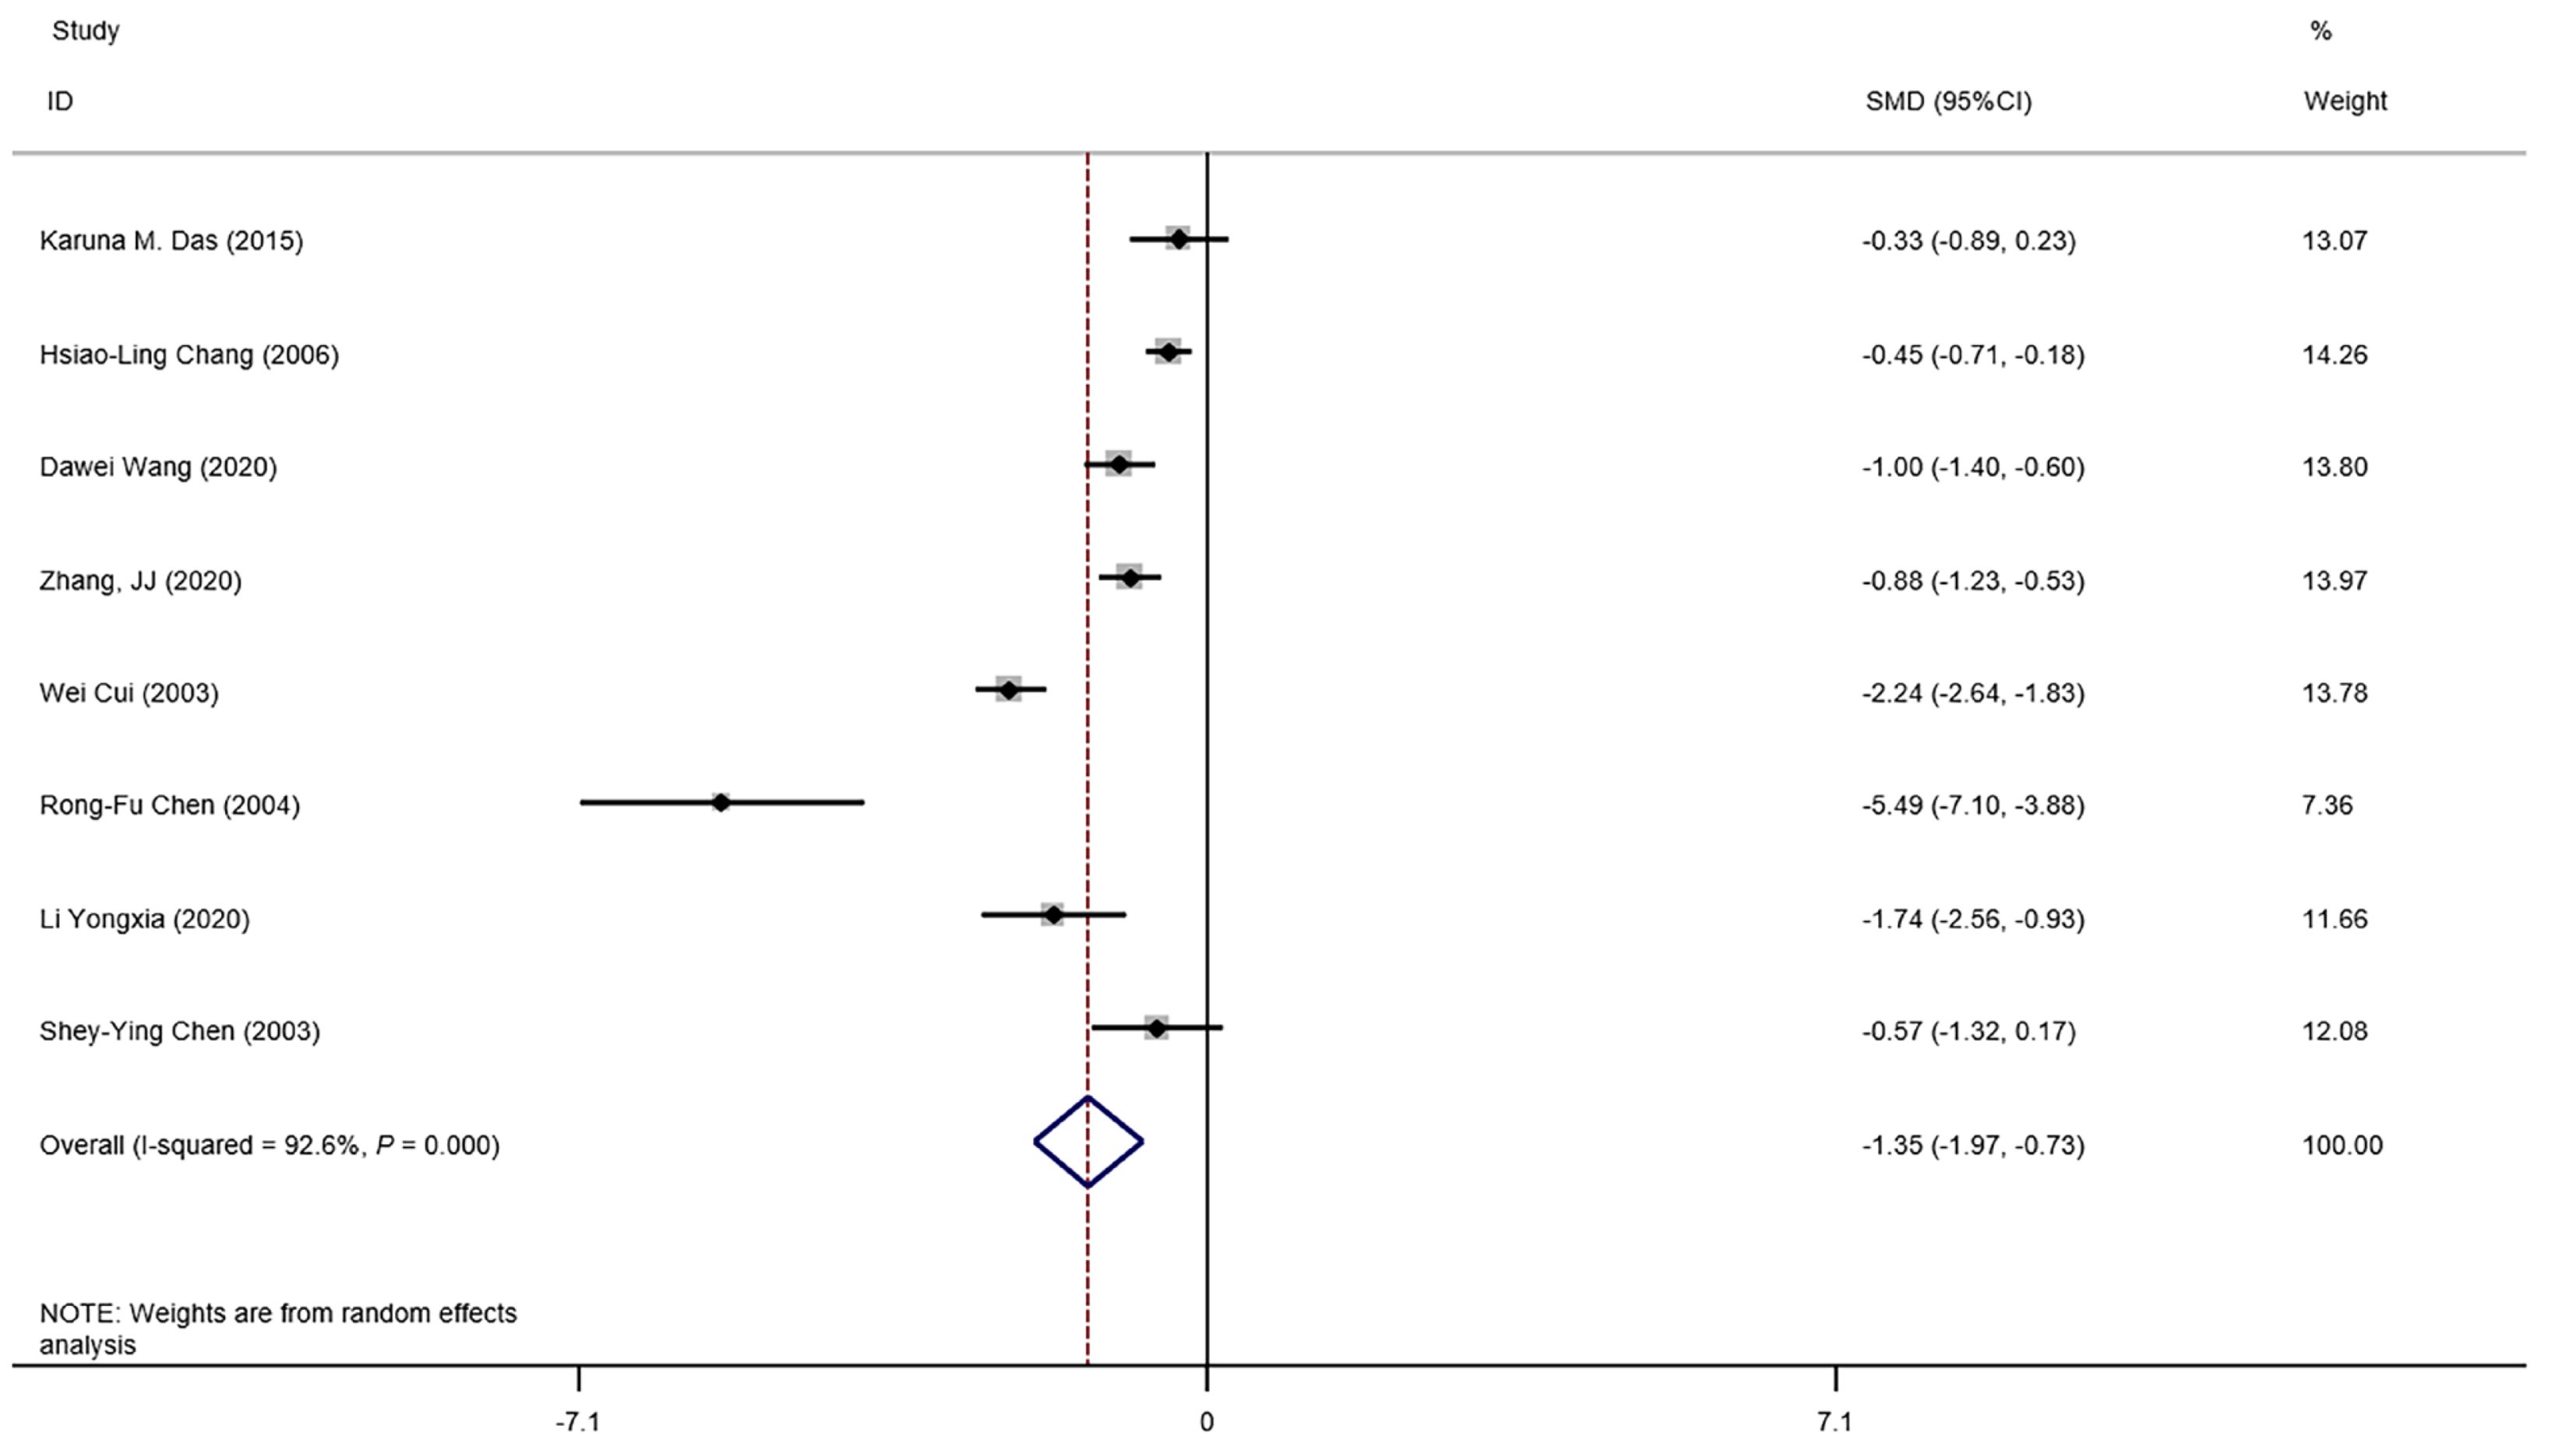
Figure 2 Forest plot: overall identification of lymphocyte count in patients with coronaviral pneumonia.
P = 0.000 means P < 0.001. CI: Confidence interval.
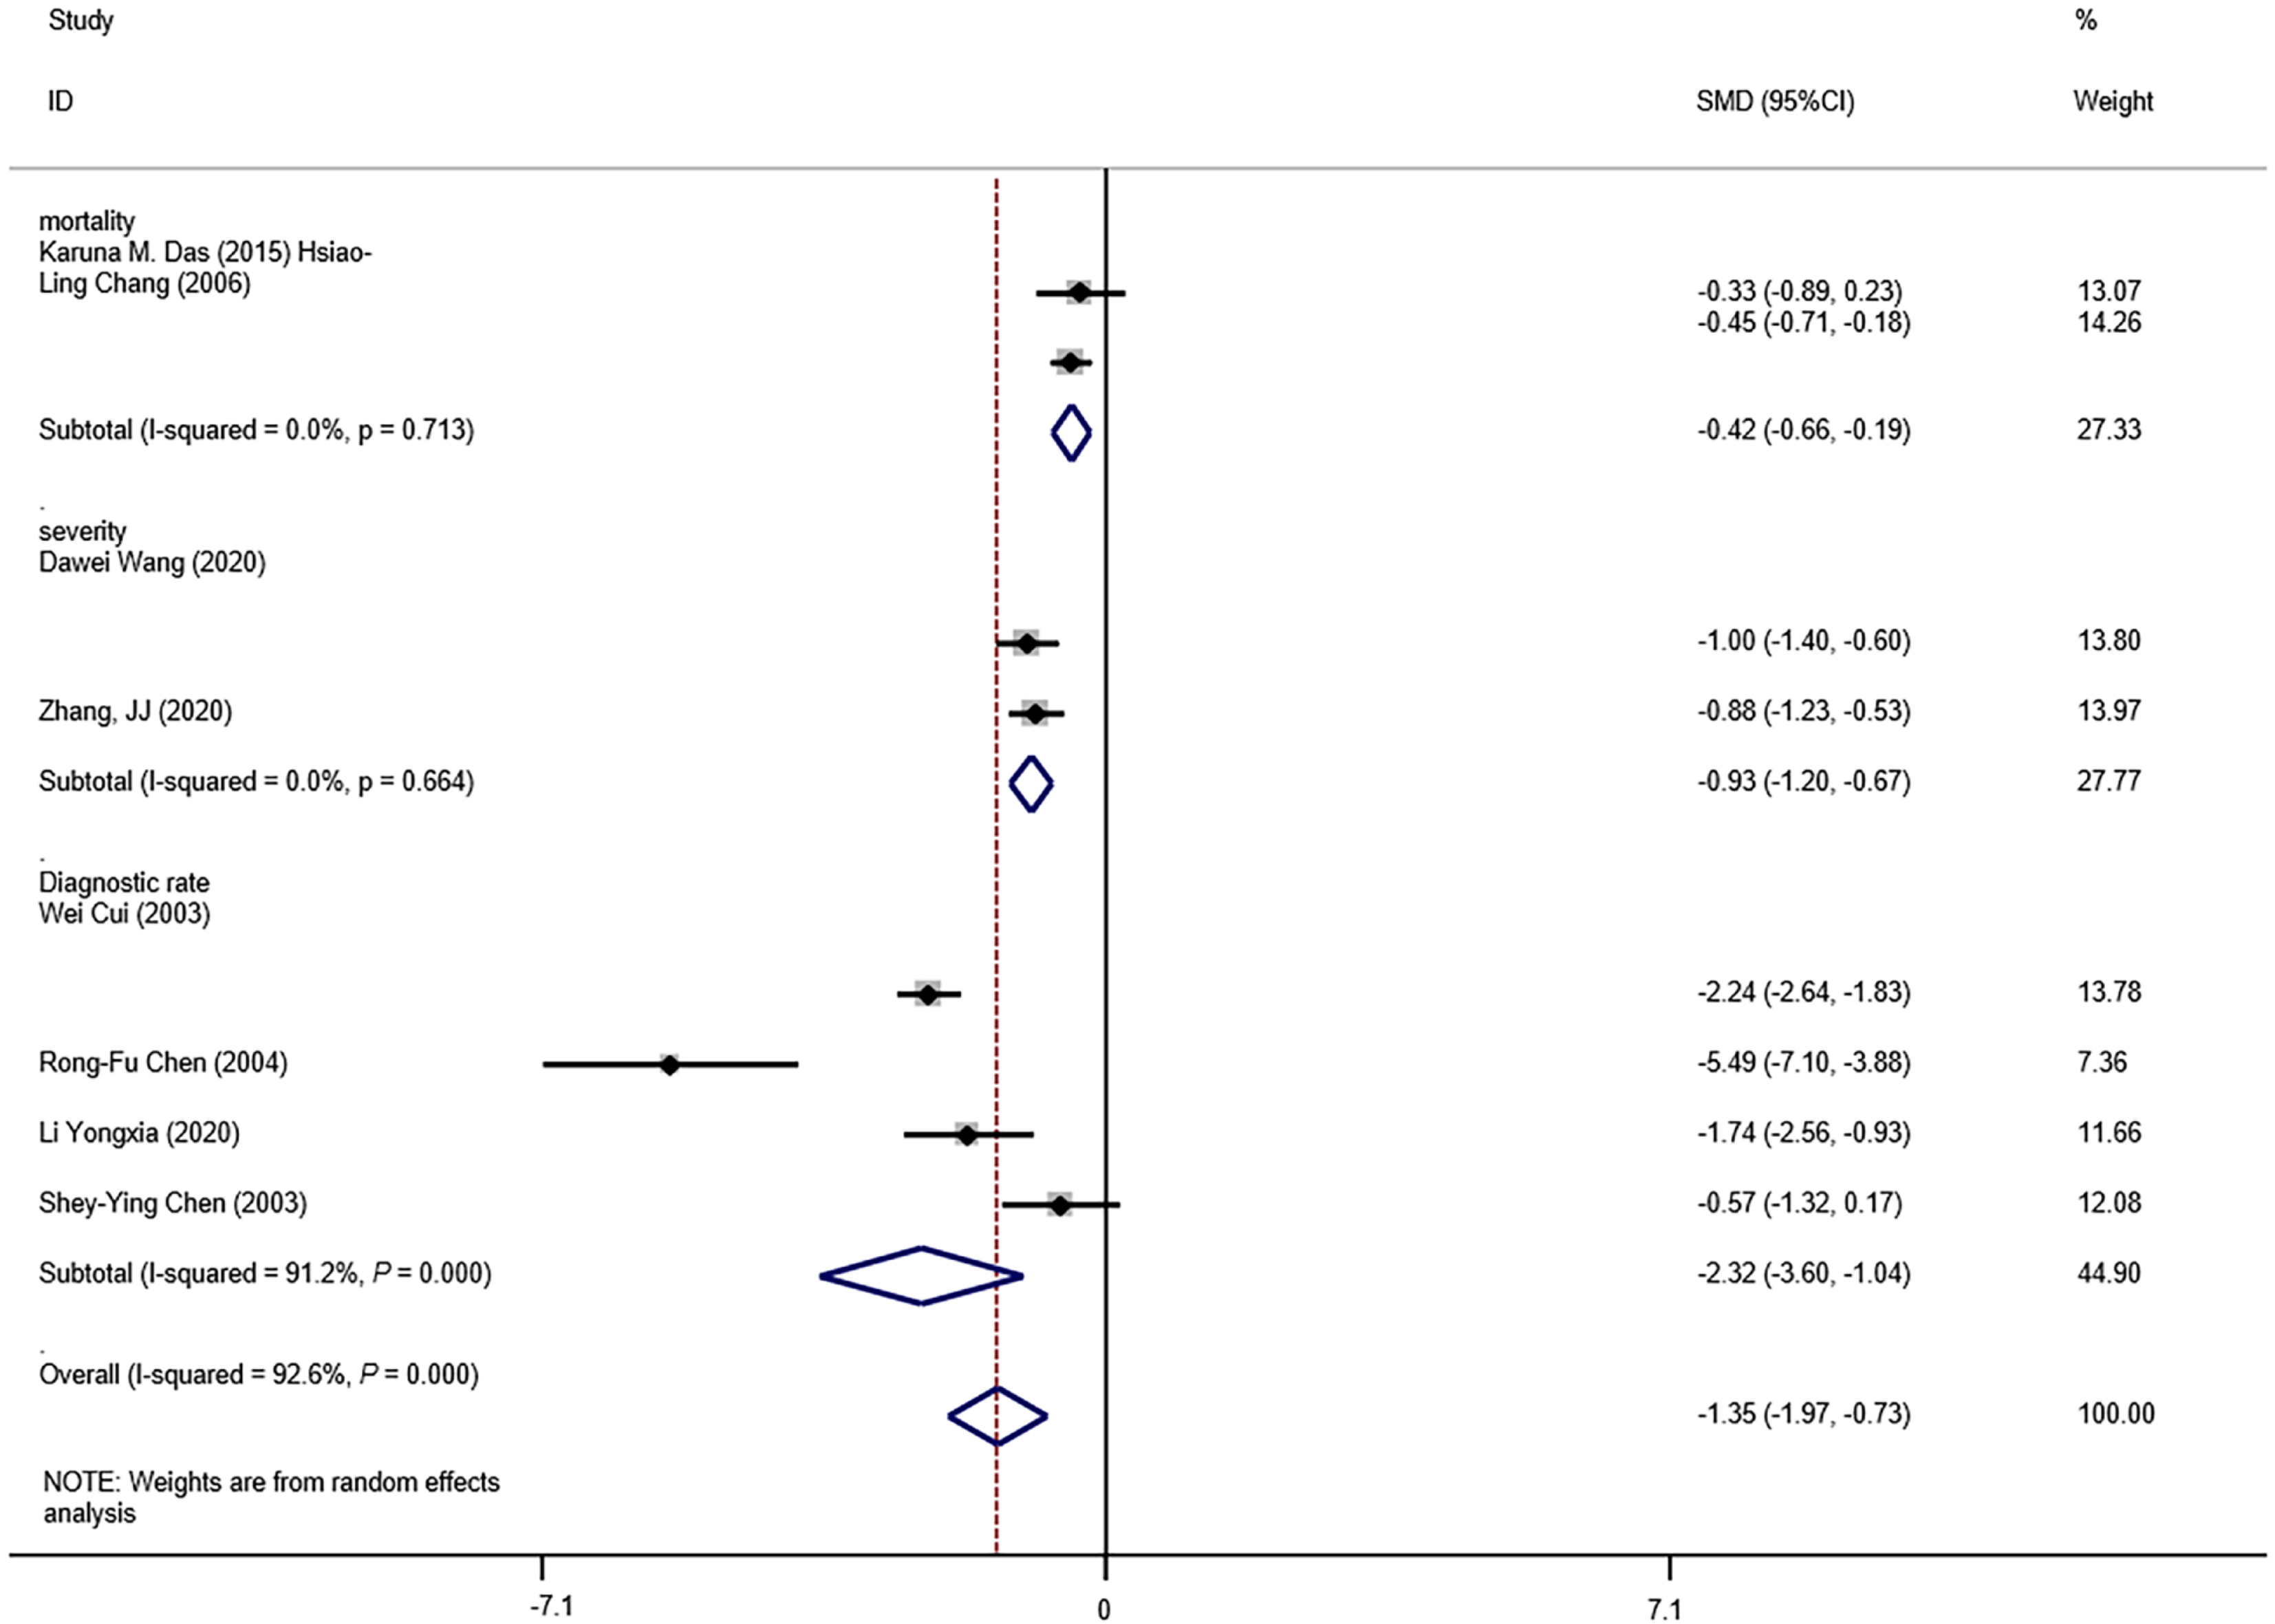
Figure 3 Forest plot: overall identification of lymphocyte count in patients with coronaviral pneumonia, subgroup analysis stratified by prognosis.
P = 0.000 means P < 0.001. CI: Confidence interval.
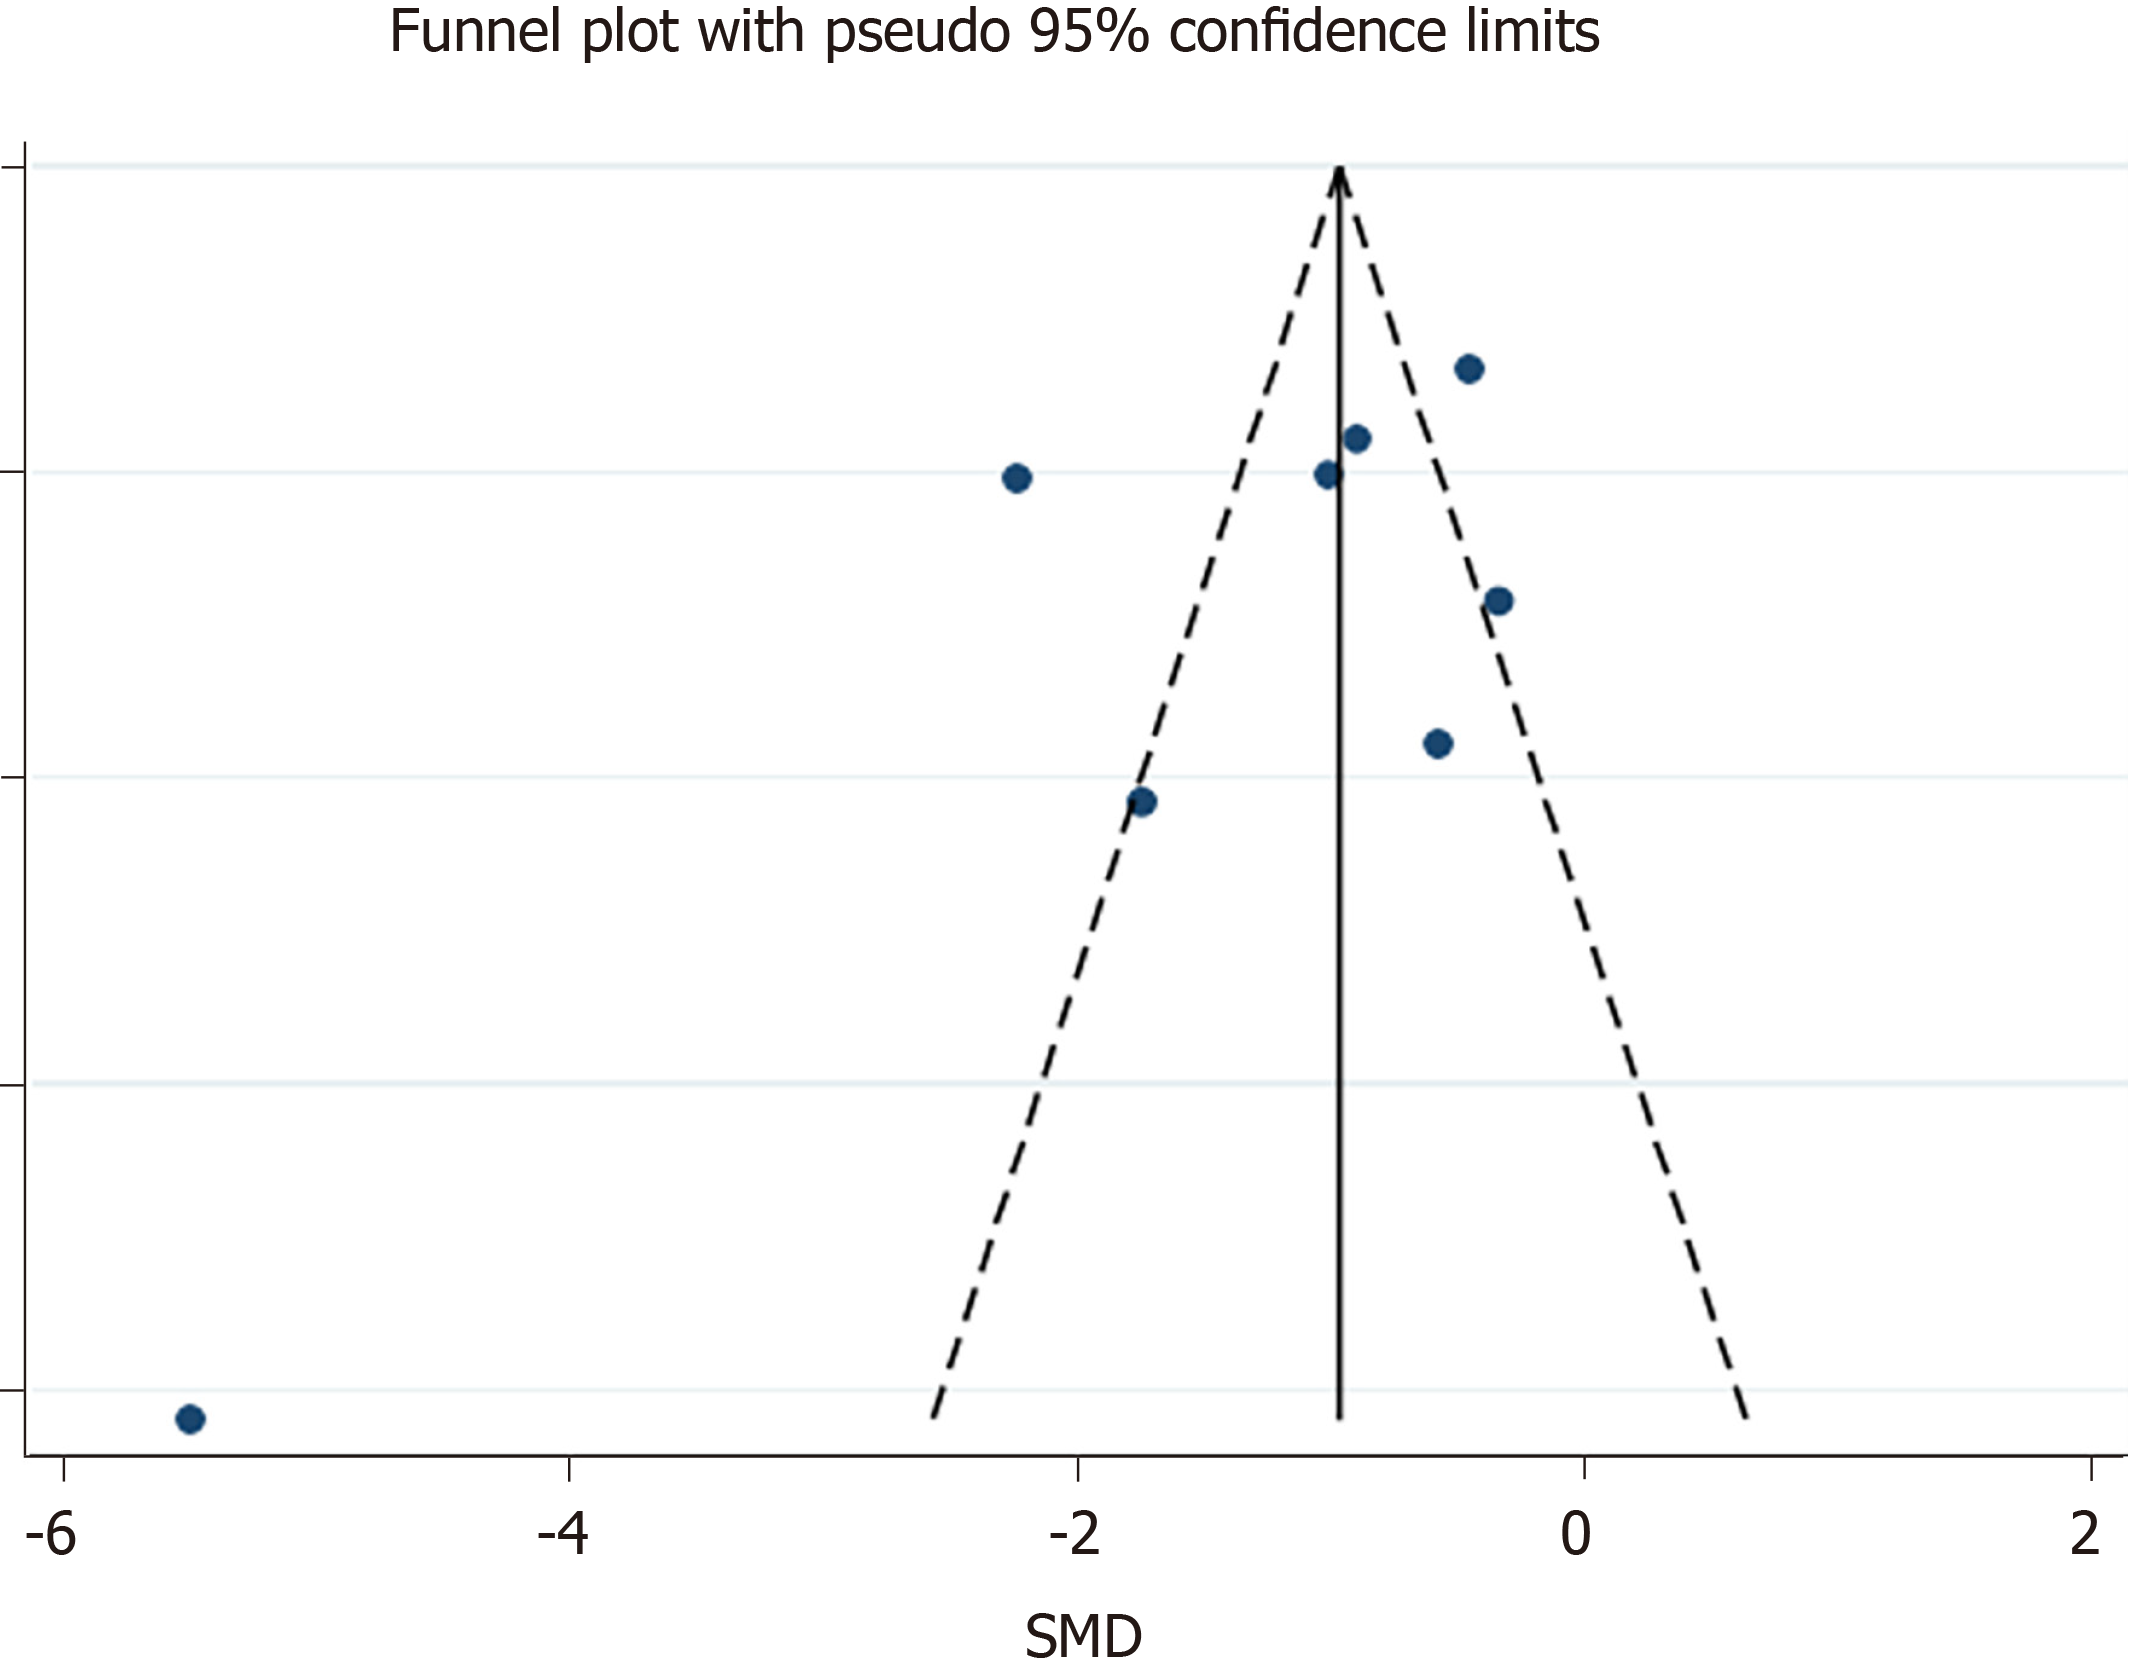
Figure 4 Funnel plot: publication bias of eight studies included.
- Citation: Zhao YS, Yu YX. Lymphocyte count predicts the severity of COVID-19: Evidence from a meta-analysis. World J Clin Infect Dis 2021; 11(3): 49-59
- URL: https://www.wjgnet.com/2220-3176/full/v11/i3/49.htm
- DOI: https://dx.doi.org/10.5495/wjcid.v11.i3.49


