Copyright
©The Author(s) 2019.
World J Hypertens. May 10, 2019; 9(2): 17-29
Published online May 10, 2019. doi: 10.5494/wjh.v9.i2.17
Published online May 10, 2019. doi: 10.5494/wjh.v9.i2.17
Figure 1 There is a significant increase in the right ventricular systolic pressure (RVSP) in the Monocrotaline (MCT, M) and hypoxia (H) groups compared with the controls (C), and a further increase in the MCT + hypoxia (M+H) group (1A, n = 7-8).
Similarly, significant right ventricular hypertrophy (RV/LV ratio) is present in the M and H groups; with a further increase in the M + H group (1B, n = 7-8). RV: Right ventricle; LV: Left ventricle. aP ≤ 0.05 vs Controls, cP < 0.05 vs MCT and/or hypoxia.
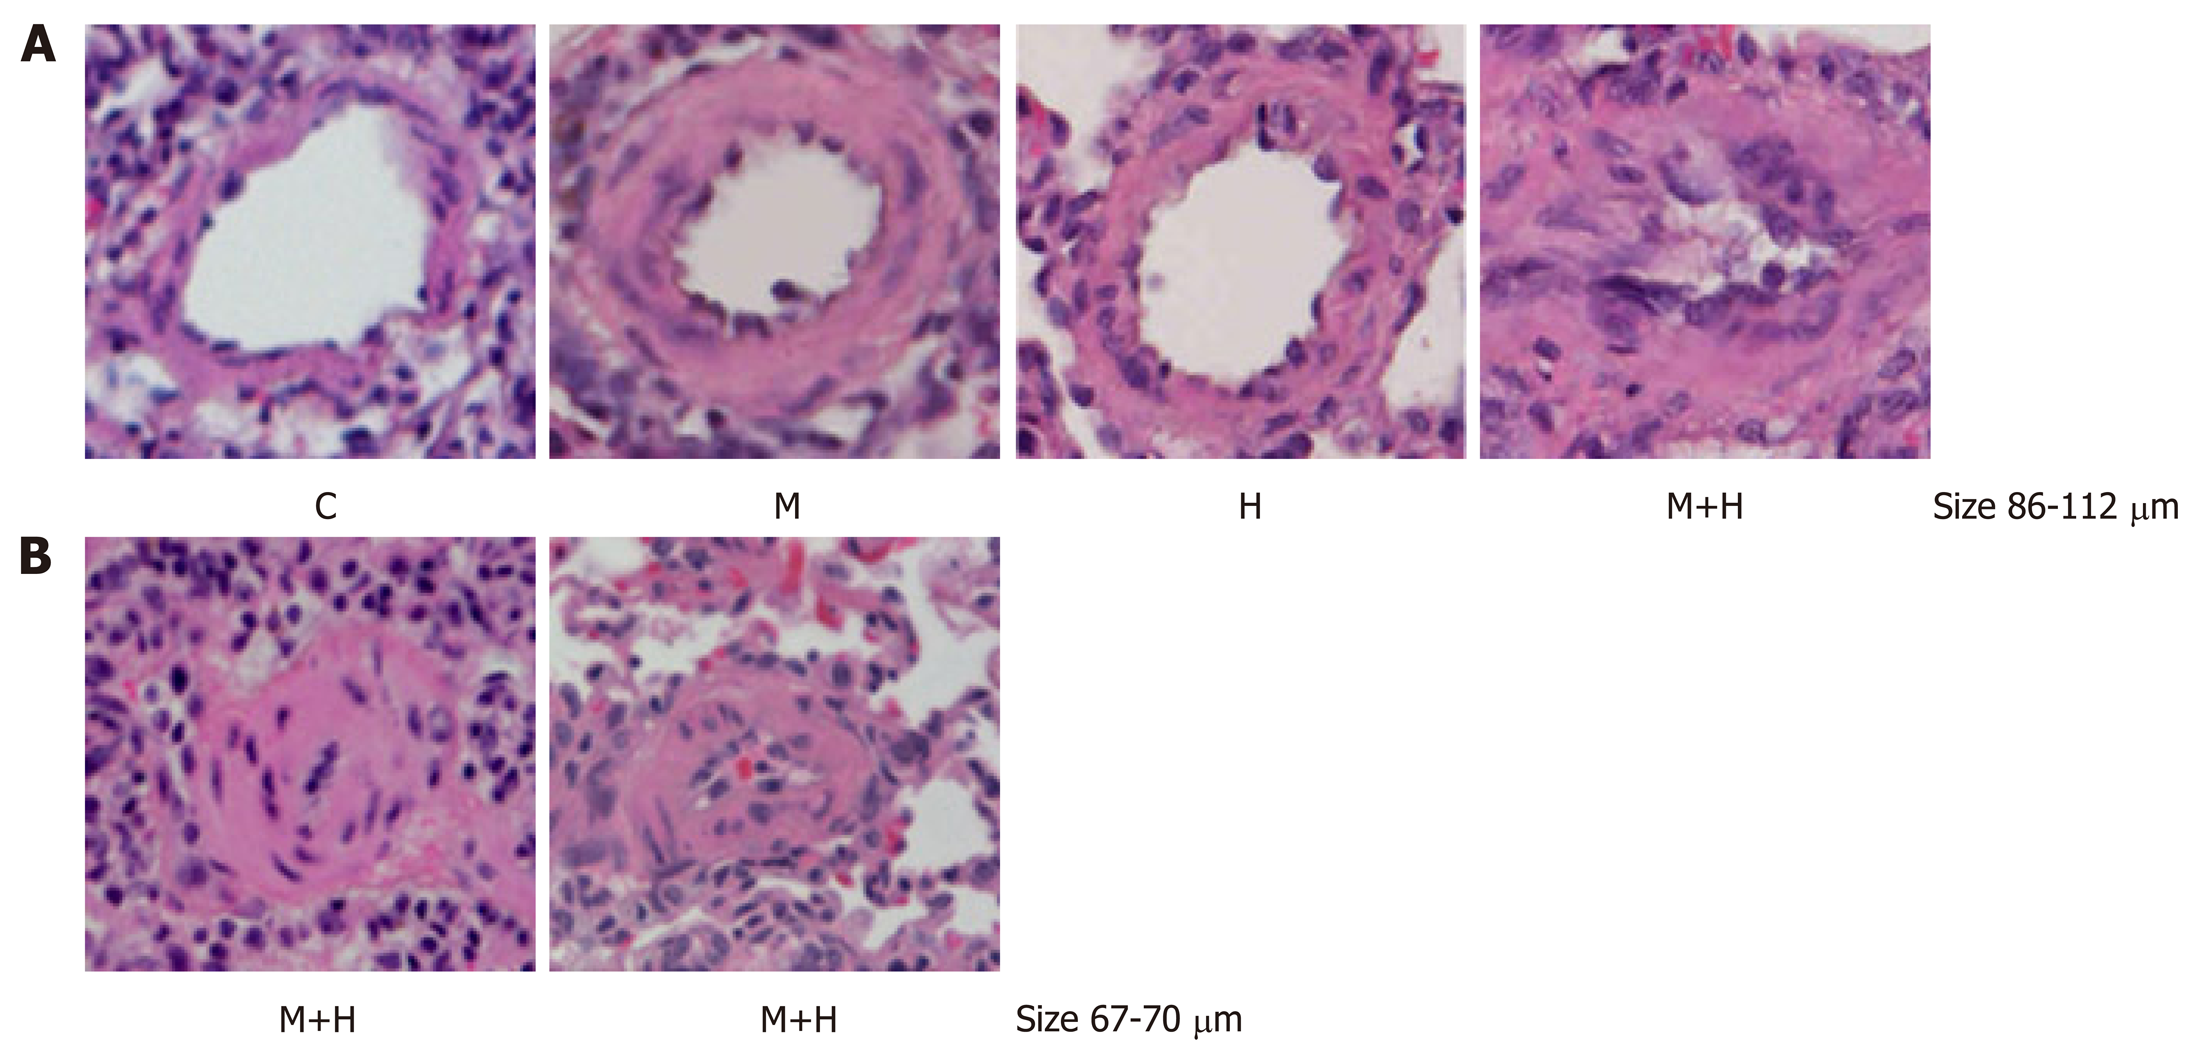
Figure 2 H&E stain of pulmonary arteries from the lungs of control (C), Monocrotaline (MCT, M), hypoxia (H) and MCT+ hypoxia (M+H) groups.
The top row (size 86-111 μm) shows significant medial thickening in the M and H groups; The M+H artery reveals greater medial thickening and neointima. The smaller arteries (size 67-70 μm) from M+H group show almost complete obliteration of the lumen.
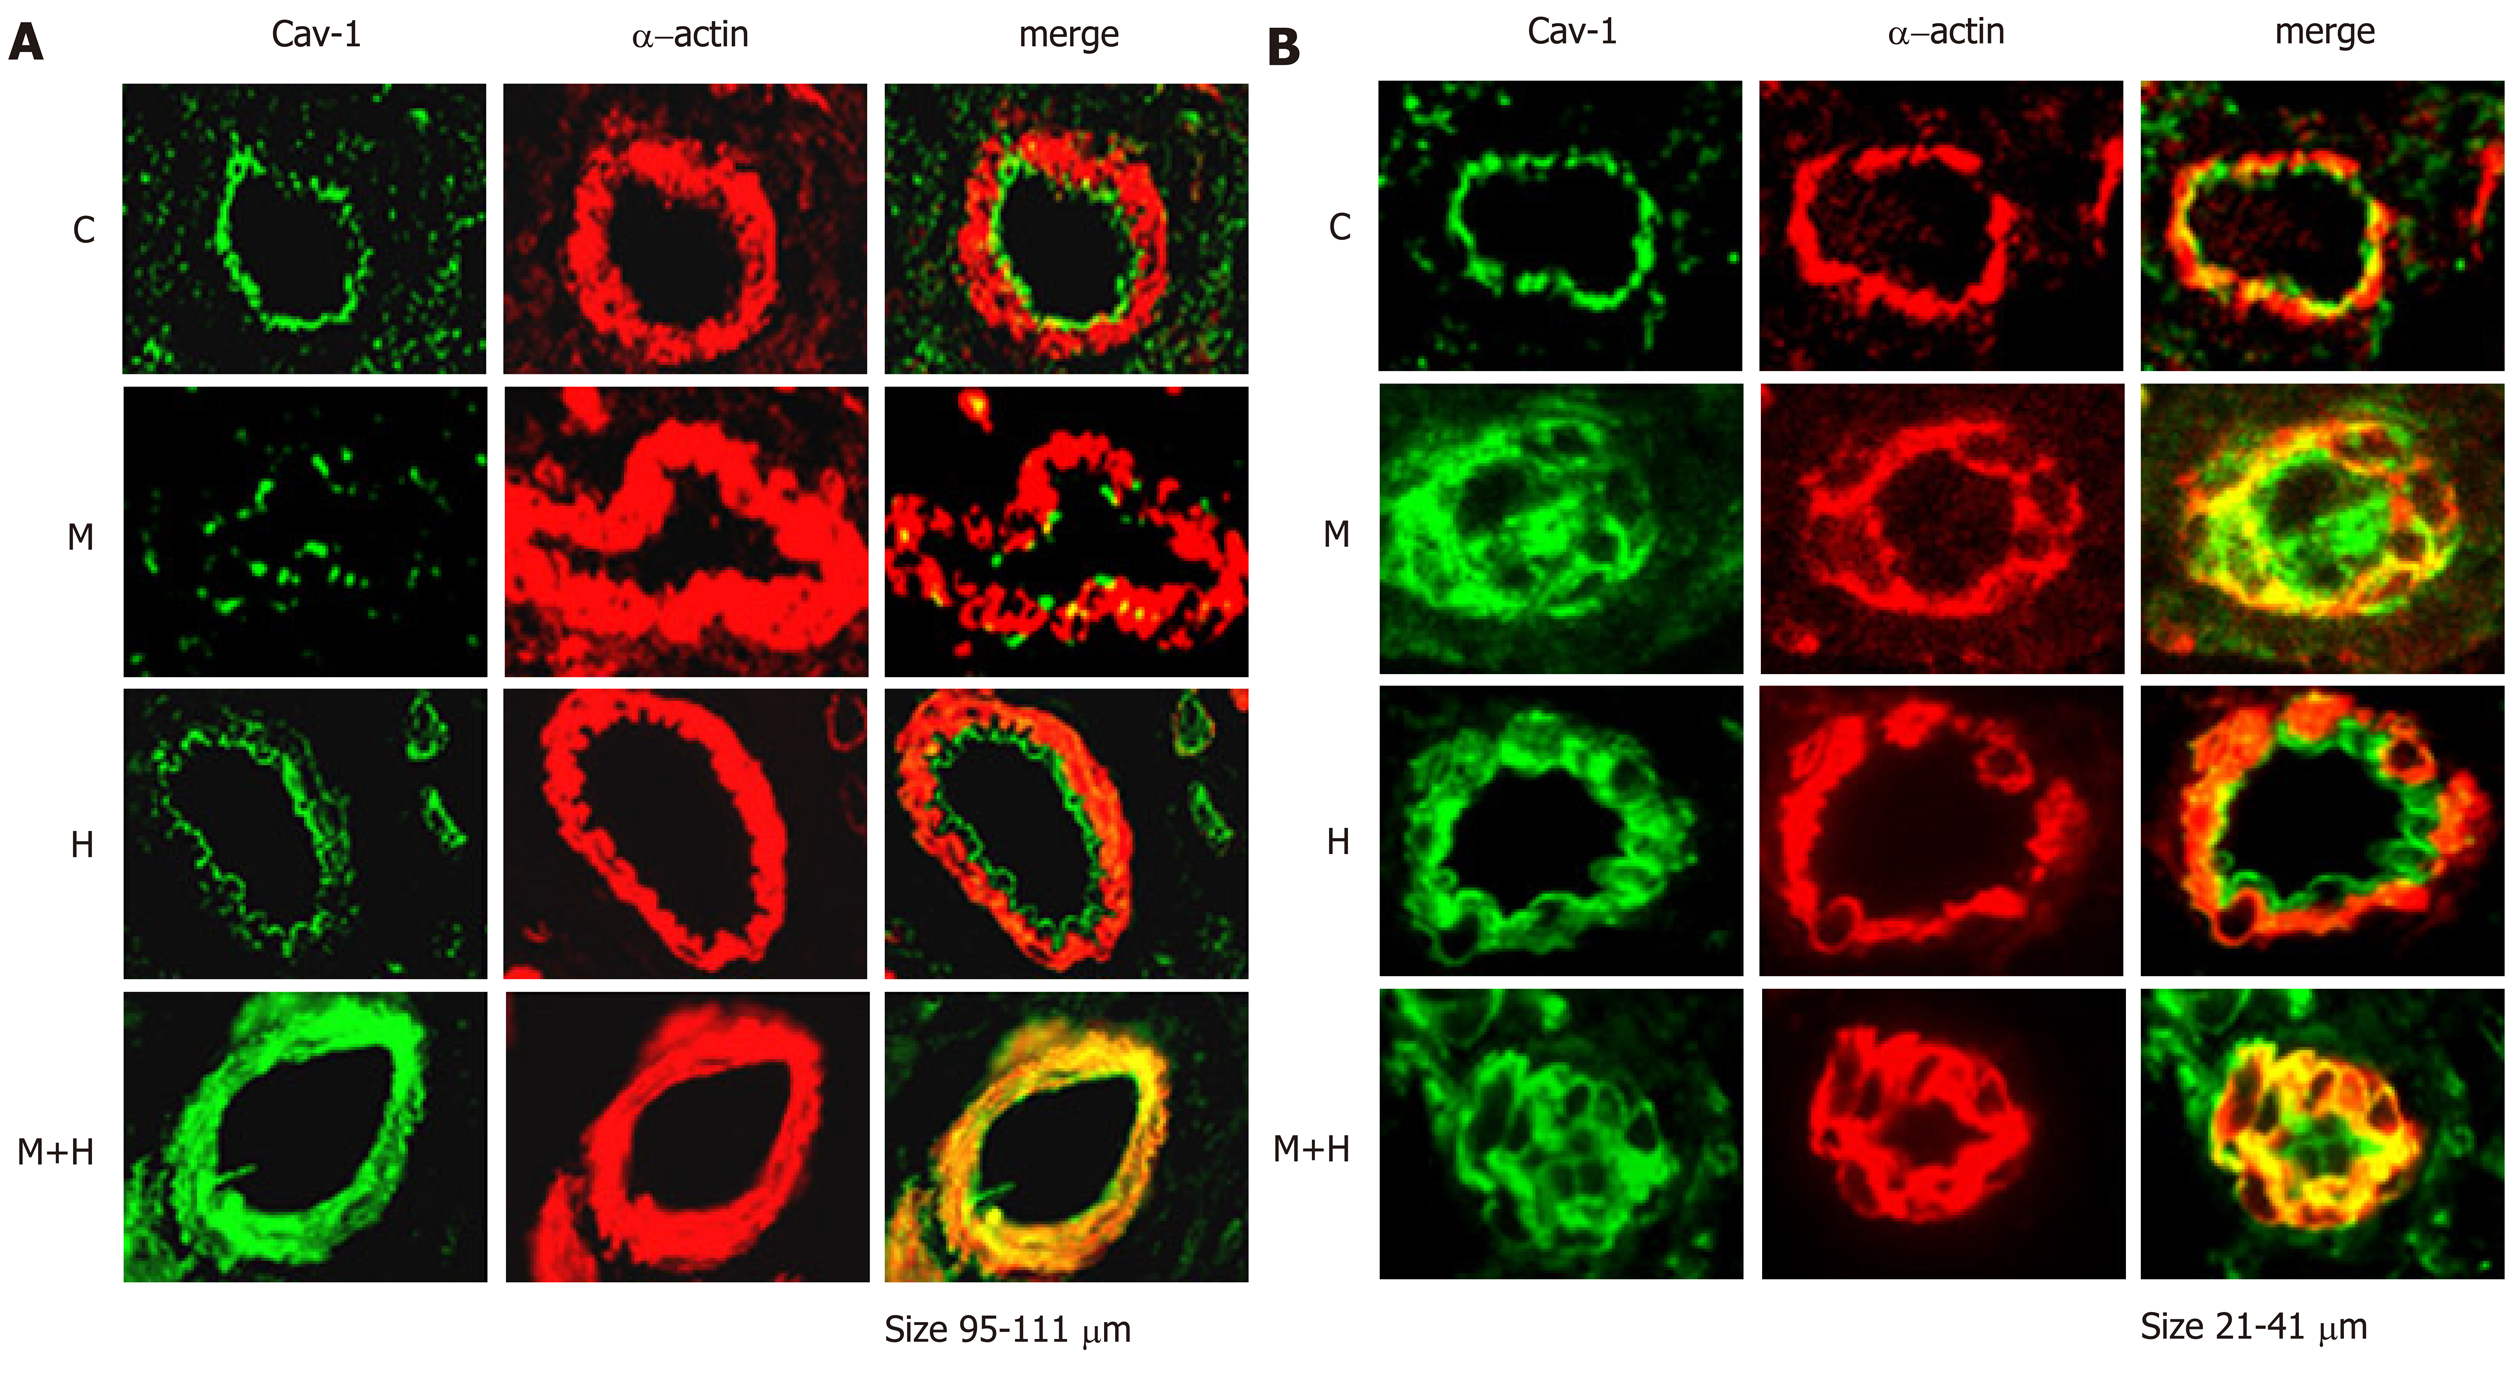
Figure 3 Double immunofluorescence study showing the expression of cav-1 (green) and smooth muscle α-actin (red) in pulmonary arteries from control (C), Monocrotaline (MCT, M), H (hypoxia) and MCT + hypoxia (M+H) groups.
A: Arteries (size 95-111 μm) from C and H depict well preserved cav-1 expression in the endothelial layer and no evidence of enhanced expression of cav-1 in SMC. Artery from M shows significant loss of endothelial cav-1; and the artery from M+H shows complete loss of endothelial cav-1 and enhanced expression of cav-1 in SMC; B: Arteries (size 21-41 μm) from C and H show well preserved endothelial cav-1 and the absence of enhanced expression of cav-1 in SMC. The arteries from both M and M+H show loss of endothelial cav-1 and enhanced expression of cav-1 in SMC and almost occluded lumen in the M+H.
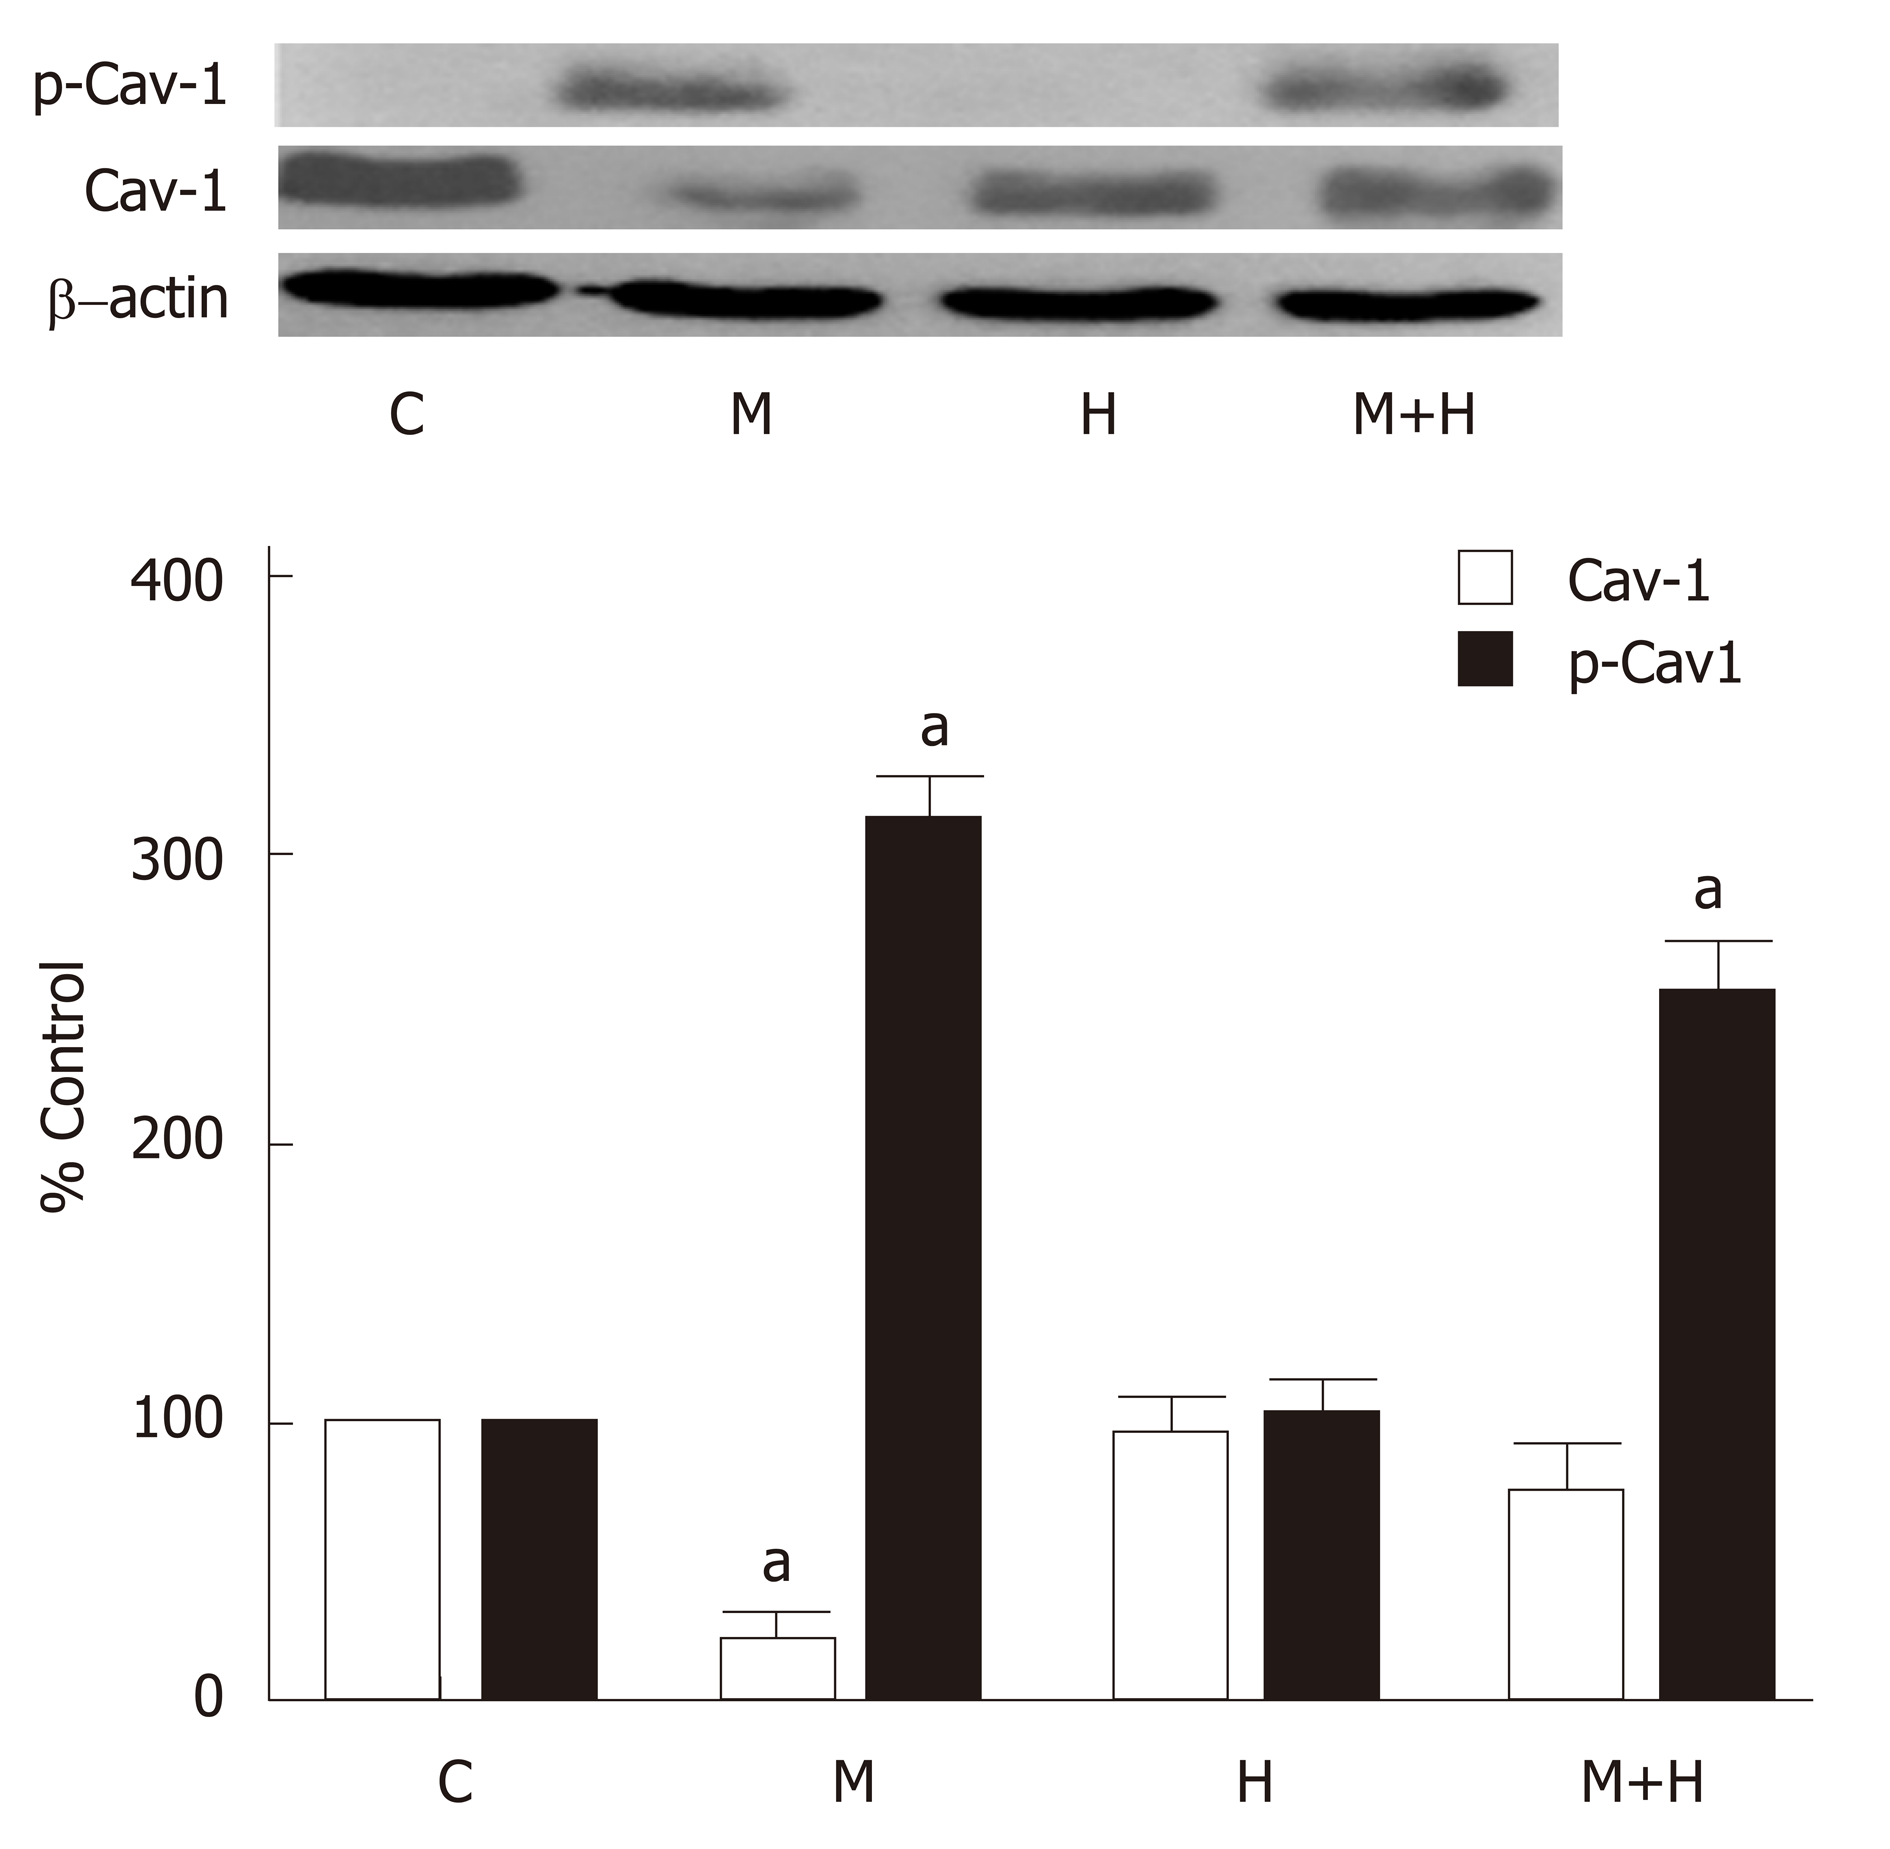
Figure 4 A representative western blot and bar graph depicting the expression of cav-1 and Tyr 14 p-cav-1 in the lungs from controls (C), Monocrotaline (MCT, M), hypoxia (H) and MCT + Hypoxia (M+H) groups (n = 5-6).
β-actin was used as a loading control. There is a significant loss of cav-1 in M group, but in M + H group, cav-1 expression is nearly normal. P-cav-1 is increased in M and M+H groups. Cav-1 expression in the H group is not altered, and p-cav-1 expression is not observed. aP < 0.05 vs C.
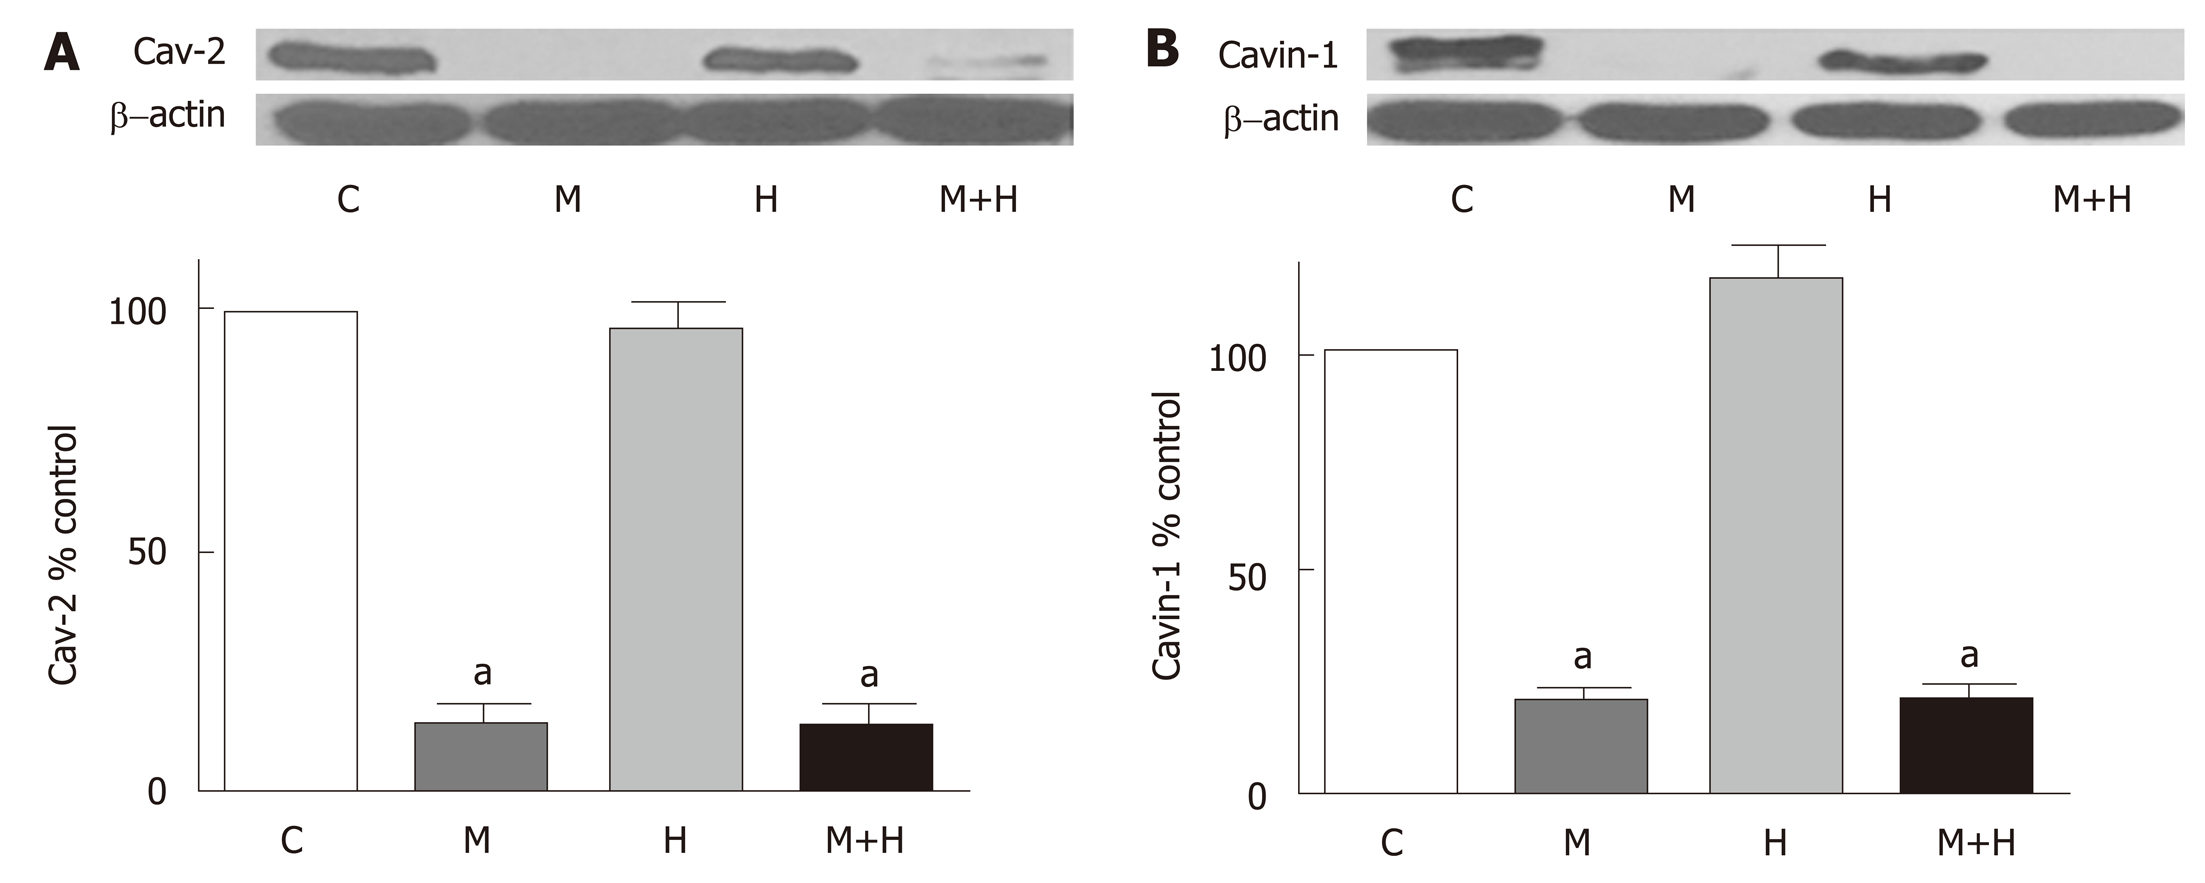
Figure 5 Representative western blot and bar graph depicting the expression of cav-2 (n = 7-8) and cavin1 (n = 6-8) in the lungs from controls (C), Monocrotaline (MCT, M), hypoxia (H) and MCT + hypoxia (M+H) groups.
There is a significant loss of cav-2 (A) and cavin-1 (B) in the M and M+H groups compared with C. There are no alterations in the expression of cav-2 or cavin-1 in the H group. aP < 0.05 vs C.
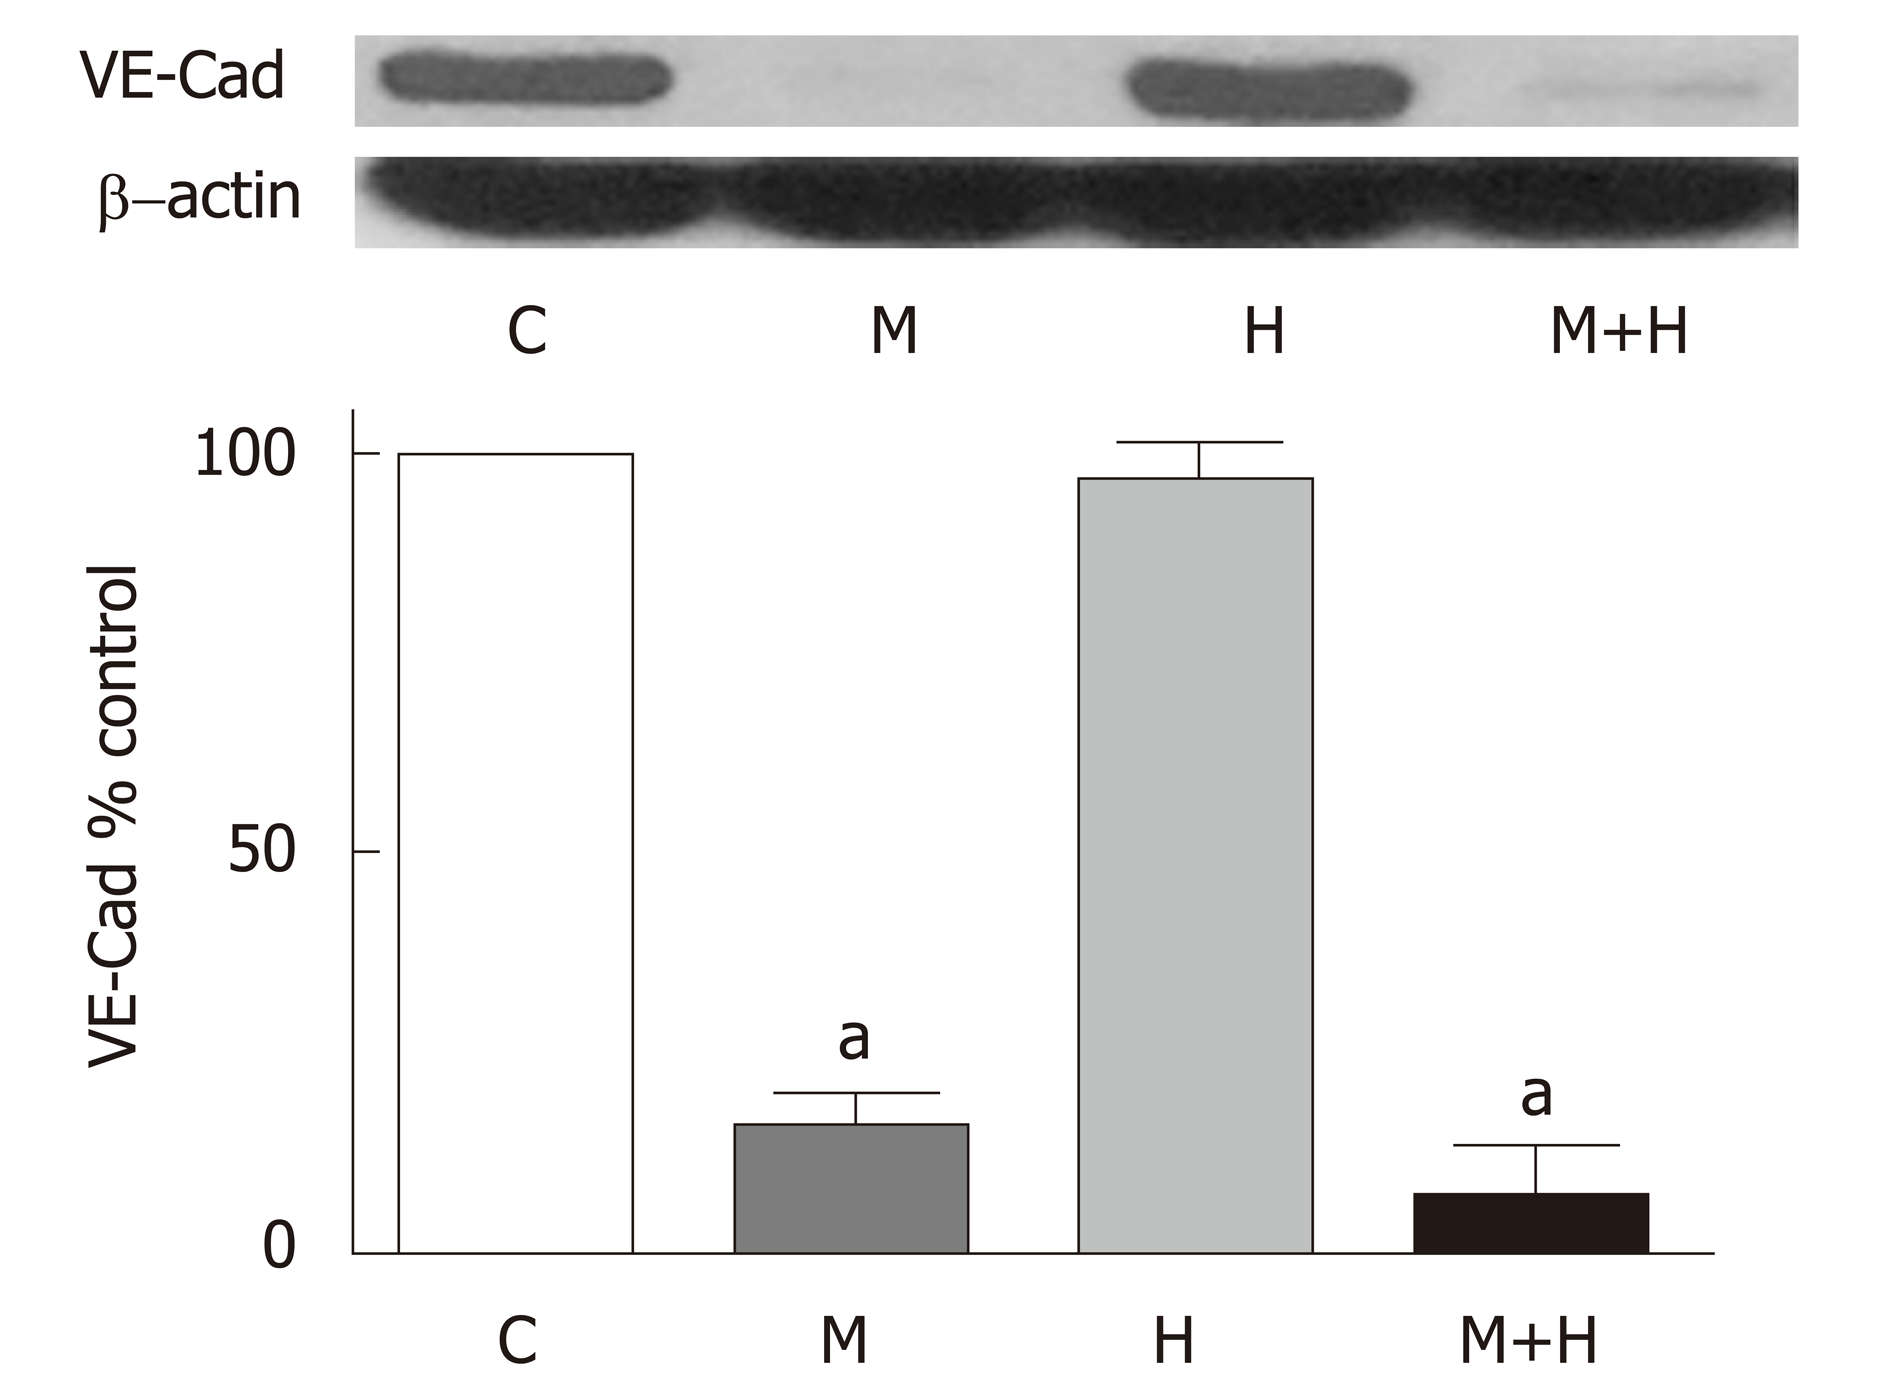
Figure 6 Representative western blot and bar graph depicting the expression of VE-Cad (n = 5).
There is a significant loss of VE-Cad in Monocrotaline (MCT, M), and MCT + hypoxia (M + H) groups compared with C, but there is no alteration in its expression in the hypoxia (H) group. aP < 0.05 vs C.
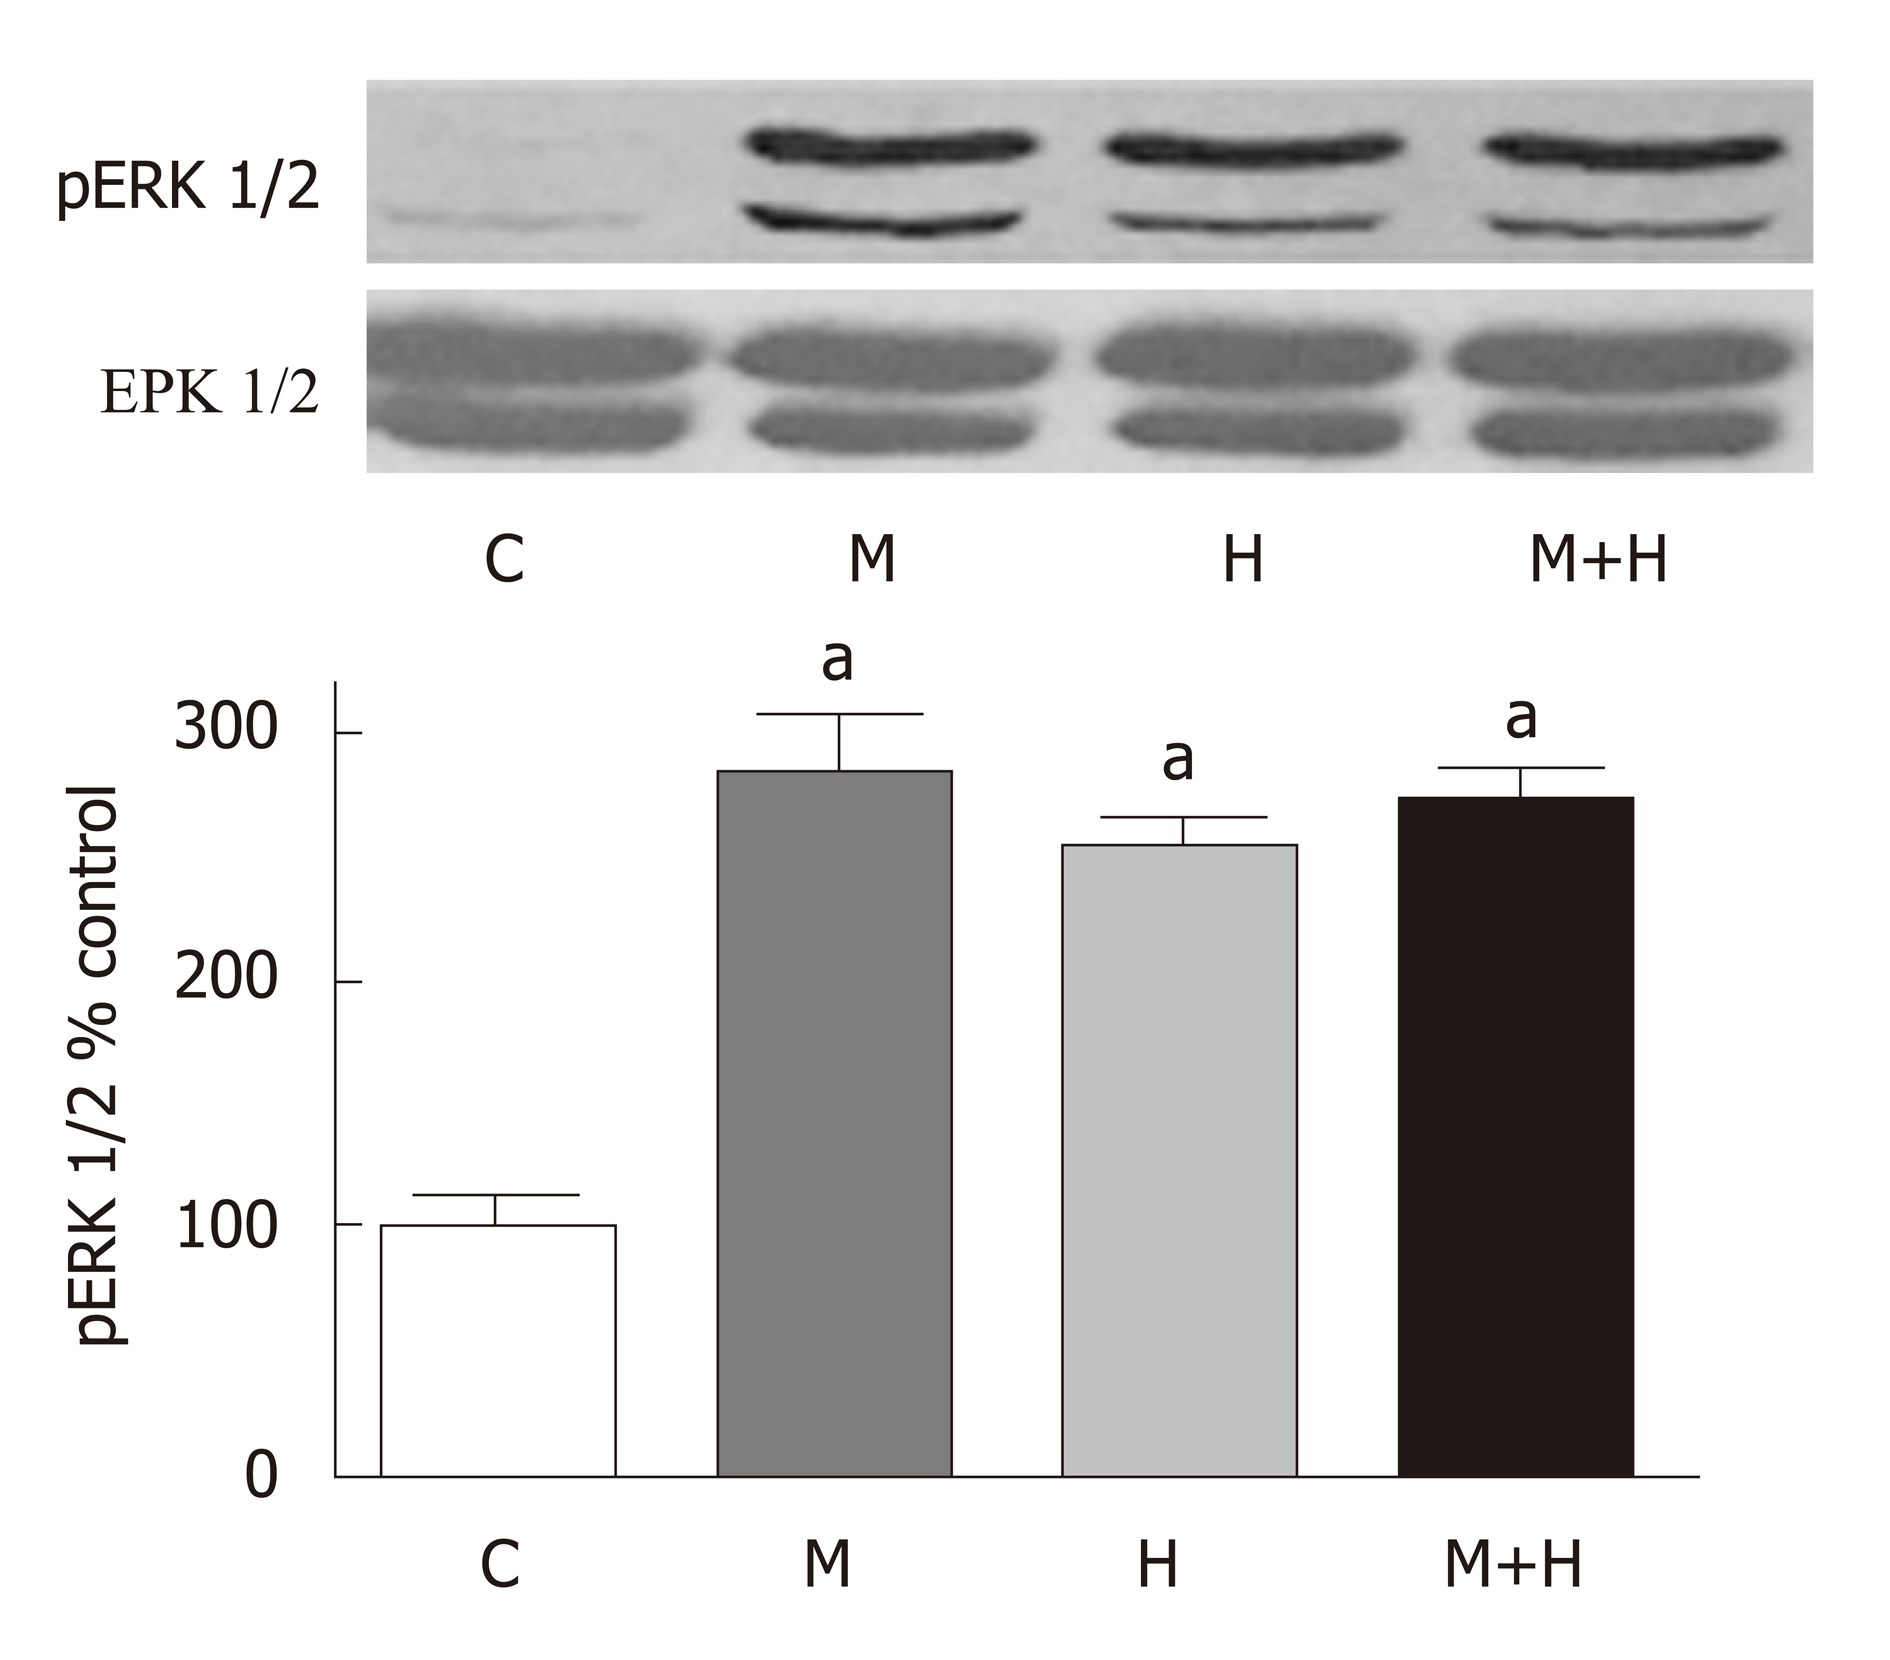
Figure 7 Representative western blot and a bar graph showing the expression of ERK1/2 and p-ERK in controls (C), Monocrotaline (MCT, M), hypoxia (H) and MCT + hypoxia (M+H).
P-ERK1/2 is activated in M, H and M+H groups (n = 5-7). aP < 0.05 vs C.
- Citation: Huang J, Mathew R. Loss of cavin1 and expression of p-caveolin-1 in pulmonary hypertension: Possible role in neointima formation. World J Hypertens 2019; 9(2): 17-29
- URL: https://www.wjgnet.com/2220-3168/full/v9/i2/17.htm
- DOI: https://dx.doi.org/10.5494/wjh.v9.i2.17


