Copyright
©The Author(s) 2015.
World J Hypertens. May 23, 2015; 5(2): 74-78
Published online May 23, 2015. doi: 10.5494/wjh.v5.i2.74
Published online May 23, 2015. doi: 10.5494/wjh.v5.i2.74
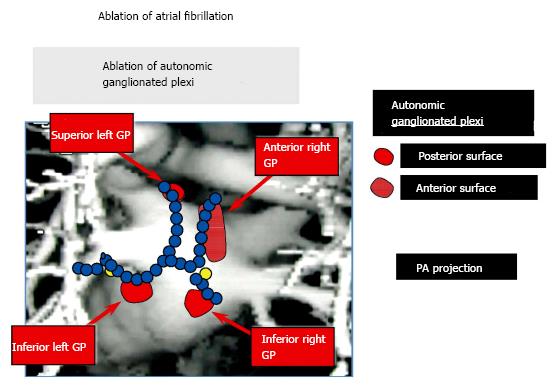
Figure 1 An anatomic figure of the left atrium depicting the lines of radiofrequency applications used to isolate the pulmonary veins in patients undergoing catheter ablation for atrial fibrillation.
Note that the lesion lines may, in part, also ablate the ganglionated plexi (GP), albeit incompletely. These nerve clusters are situated at the pulmonary vein - atrial junctions and contribute to the neural basis of atrial fibrillation[12].
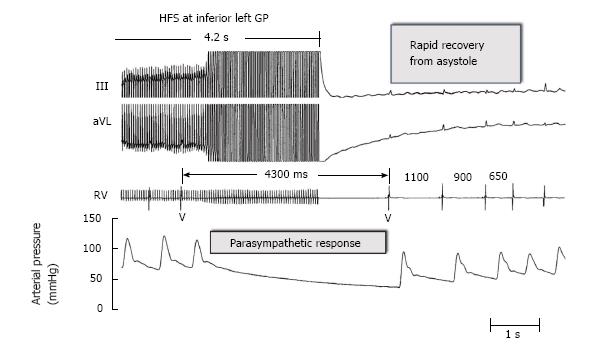
Figure 2 The use of high frequency electrical stimulation applied to the left ganglionated plexi in a patient with atrial fibrillation induced a marked slowing of the ventricular rate by a parasympathetic response at the A-V node.
The ensuing heart block manifested an asystolic pause of 4300 milliseconds (ms) which showed a rapid recovery with the cessation of electrical stimulation. The traces from above are: Leads III and aVL of the electrocardiogram; an electrogram recorded from the right ventricle (RV); and arterial blood pressure. GP: Ganglionated plexi; HFS: High-frequency stimulation.
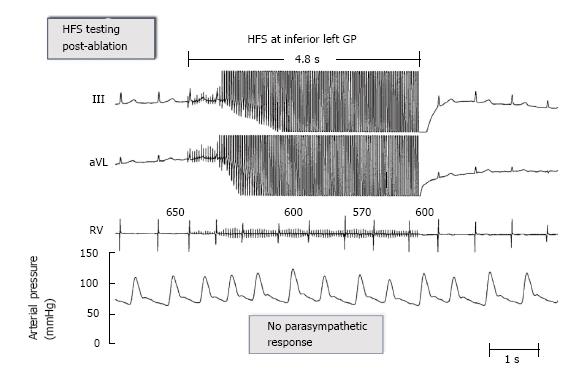
Figure 3 After ablation of the ganglionated plexi at the pulmonary vein-atrial junctions the same level of high frequency stimulation failed to elicit any parasympathetic response and no slowing of the ventricular rate.
Traces are the same as in figure 2. See text for further discussion. GP: Ganglionated plexi; HFS: High-frequency stimulation.
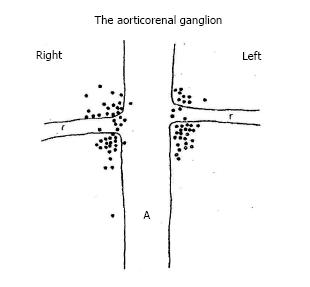
Figure 4 Diagrammatic representation of the junction of the aorta (A) and the renal arteries (R).
The dots indicate the localization of the aorticorenal ganglia determined by detailed dissection in 57 cadavers[15].
- Citation: Scherlag BJ, Po SS. Symplicity-3 hypertension trial: Basic and clinical insights. World J Hypertens 2015; 5(2): 74-78
- URL: https://www.wjgnet.com/2220-3168/full/v5/i2/74.htm
- DOI: https://dx.doi.org/10.5494/wjh.v5.i2.74


