Copyright
©The Author(s) 2015.
World J Hypertens. May 23, 2015; 5(2): 41-52
Published online May 23, 2015. doi: 10.5494/wjh.v5.i2.41
Published online May 23, 2015. doi: 10.5494/wjh.v5.i2.41
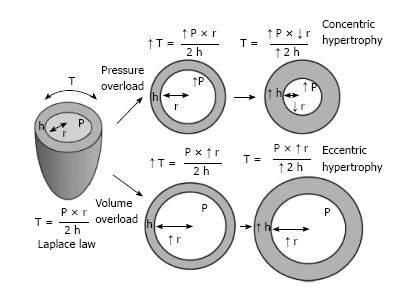
Figure 1 The Laplace law and how it may explain the development of concentric and eccentric left ventricular hypertrophy in response to pressure and volume overload, respectively.
Reproduced from Nadruz and Hum[2], 2015; Frolich and Susic[29], 2012. T: Tension or stress in the LV wall; P: LV pressure; r: Radius of the chamber; h: LV wall thickness.
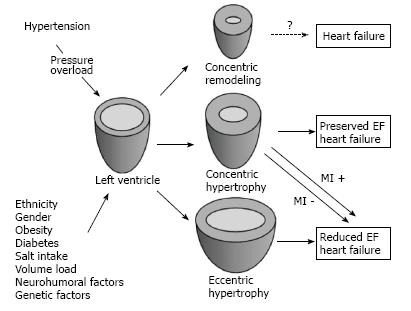
Figure 2 Pathways of left ventricular remodeling progression secondary to systemic hypertension.
Reproduced from Nadruz and Hum[2], 2015. EF: Ejection fraction; MI: Myocardial infarction.
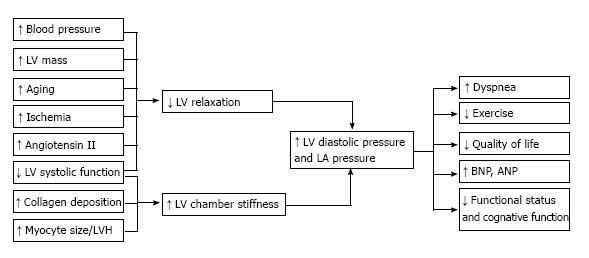
Figure 3 Causes of left ventricular diastolic dysfunction and its clinical consequences.
Reproduced from Phillips and Diamond[48], 2001. ANP: Atrial natriuretic peptide; BNP: Brain natriuretic peptide; LA: Left atrial; LVH: Left ventricular hypertrophy.
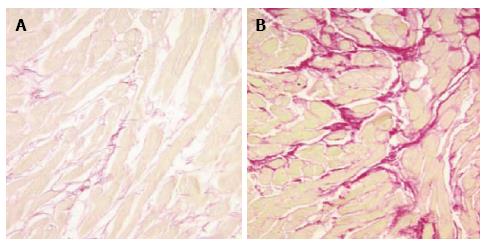
Figure 4 Comparison of collagen fibers in endomyocardial tissue.
A: Specimen from a normotensive person; B: Specimen from a patient with hypertensive heart disease. The sections were stained with picrosirius red. Collagen fibers are stained red. Reproduced from Deiz et al[54], 2005.
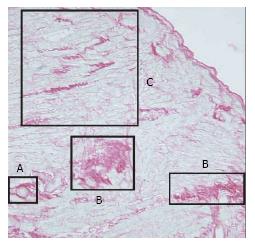
Figure 5 Endomyocardial tissue from a hypertensive patient with left ventricular hypertrophy.
A: Perivascular fibrosis; B: Microscopic scarring; C: Interstitial fibrosis. Sections were stained with picrosirius red. Collagen tissue is stained red. Reproduced from Diez[56] 2007.
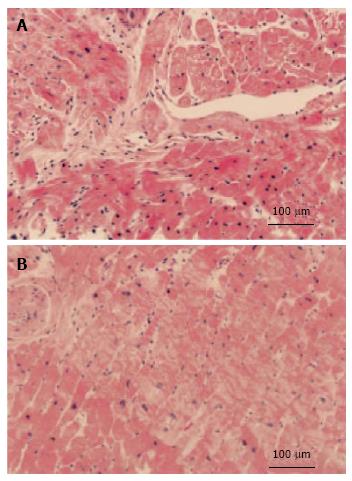
Figure 6 Representative cross sections of myocardial biopsy specimens.
A: Hypertrophic cardiomyopathy showing disorganized arrangement of hypertrophic myocytes; B: Hypertensive cardiomyopathy patients showing parallel alignment of hypertrophic myocytes. Sections were stained with hematoxylin-eosin. (Reproduced from Kato et al[62], 2004).
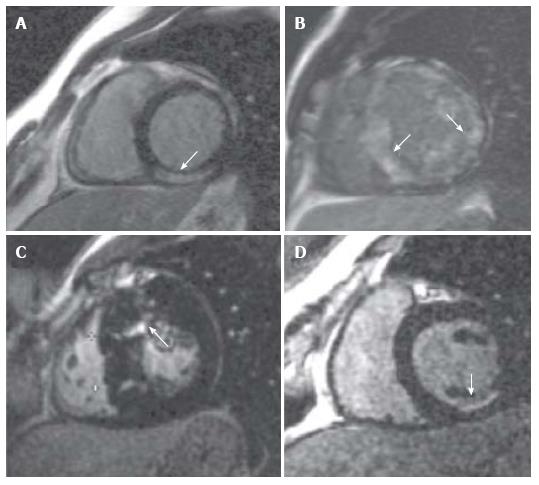
Figure 7 Diagnostic patterns of late gadolinium enhancement distribution pattern and location of late gadolinium enhancement.
These features contribute to the differential diagnosis of hypertensive cardiomyopathy (HCM) and non-ischemic cardiomyopathy. (A) sub-epicardial fibrosis following myocarditis, (B) circumferential diffuse enhancement in amyloidosis, (C) patchy fibrosis in affected hypertrophied segments in HCM and a typical ischemic sub-endocardial enhancement (D). (Reproduced from Parsai et al[80], 2012).
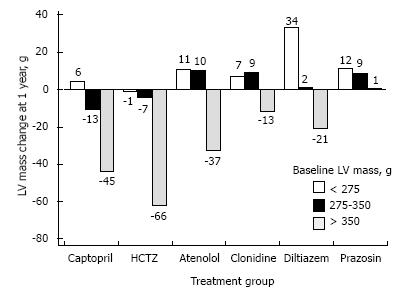
Figure 8 Effect of randomized treatments with single-drug therapy on left ventricular mass.
In this group of 493 hypertensive patients, the 1-year change in left ventricular (LV) mass from baseline is shown for each of three baseline mass tertiles. The highest baseline tertile shows significant reductions with hydrochlorothiazide (HCTZ), captopril, and atenolol (P < 0.05). (Reproduced from Diamond et al[85], 2003; Gottdiener et al[91], 2007).
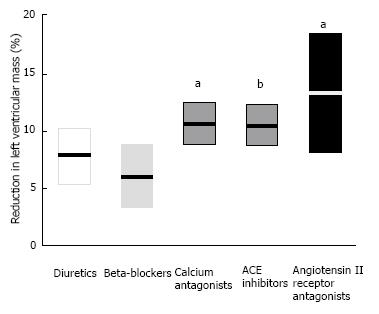
Figure 9 Change in left ventricular mass index (as percentage from baseline) with antihypertensive treatment by drug class.
Data represent the mean values and 95% confidence intervals, adjusted for change in diastolic blood pressure and treatment duration. The aP < 0.05 vs beta-blockers, and bP < 0.01 vs beta-blocker (after Bonferroni correction). ACE: Angiotensin-converting-enzyme. (Reproduced from Klingbeil et al[97], 2003).
- Citation: Kuroda K, Kato TS, Amano A. Hypertensive cardiomyopathy: A clinical approach and literature review. World J Hypertens 2015; 5(2): 41-52
- URL: https://www.wjgnet.com/2220-3168/full/v5/i2/41.htm
- DOI: https://dx.doi.org/10.5494/wjh.v5.i2.41


