Copyright
©The Author(s) 2015.
World J Hypertens. May 23, 2015; 5(2): 28-40
Published online May 23, 2015. doi: 10.5494/wjh.v5.i2.28
Published online May 23, 2015. doi: 10.5494/wjh.v5.i2.28
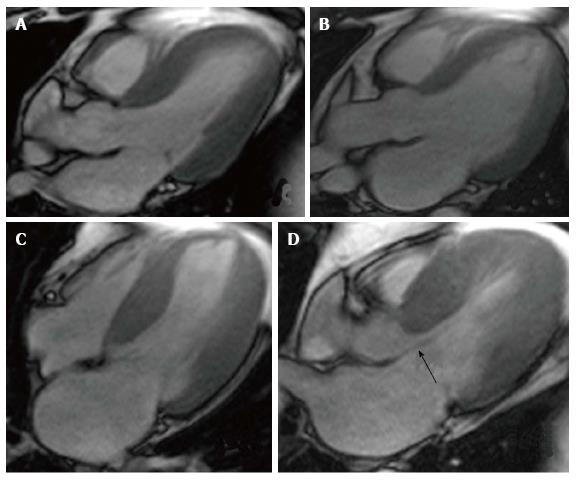
Figure 1 Cardiovascular magnetic resonance showing Steady-state Free Precision Sequences.
A: Patient with hypertension presenting slight ventricular hypertrophy (septal wall of 13 mm); B: Patient with hypertensive cardiomyopathy in dilated phase with a LVDD = 70 mm, LVEF = 40%, left atrium = 65 mm; C: 51-year-old male patient with asymmetrical septal hypertrophy, with a maximum thickness of 27 mm; D: Same patient as in C, the arrow shows the anterior systolic movement of the mitral valve, generating outflow tract obstruction.
Figure 2 Evaluation of ischemia using cardiovascular magnetic resonance.
A: Rest perfusion image using cardiovascular magnetic resonance that doesn’t show any defects; B: Same patient post adenosine-induced stress test, the arrow shows a perfusion defect in the inferolateral wall (territory of the circumflex artery); C: Inversion recovery sequence that doesn’t show the presence of late enhancement, which demonstrates the absence of infarction in the ischemic area; D: Invasive coronariography of the same patient, which shows a significant plaque in the circumflex artery.
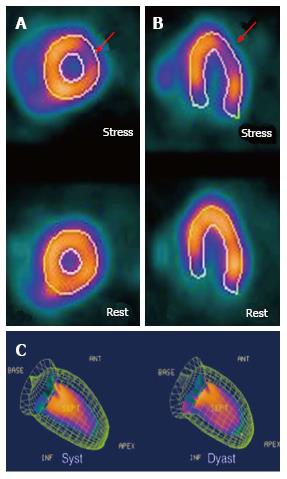
Figure 3 Evaluation of ischemia using single-photon emission computed tomography.
A: Short axis view of the left ventricle with a perfusion defect visible after pharmacologic stress test in the anterior lateral wall (territory of the circumflex artery); B: Confirmation of the perfusion defect in the long axis view; C: Gated-single-photon emission computed tomography used to evaluate left ventricular function.
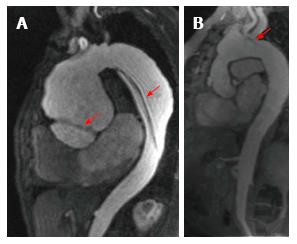
Figure 4 Evaluation of vascular anatomy using cardiovascular magnetic resonance.
A: Patient with Marfan’s syndrome that presents a Stanford A type dissected aortic aneurysm; the arrows point to the two sites of dissection; B shows post-surgical changes after a Bentall and Bono procedure; the arrow points to a dissection flap in the aortic arch.
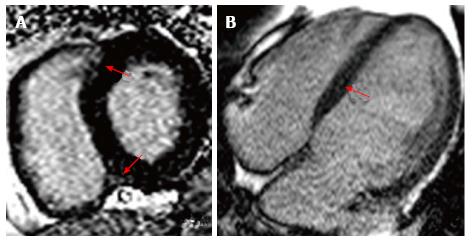
Figure 5 Cardiovascular magnetic resonance using inversion-recovery sequences.
A: Patient with chronic hypertension that presents late enhancement in the areas connecting with the right ventricle (shown by red arrows); B: Patient with hypertensive cardiomyopathy in dilated phase, showing linear late enhancement in the septal wall.
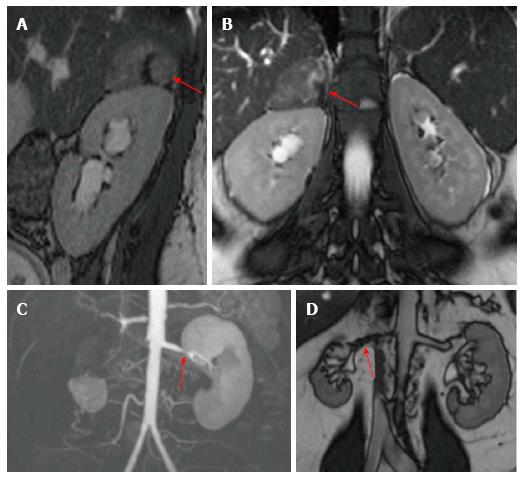
Figure 6 Evaluation of secondary hypertension.
Cardiovascular magnetic resonance T2- sequences. Above is show a study taken in a 27-year-old female patient that presented with hypertension and a 5 cm × 4 cm adrenal mass, hyperintense when compared to the liver (marked by red arrows). On the bottom panels we see the contrast angiography study and T2 sequence, which show significant bilateral renal artery stenosis.
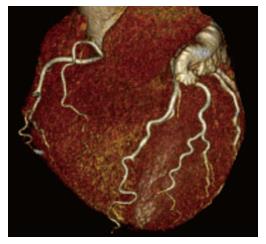
Figure 7 Coronary computed tomography of an 81-year-old hypertensive patient that demonstrates the presence of coronary tortuosity without atherosclerotic plaques.
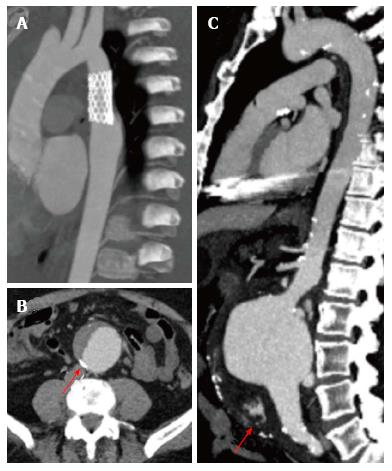
Figure 8 Aortic computed tomography.
A: Patient with vascular endoprothesis, without vascular leaks; B: Dissected abdominal aortic aneurysm, arrow points to calcified atherosclerotic plaques; C: Ruptured infrarenal aortic aneurysm, seen as hyperdense material in the abdominal cavity (arrow).
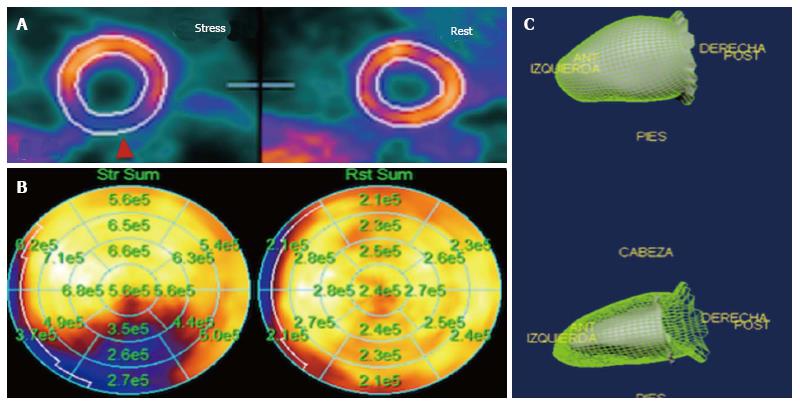
Figure 9 Myocardial perfusion positron emission tomography.
A shows a perfusion defect in the posterior wall during stress; B shows flow quantification; the regional flows during stress are significantly increased in all areas, except in the inferior wall (territory of the right coronary artery), where the increase is significantly diminished; C shows a Gated-positron emission tomography to evaluate left ventricular function.
- Citation: Alexanderson-Rosas E, Berríos-Bárcenas E, Meave A, de la Fuente-Mancera JC, Oropeza-Aguilar M, Barrero-Mier A, Monroy-González AG, Cruz-Mendoza R, Guinto-Nishimura GY. Novel contributions of multimodality imaging in hypertension: A narrative review. World J Hypertens 2015; 5(2): 28-40
- URL: https://www.wjgnet.com/2220-3168/full/v5/i2/28.htm
- DOI: https://dx.doi.org/10.5494/wjh.v5.i2.28


