Copyright
©2014 Baishideng Publishing Group Co.
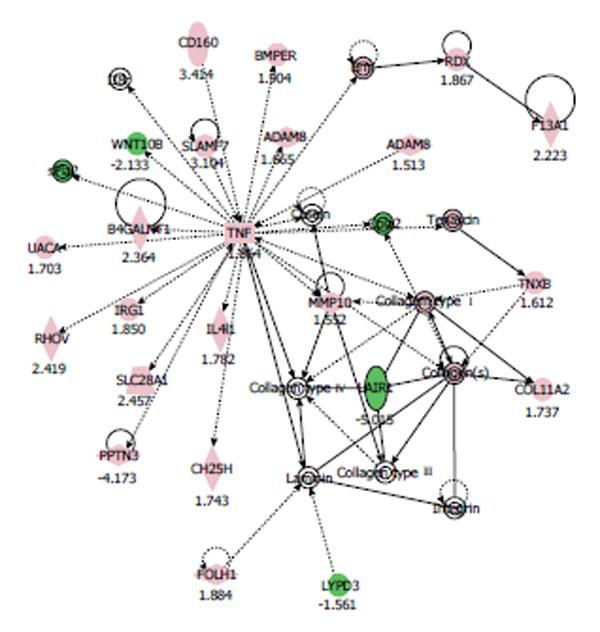
Figure 1 Gene network in human coronary artery endothelial cell cultured with 100 μmol/L nicotine for 24 h was generated by ingenuity pathway analysis software.
We focused on one network whose function was implicated in “tissue development, cardiovascular system development and function, cell-to-cell signaling and interaction”. Genes are represented as nodes and the biological relationship between two nodes is represented as a line. Solid lines are for direct and broken ones for indirect associations. Lines beginning and ending at a single node show self-regulation, whereas a line without an arrowhead represents binding. Arrowheads represent directionality of the relationship. The node color intensity indicates the degree of increase (red) or decrease (green). ADAM: A disintegrin and metalloprotease domain; MMP: Matrix metalloproteinase.
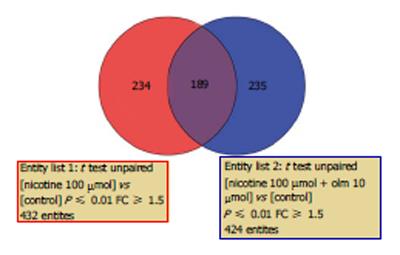
Figure 2 Venn diagrams demonstrating the results of comparing two datasets (100 μmol/L nicotine and 100 μmol/L nicotine plus 10 μmol/L olmesartan, compared to untreated cells, respectively).
There were 189 genes in common in the two data sets. Red circle: Nicotine; Blue circle: Nicotine plus olmesartan. These data represent the unique genes that were modified by their respective treatments. Oml: Olmesartan.
Figure 3 Global canonical pathway analyses demonstrating the comparison of two data sets (100 μmol/L nicotine and 100 μmol/L nicotine plus 10 μmol/L olmesartan, compared to untreated cells, respectively).
Data sets were analyzed by the Ingenuity Pathways Analysis Software. The significance is expressed as a P value, which was calculated using the right-tailed Fisher’s exact test. Figure shows ten major canonical signaling pathways. Threshold: P < 0.05.
Figure 4 Graphical representations of atherosclerosis signaling pathways and comparison of the gene-perturbation induced by the treatments.
A: 100 μmol/L nicotine treatment; B: 100 μmol/L nicotine plus 10 μmol/L olmesartan treatment, compared to untreated cells, respectively. Red notes and green notes indicate up- and down- (green) regulation. MMP: Matrix metalloproteasea; TF: Tissue factor; SMC: Smooth muscle cell; TNF: Tumor necrosis factor; IFN: Interferone.
- Citation: Kudo M, Matsuda K, Sugawara K, Iki Y, Kogure N, Saito-Ito T, Shimizu K, Sato I, Yoshikawa T, Uruno A, Ito R, Yokoyama A, Saito-Hakoda A, Ito S, Sugawara A. ARB affects nicotine-induced gene expression profile in human coronary artery endothelial cells. World J Hypertens 2014; 4(1): 7-14
- URL: https://www.wjgnet.com/2220-3168/full/v4/i1/7.htm
- DOI: https://dx.doi.org/10.5494/wjh.v4.i1.7


