Copyright
©The Author(s) 2025.
World J Exp Med. Jun 20, 2025; 15(2): 102897
Published online Jun 20, 2025. doi: 10.5493/wjem.v15.i2.102897
Published online Jun 20, 2025. doi: 10.5493/wjem.v15.i2.102897
Figure 1
Chemical structures of curcumin, GO-Y022 and GO-030.
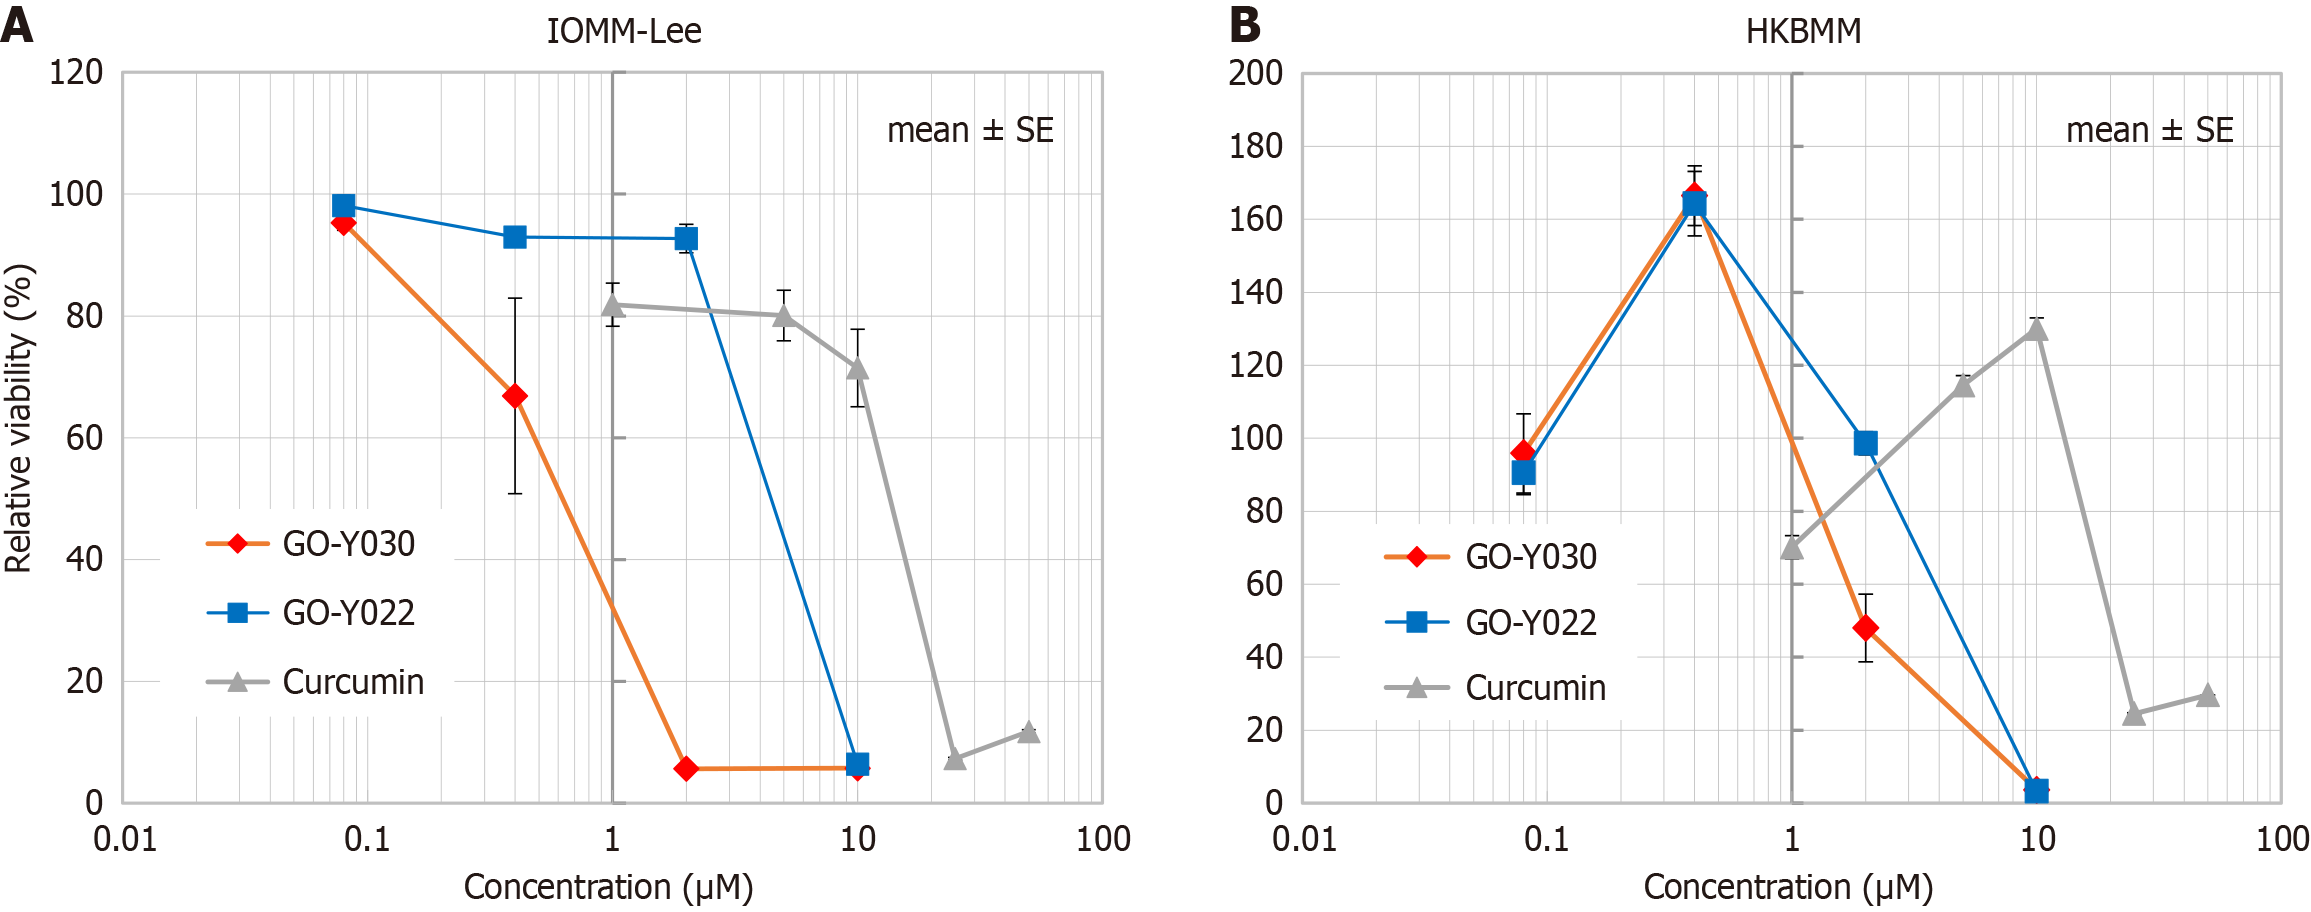
Figure 2 Inhibition of meningioma growth by GO-Y030 in vitro.
A: The growth inhibition of IOMM-Lee; B: The growth inhibition of HKBMM.
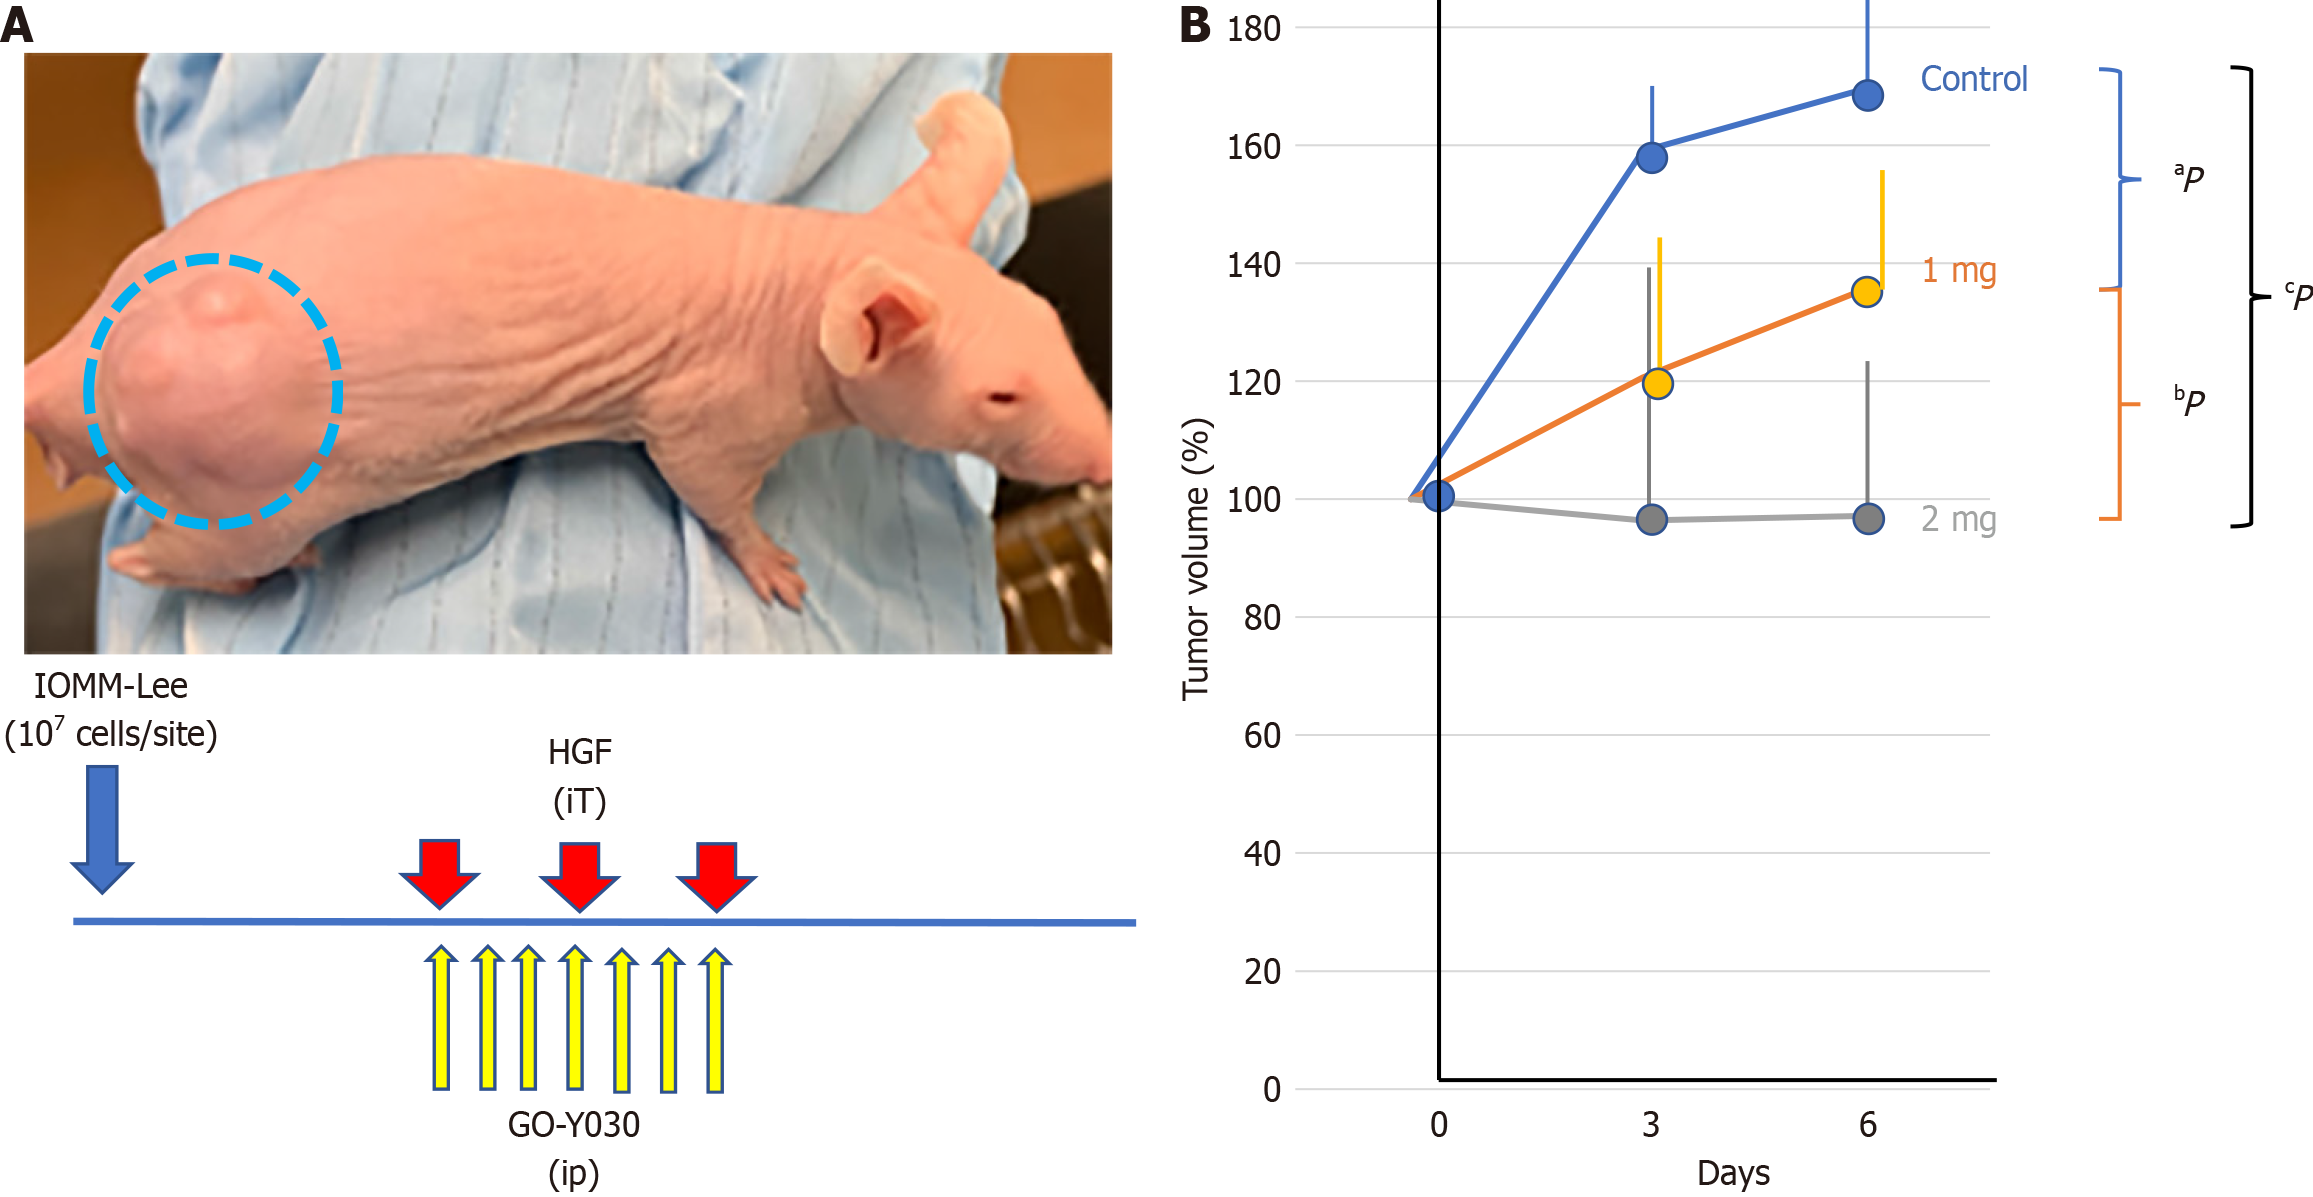
Figure 3 GO-Y030’s inhibitory effect on meningioma growth in vivo.
A: The treatment schedule for the mouse model included intratumor (iT) hepatocellular growth factor administration every 3 days and daily intraperitoneal (ip) administration of GO-Y030; B: Relative tumor volume, with day 1, is set as 100%. GO-Y030 was administered at either 1 mg/kg mouse weight or 2 mg/kg indicated in orange or grey, respectively. The control was indicated in blue. Notably, GO-Y030 significantly suppressed tumor growth. aP and bP indicate the P values between the control and 1 mg/kg, and between the control and 2 mg/kg, 0.041 and 0.002, respectively. There was no significance between the 1 mg/kg and 2 mg/kg. cP = 0.059. The open circle represents the averages of 5 tumors, and the vertical bar depicts the standard deviation. HGF: Hepatocellular growth factor.
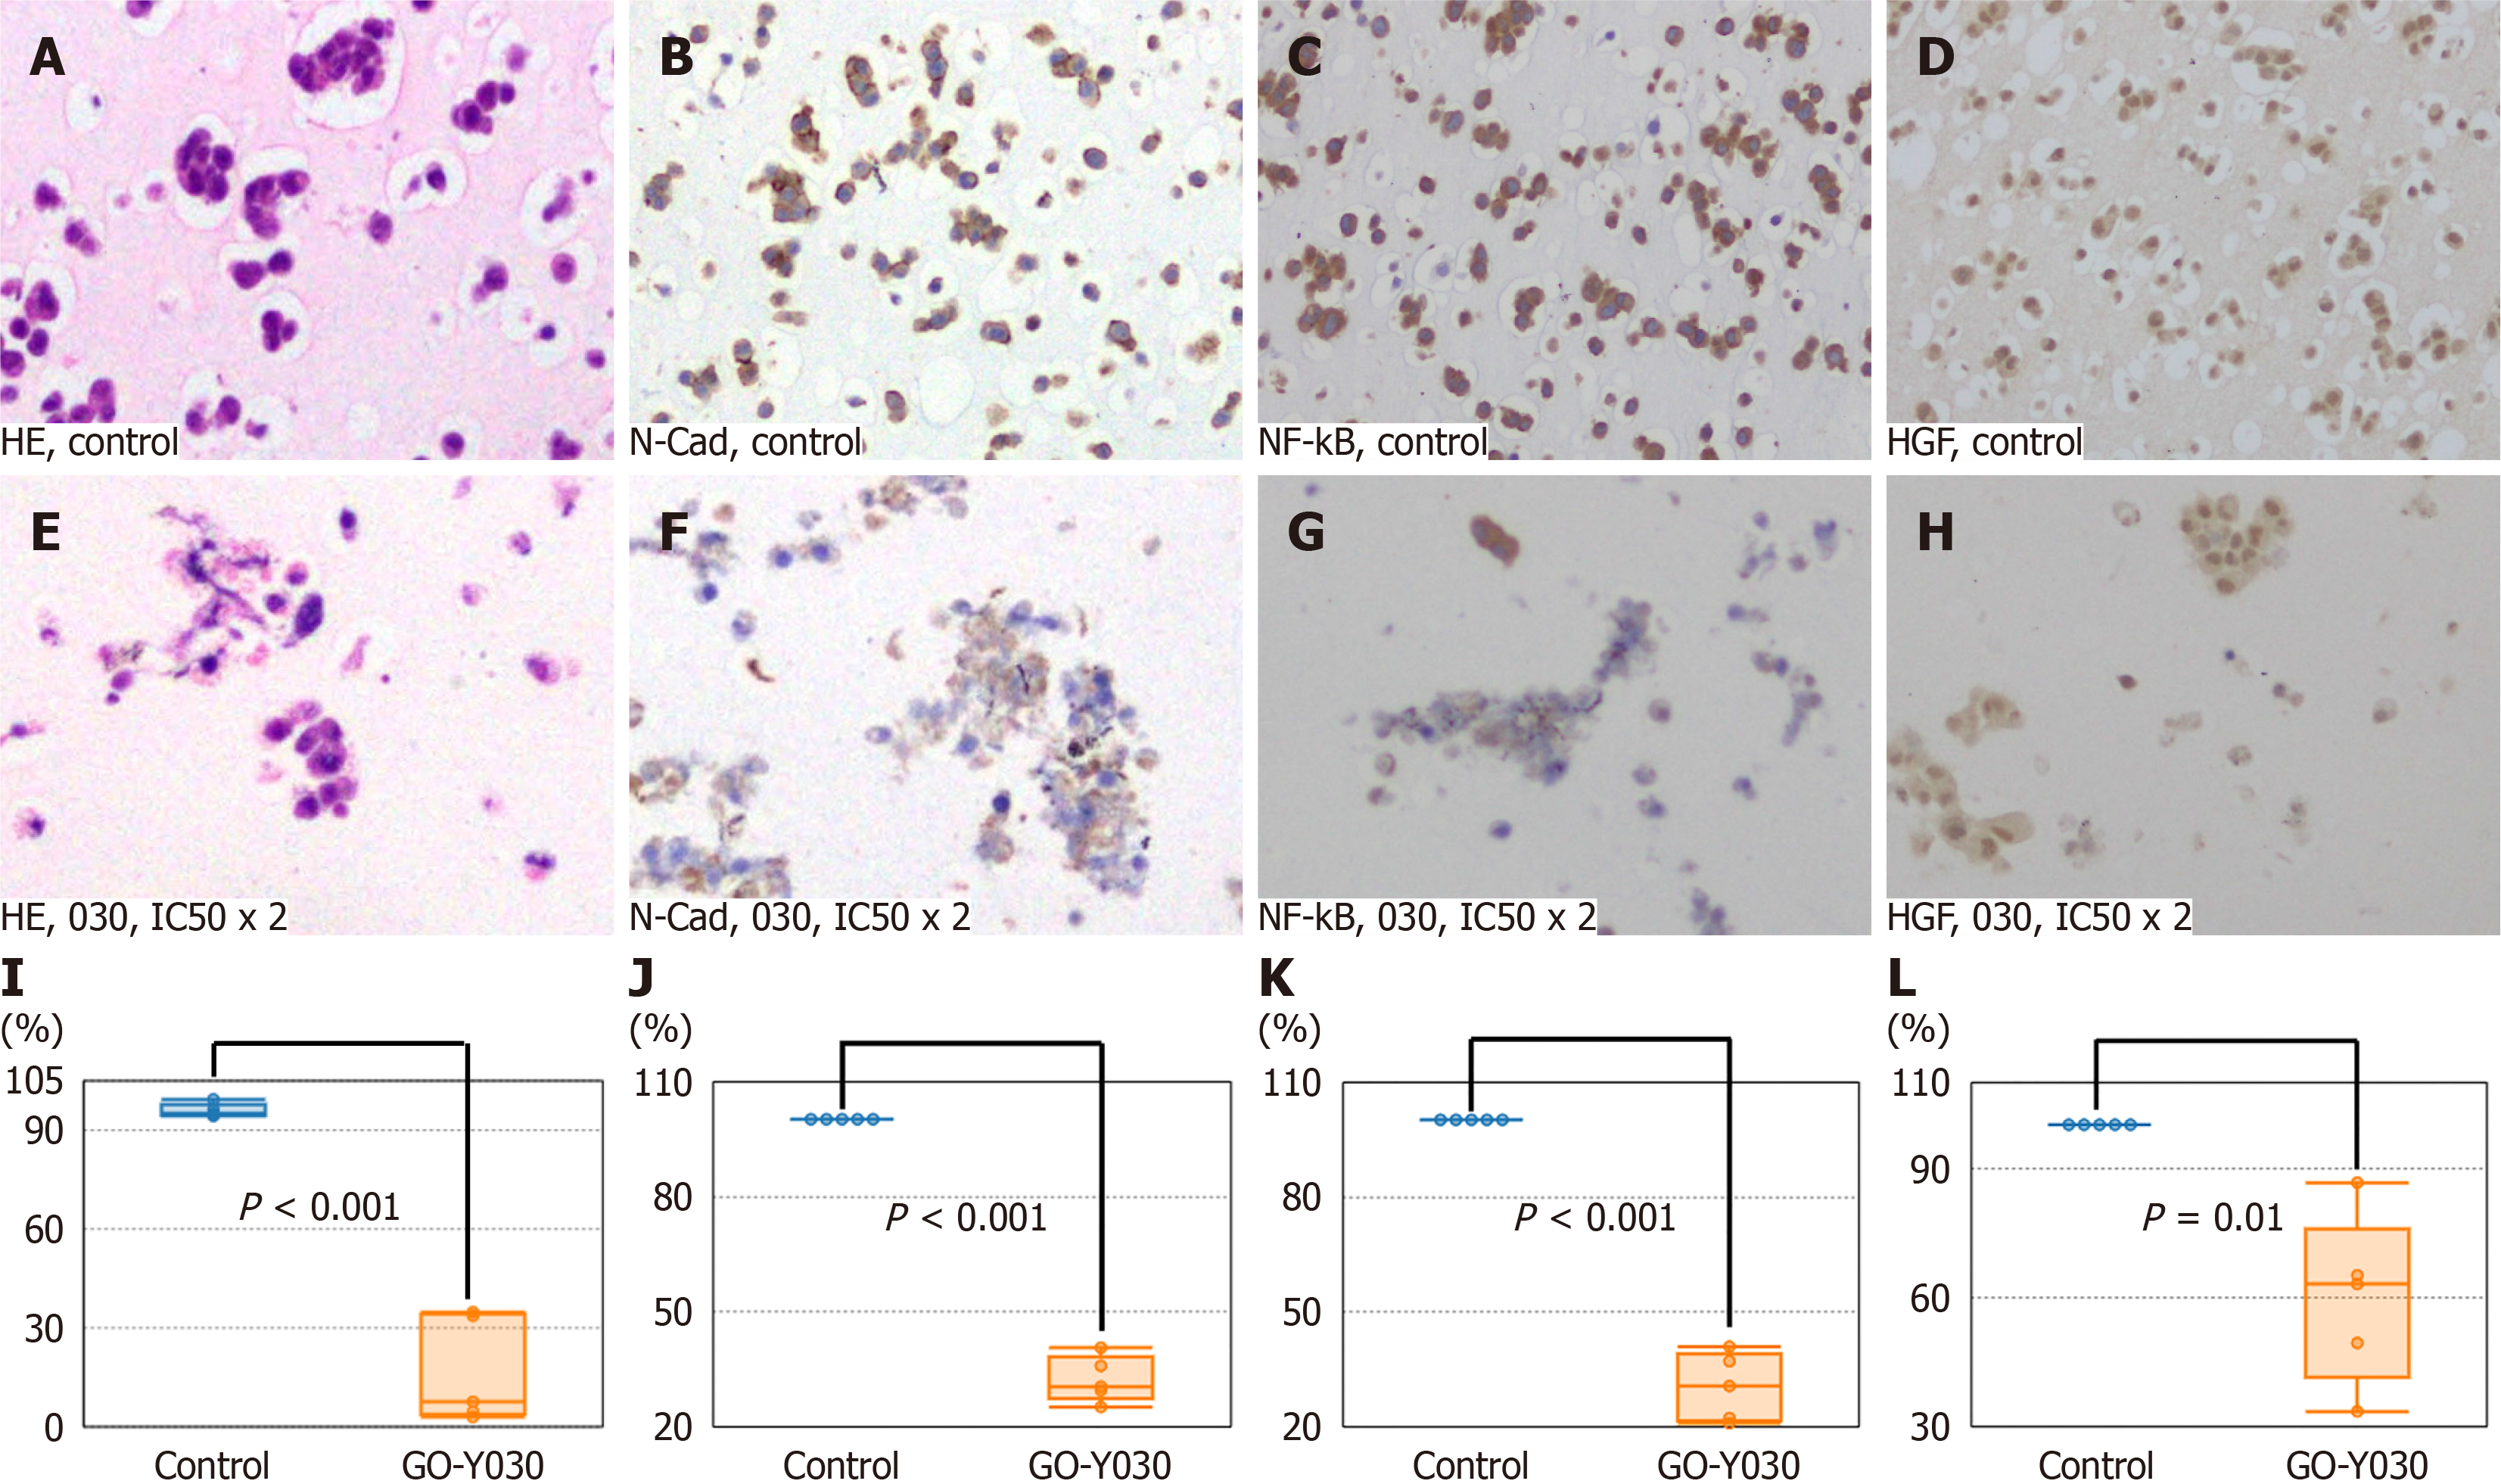
Figure 4 Inhibition of molecular targets in meningioma cell lines (IOMM-Lee) with GO-Y030 in vitro.
A: Hematoxylin and eosin (HE) stains of IOMM-Lee treated with DMSO alone (control); B: Immunohistochemistry (IHC) of the N-Cadherin (N-Cad) in the control; C: IHC of the hepatocellular growth factor (HGF) in the control; D: IHC of nuclear factor kappa-B p65 (NF-kB) in the control; E: HE stains of IOMM-Lee treated with GO-Y030 at twice concentration of the 50% inhibitory concentration (IC50 × 2); F: IHC of the N-Cad in IOMM-Lee treated with GO-Y030 at IC50 x 2; G: IHC of NF-kB in IOMM-Lee treated with GO-Y030 at IC50 × 2; H: IHC of the HGF in IOMM-Lee treated with GO-Y030 at IC50 × 2; I: The percentage of normal appearance cells in IOMM-Lee treated with GO-Y030 at IC50 × 2. J: The percentage of positive cells for N-Cad in IOMM-Lee treated with GO-Y030 at IC50 × 2; K: The percentage of positive cells for NF-kB in IOMM-Lee treated with GO-Y030 at IC50 × 2; L: The percentage of positive cells for HGF in IOMM-Lee treated with GO-Y030 at IC50 × 2.
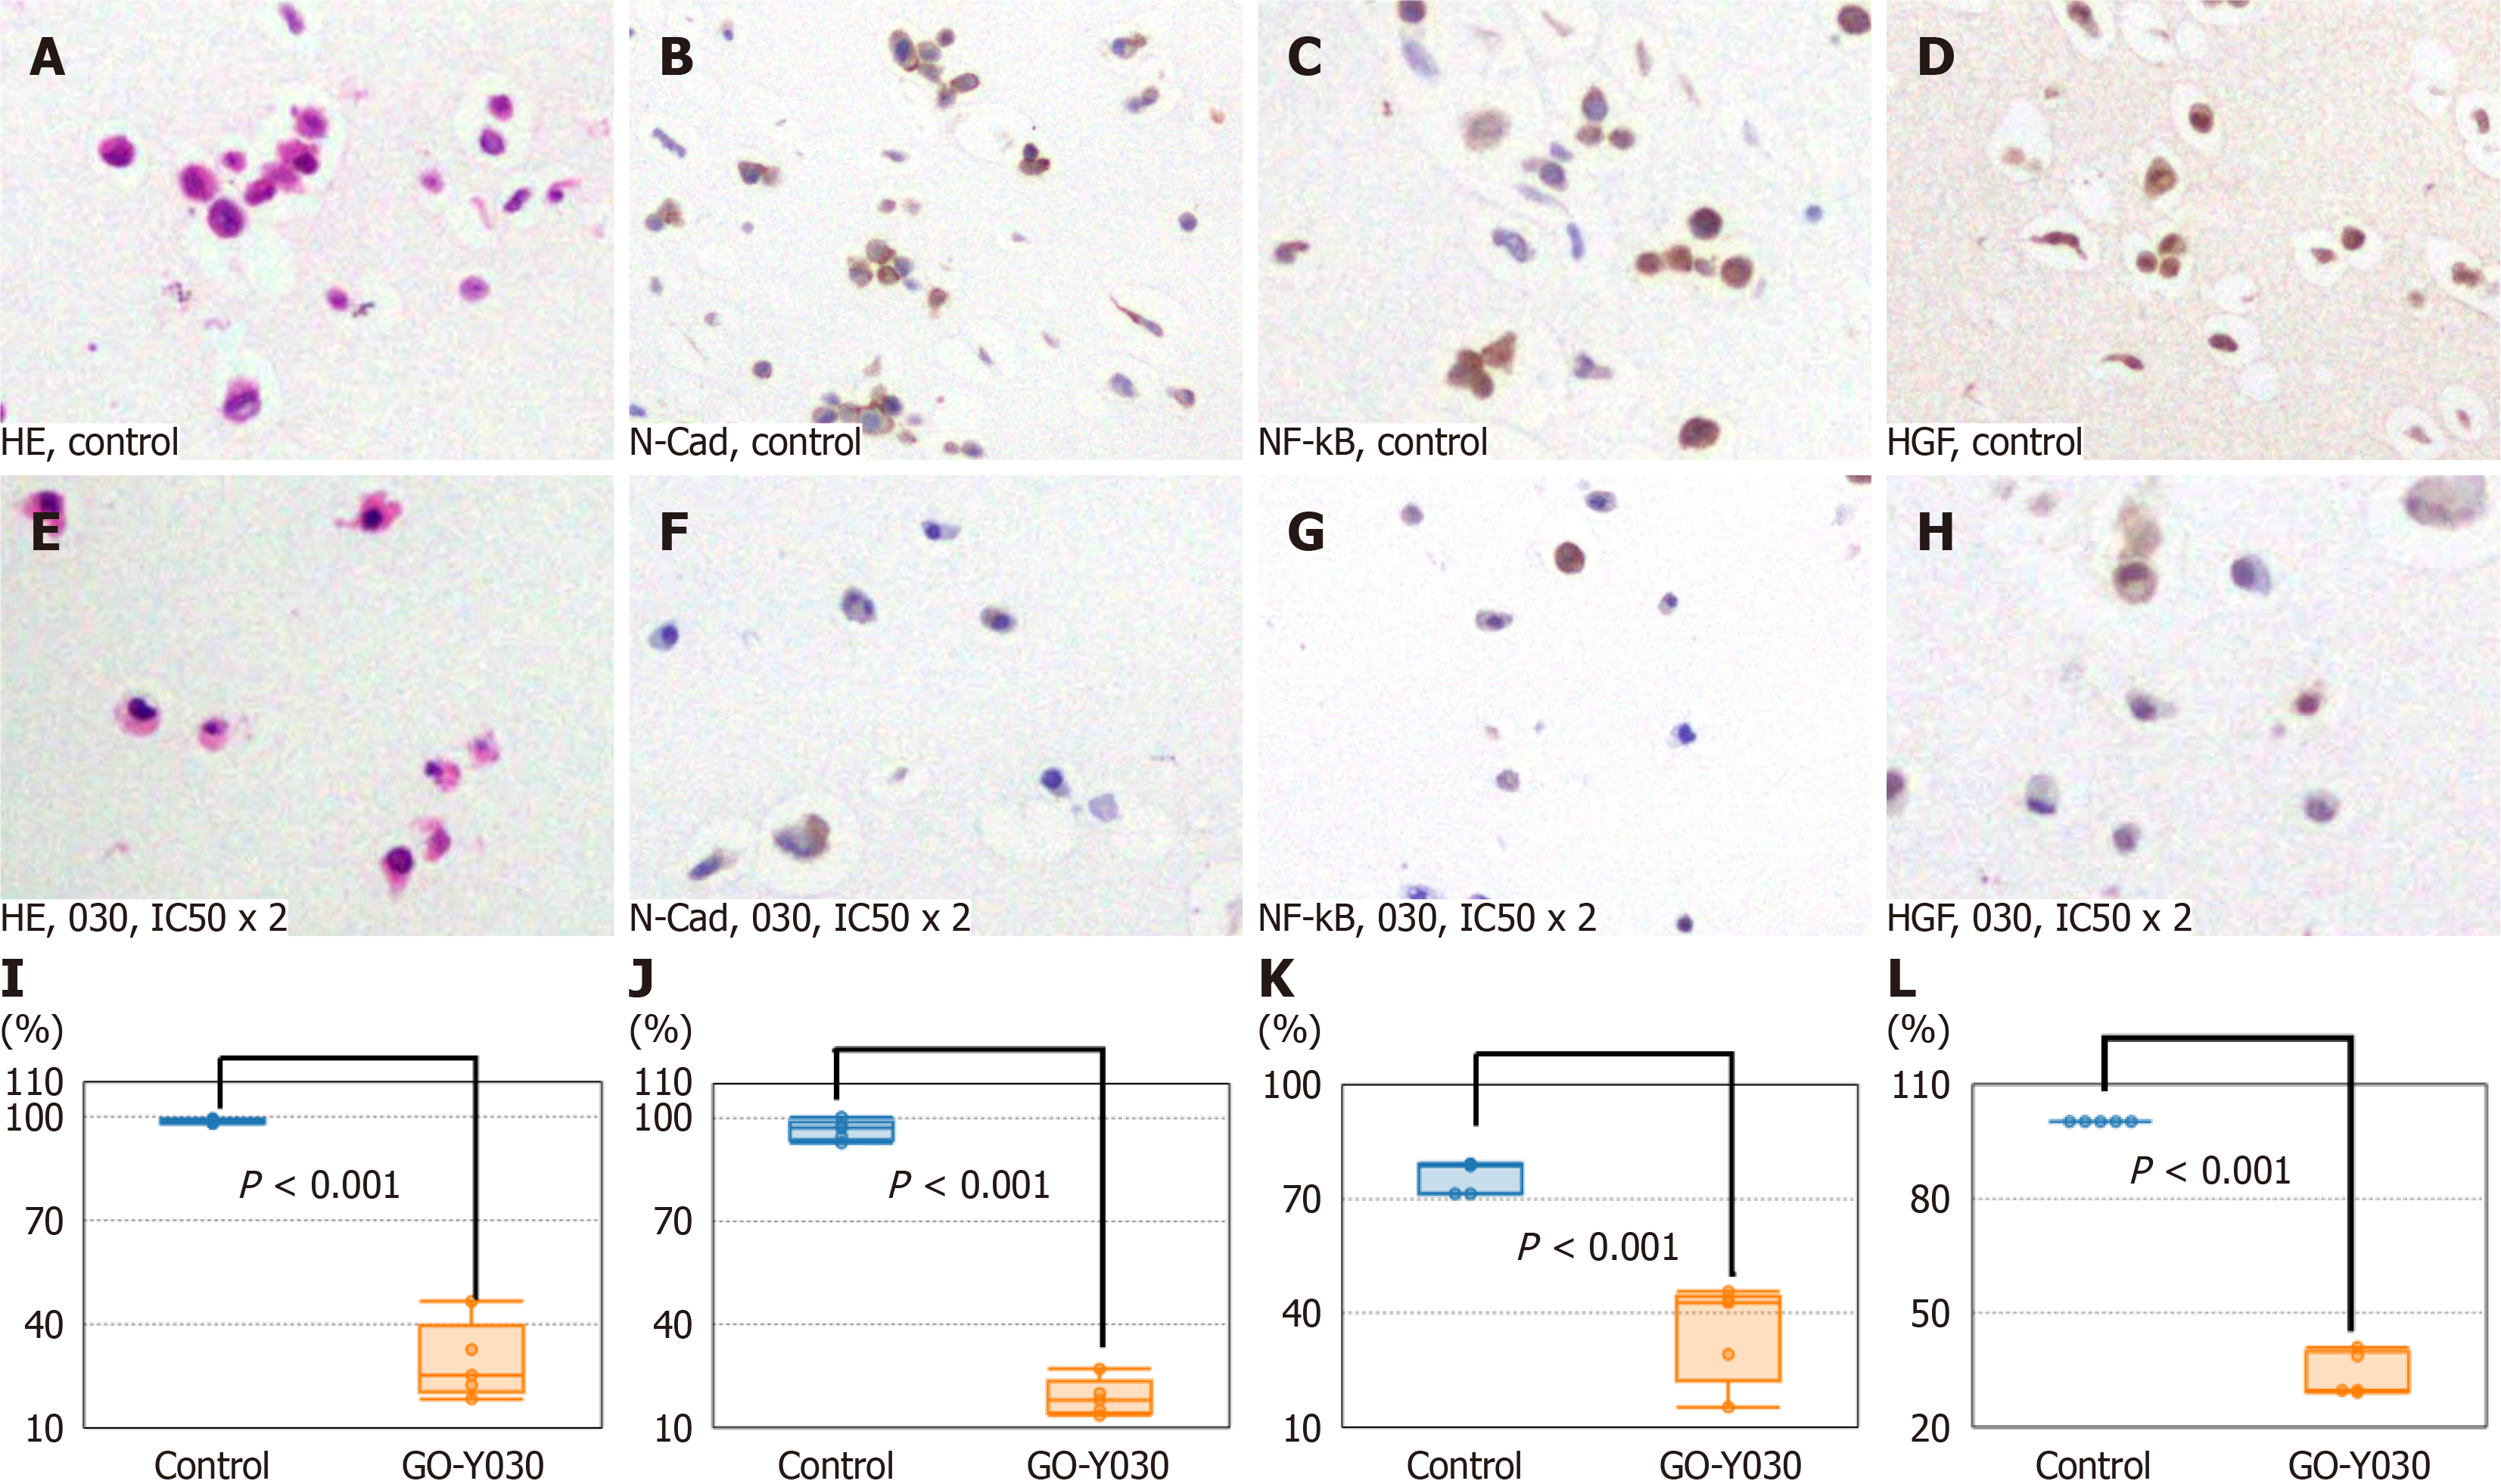
Figure 5 Inhibition of molecular targets in meningioma cell lines (HKB-MM) with GO-Y030 in vitro.
A: Hematoxylin and eosin (HE) stains of HKBMM treated with DMSO alone (control); B: Immunohistochemistry (IHC) of the N-Cad in the control of HKBMM; C: IHC of the hepatocellular growth factor (HGF) in the control of HKBMM; D: IHC of NF-kB in the control of HKBMM; E: HE stains of HKBMM treated with GO-Y030 at IC50 × 2; F: IHC of the N-Cad in HKBMM treated with GO-Y030 at IC50 × 2; G: IHC of NF-kB in HKBMM treated with GO-Y030 at IC50 × 2; H: IHC of the HGF in HKBMM treated with GO-Y030 at IC50 × 2; I: The percentage of normal appearance cells in HKBMM treated with GO-Y030 at IC50 × 2; J: The percentage of positive cells for N-Cad in HKBMM treated with GO-Y030 at IC50 × 2; K: The percentage of positive cells for NF-Kb in HKBMM treated with GO-Y030 at IC50 × 2; L: The percentage of positive cells for HGF in HKBMM treated with GO-Y030 at IC50 × 2.
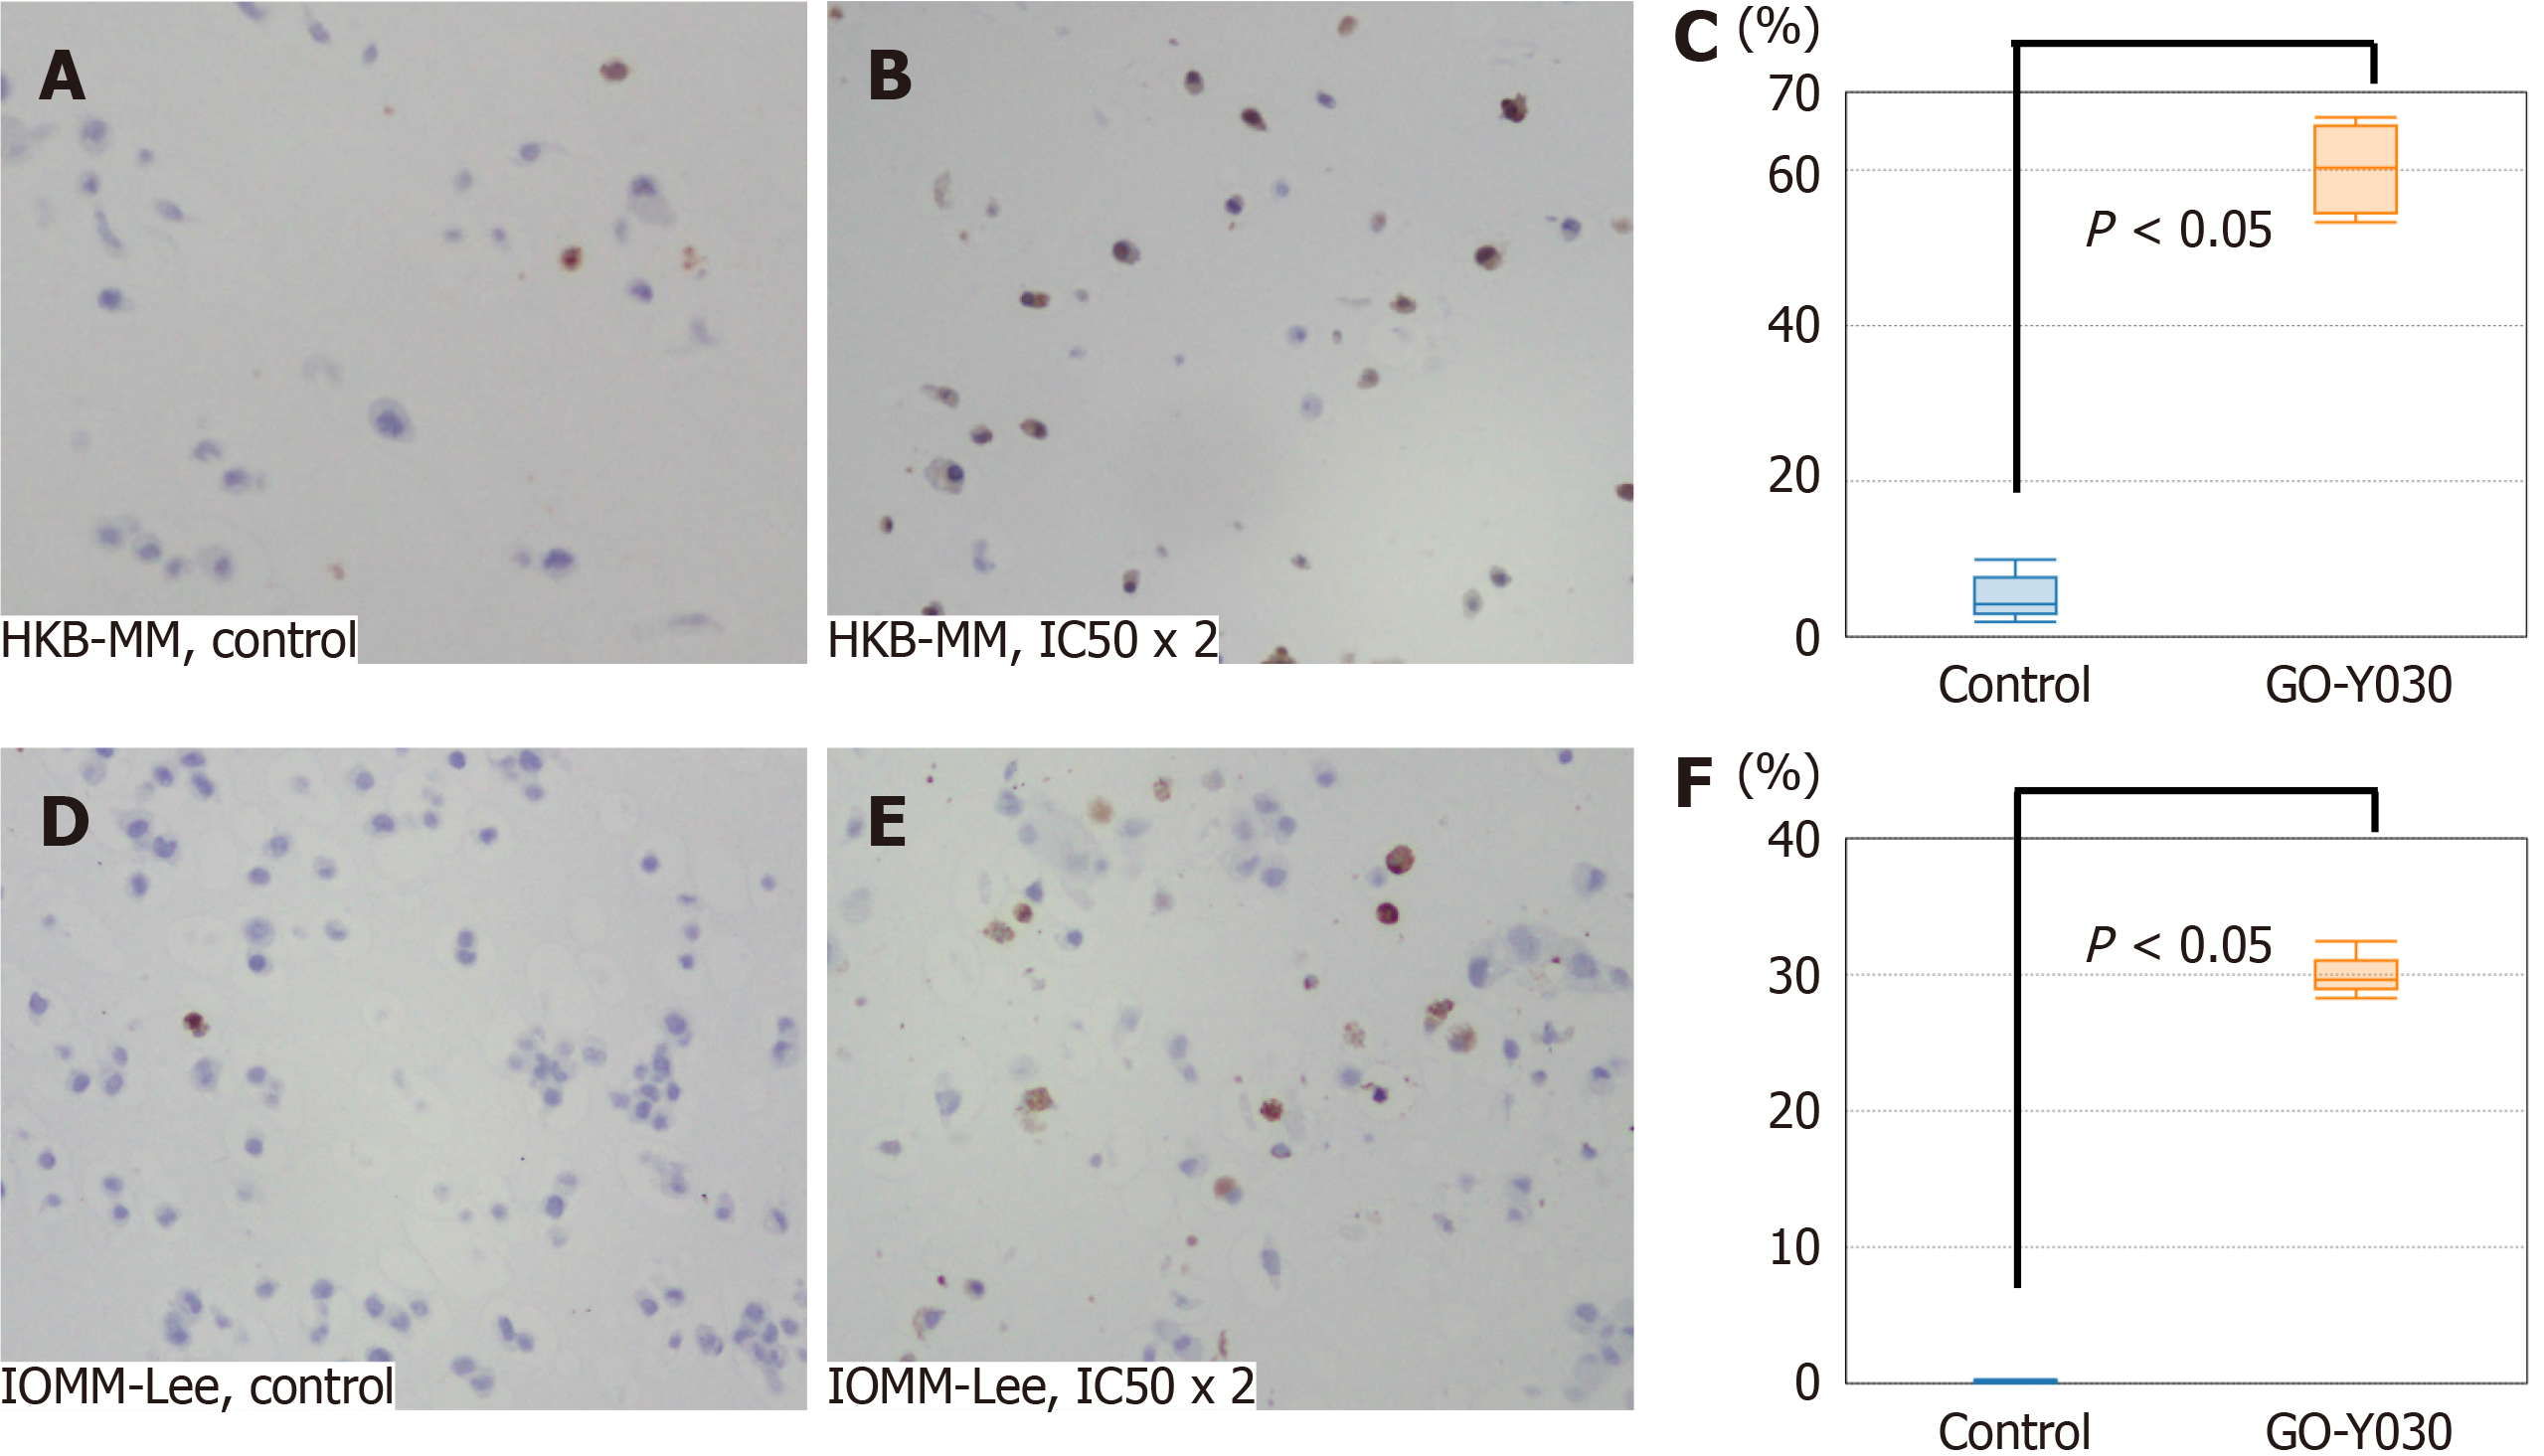
Figure 6 Apoptosis induction in meningioma cell lines with GO-Y030 in vitro.
A: Cleaved Caspase 3 in the control of IOMM-Lee; B: Cleaved Caspase 3 induction of IOMM-Lee treated with GO-Y030 at twice concentration of the 50% inhibitory concentration (IC50 × 2); C: The percentage of Cleaved Caspase 3 positive cells in IOMM-Lee treated with GO-Y030 at IC50 × 2; D: Cleaved Caspase 3 in the control of HKBMM; E: Cleaved Caspase 3 induction of HKBMM treated with GO-Y030 at IC50 × 2; F: The percentage of Cleaved Caspase 3 positive cells in HKBMM treated with GO-Y030 at IC50 × 2.
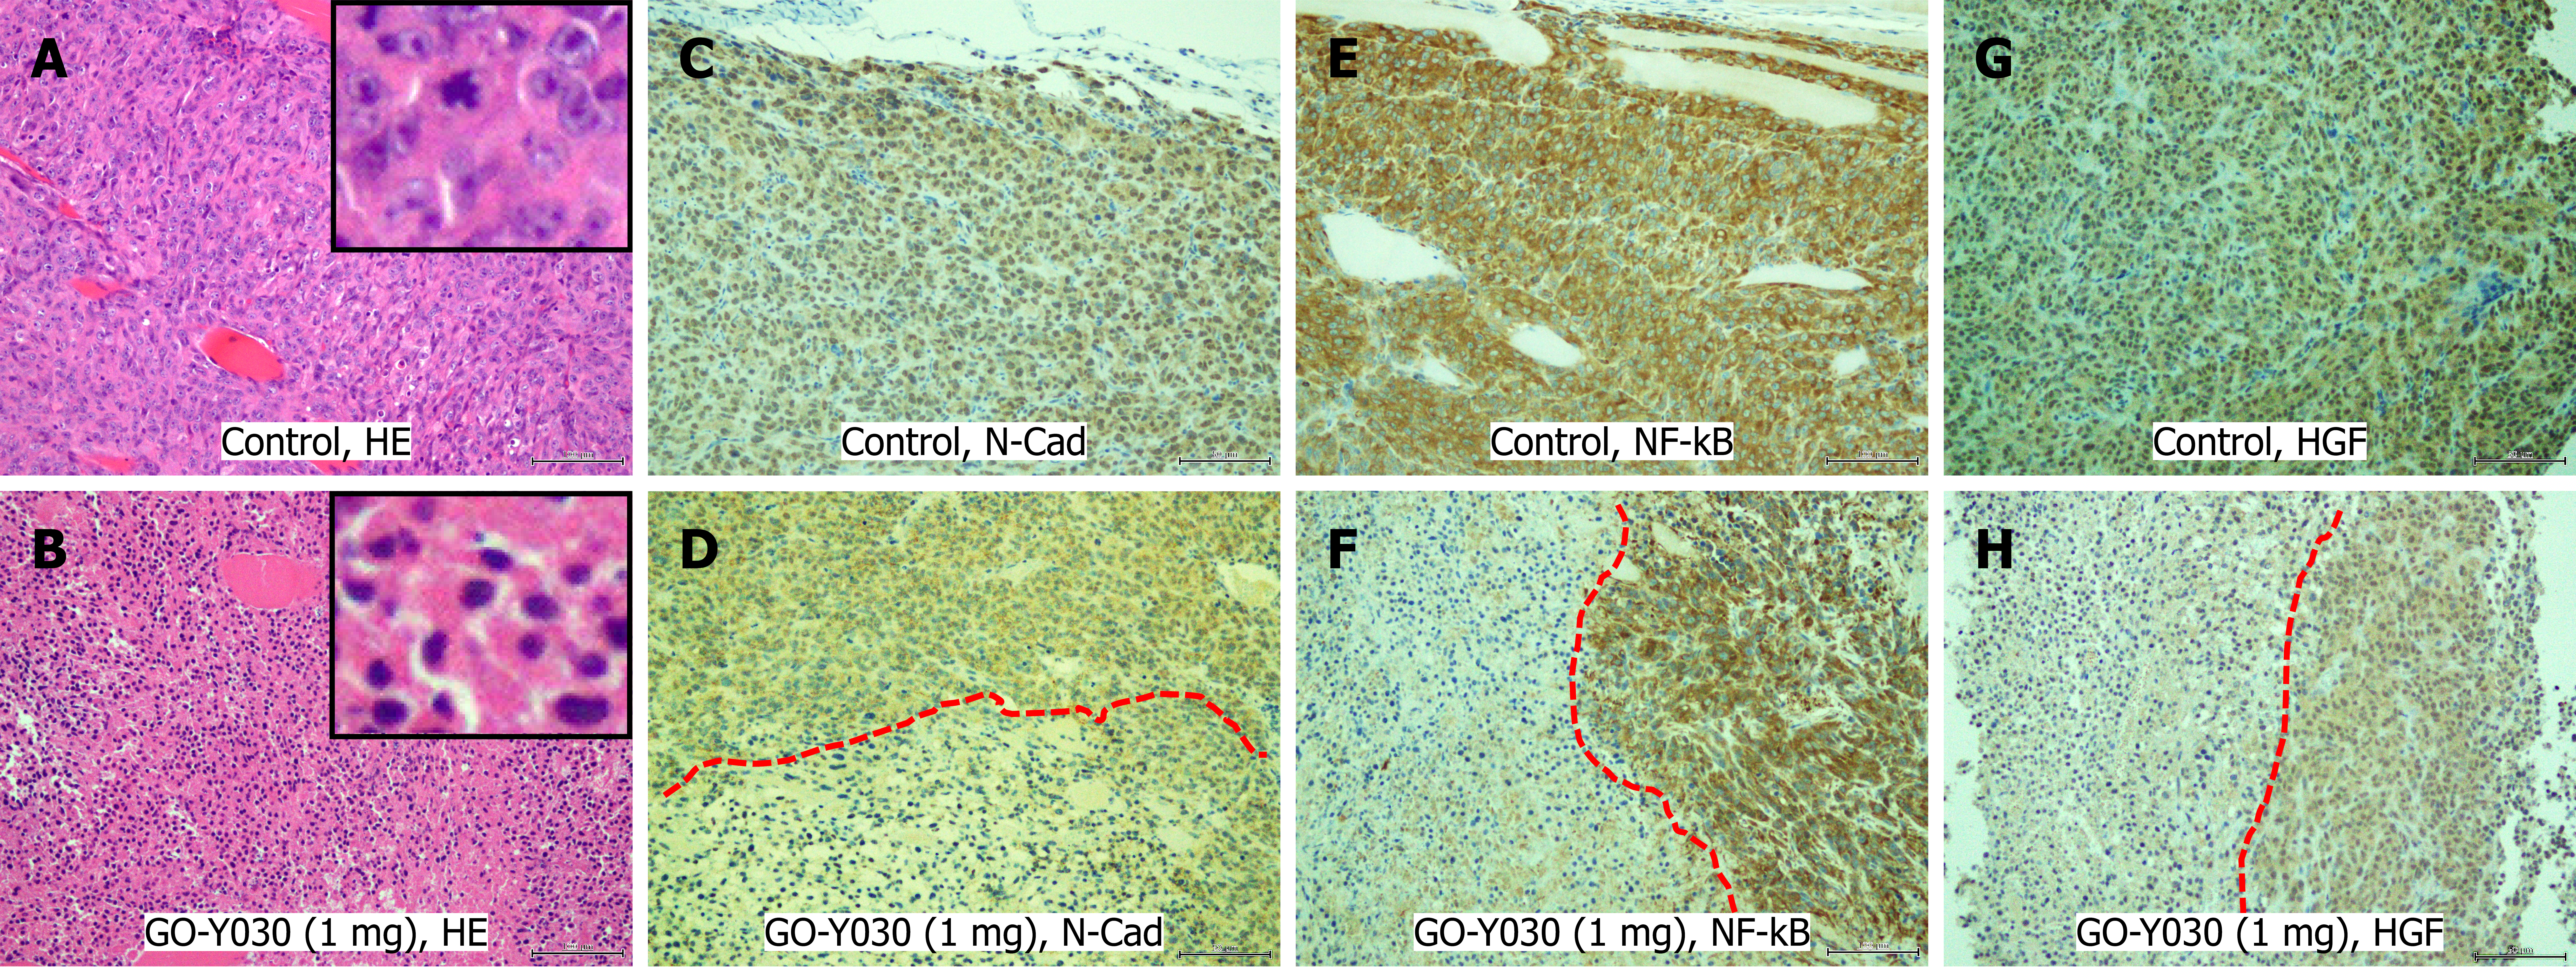
Figure 7 Inhibition of molecular targets by GO-Y030 in vivo.
A: HE stains of the control group treated with DMSO alone. The inset indicates a closer magnified view; B: HE stains of IOMM-Lee treated with GO-Y030. The inset indicates a more detailed view. Pyknotic cell nuclei are observed; C: Immunohistochemistry (IHC) of N-Cadherin (N-Cad) in the control group; D: IHC of N-Cad in IOMM-Lee treated with GO-Y030; E: IHC of nuclear factor kappa-B p65 (NF-kB) in the control; F: IHC of the NF-kB of IOMM-Lee treated with GO-Y030; G: IHC of the hepatocellular growth factor (HGF) in the control group; H: IHC of HGF in IOMM-Lee treated with GO-Y030. The red dashed line distinguishes between the cells with intact tumor nuclei that test positive for each molecule, and the cells with pyknotic nuclei that test negative affected with GO-Y030 peripherally from vessels.
- Citation: Terasawa A, Shimazu K, Nanjo H, Miura M, Shibata H. Diarylpentanoid, a curcumin analog, inhibits malignant meningioma growth in both in vitro and in vivo models. World J Exp Med 2025; 15(2): 102897
- URL: https://www.wjgnet.com/2220-315x/full/v15/i2/102897.htm
- DOI: https://dx.doi.org/10.5493/wjem.v15.i2.102897


