Copyright
©The Author(s) 2025.
World J Exp Med. Jun 20, 2025; 15(2): 100548
Published online Jun 20, 2025. doi: 10.5493/wjem.v15.i2.100548
Published online Jun 20, 2025. doi: 10.5493/wjem.v15.i2.100548
Figure 1 Schematic representation of the disease-onset stages for the child exhibiting DMD, epilepsy, and ASD.
ASD: Autism spectrum disorder; DMD: Duchenne muscular dystrophy.
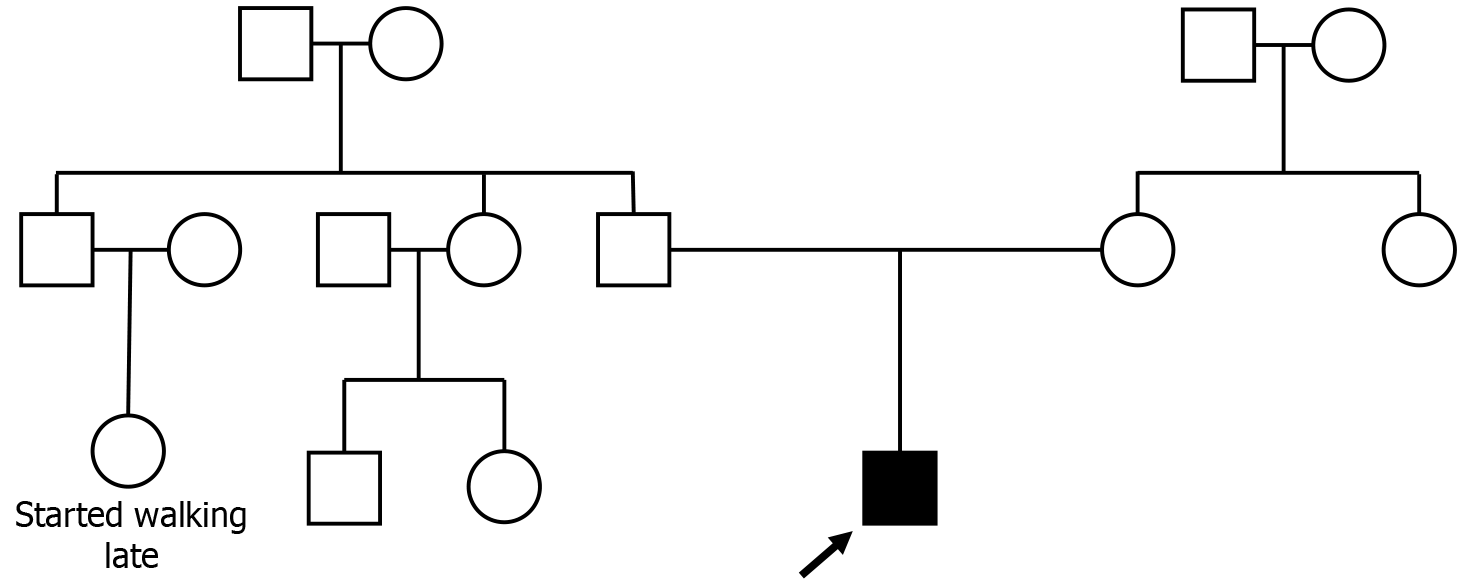
Figure 2
Pedigree chart for three generations of the proband with Duchenne muscular dystrophy, autism spectrum disorder, and epilepsy.
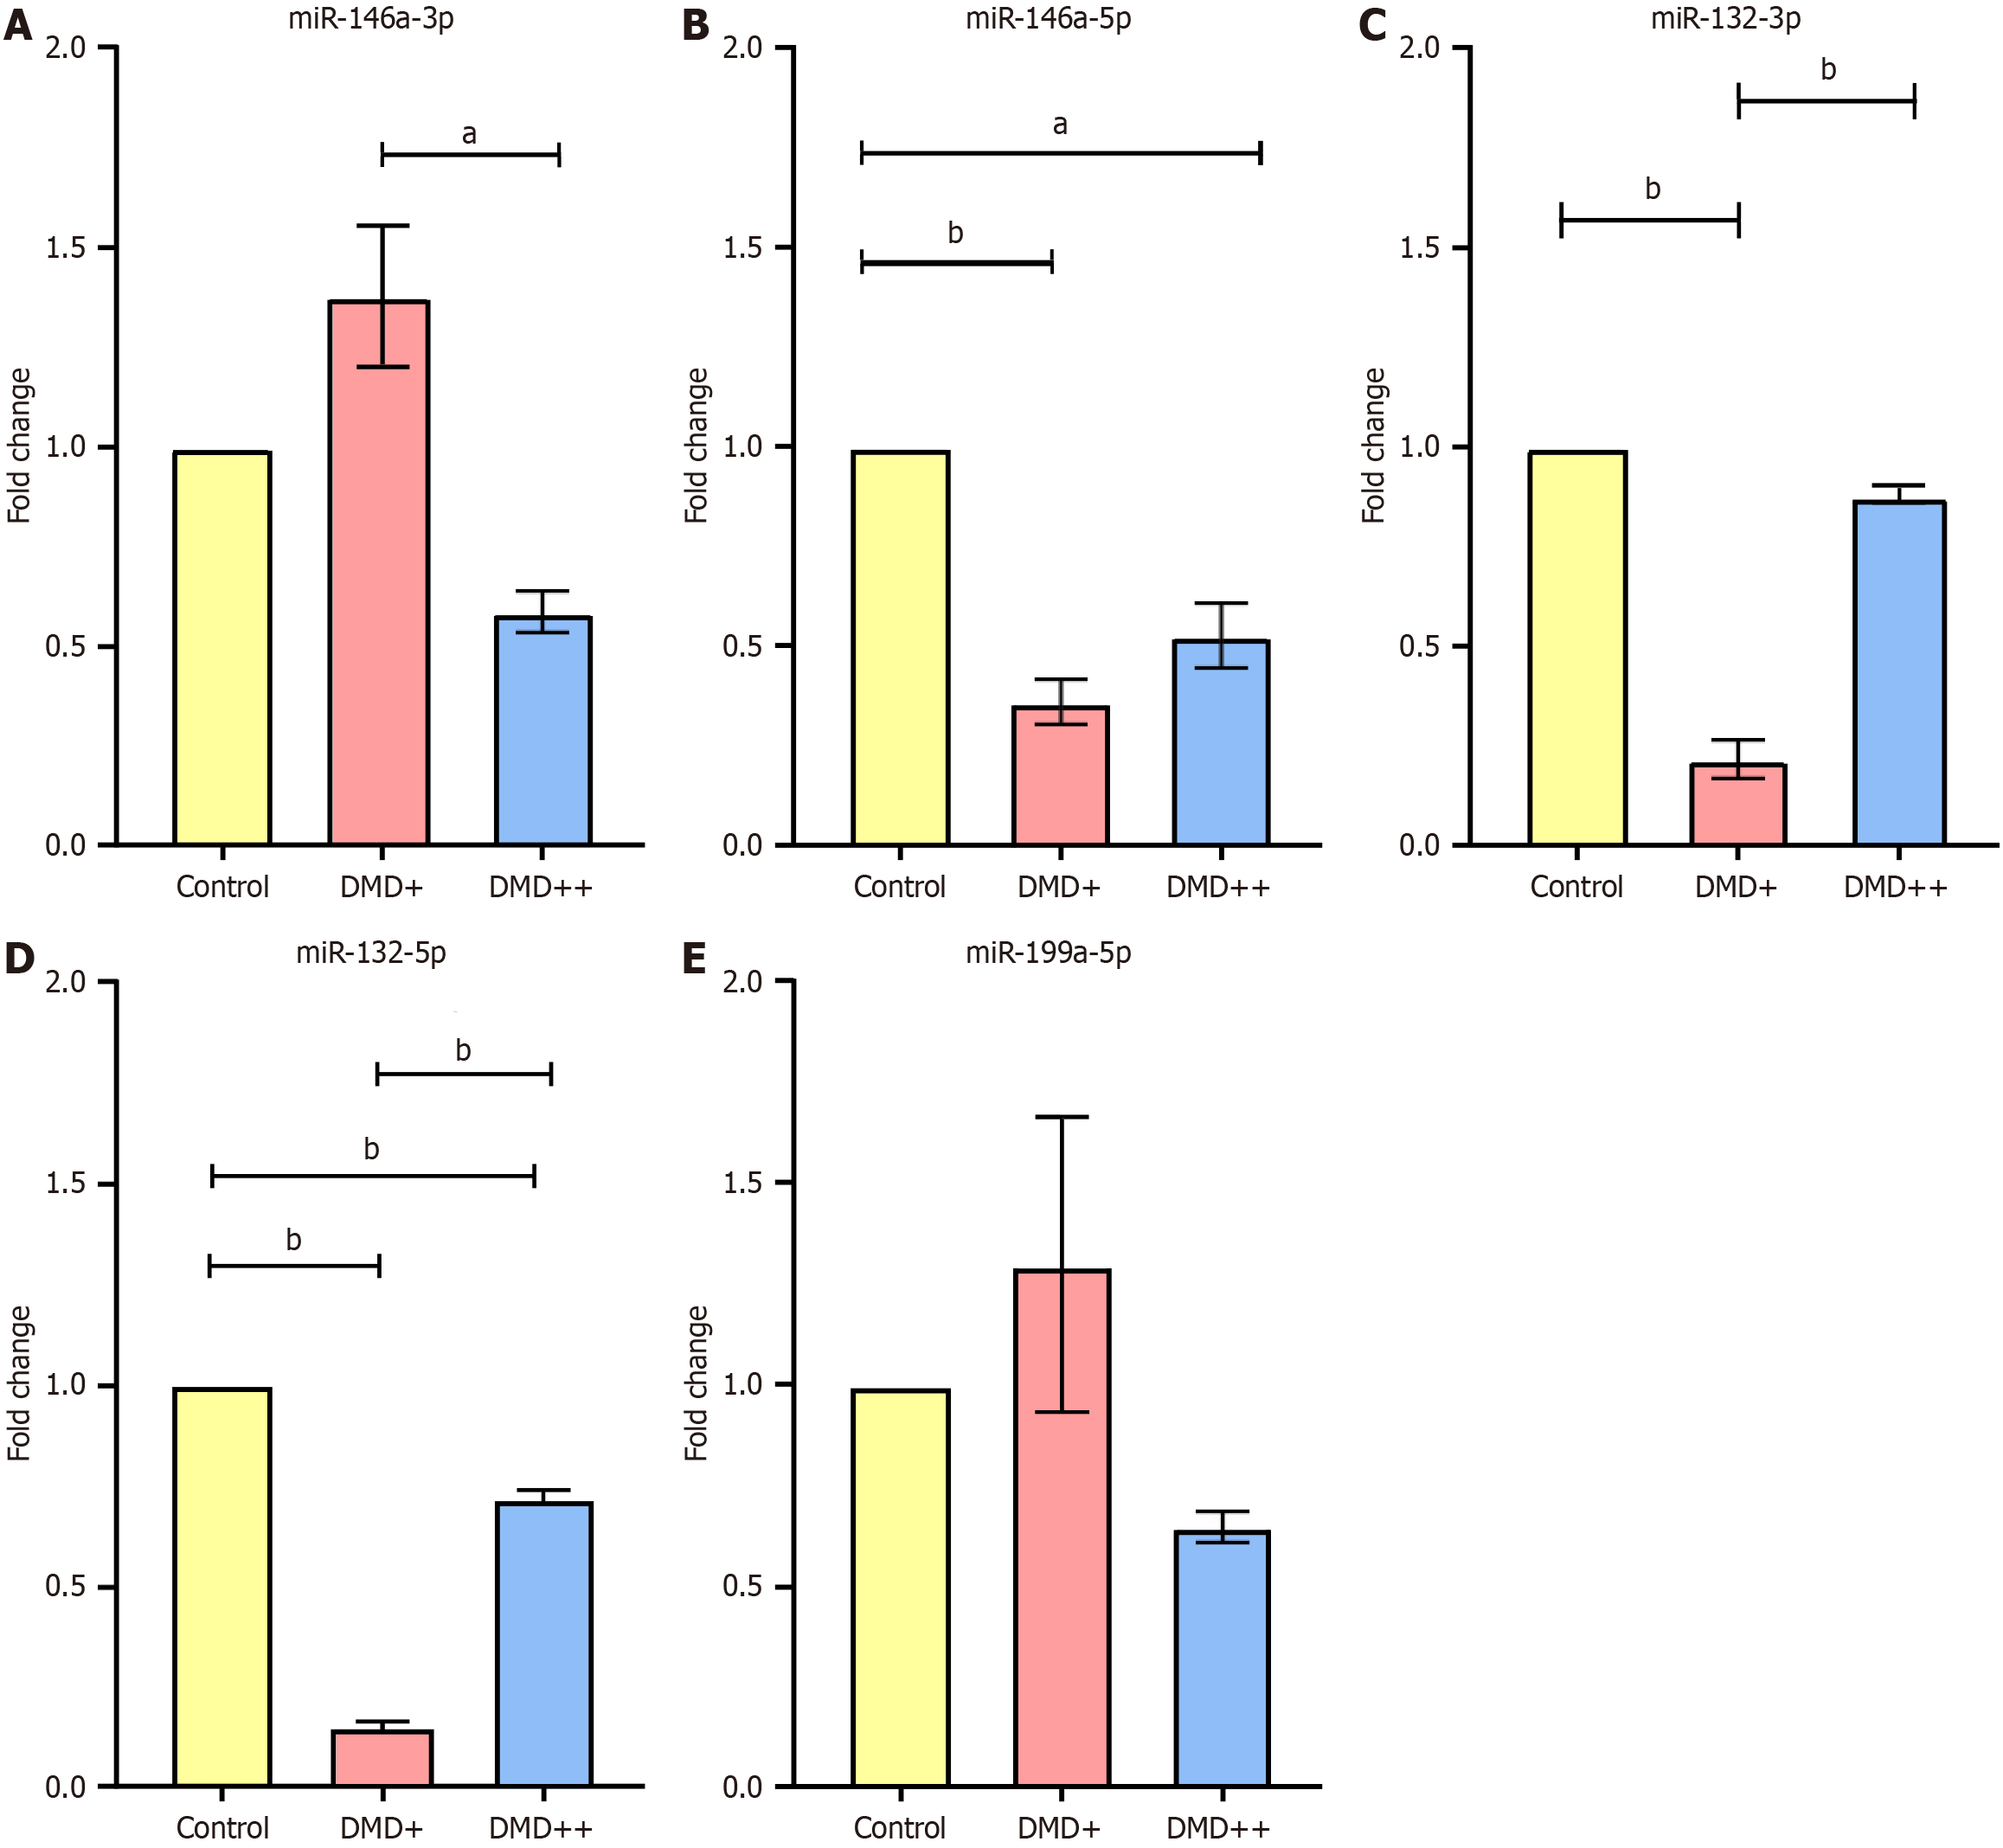
Figure 3 The differential expression of miRNA represented as fold change across the 3 samples: Control, Duchenne muscular dystrophy (DMD+), and DMD++.
A: miR-146a-3p; B: miR-146a-5p; C: miR-132-3p; D: miR-132-5p; E: miR-199a-5p. Significance is presented as aP ≤ 0.01 and bP ≤ 0.001. Data are presented as the mean ± SEM. DMD: Duchenne muscular dystrophy.
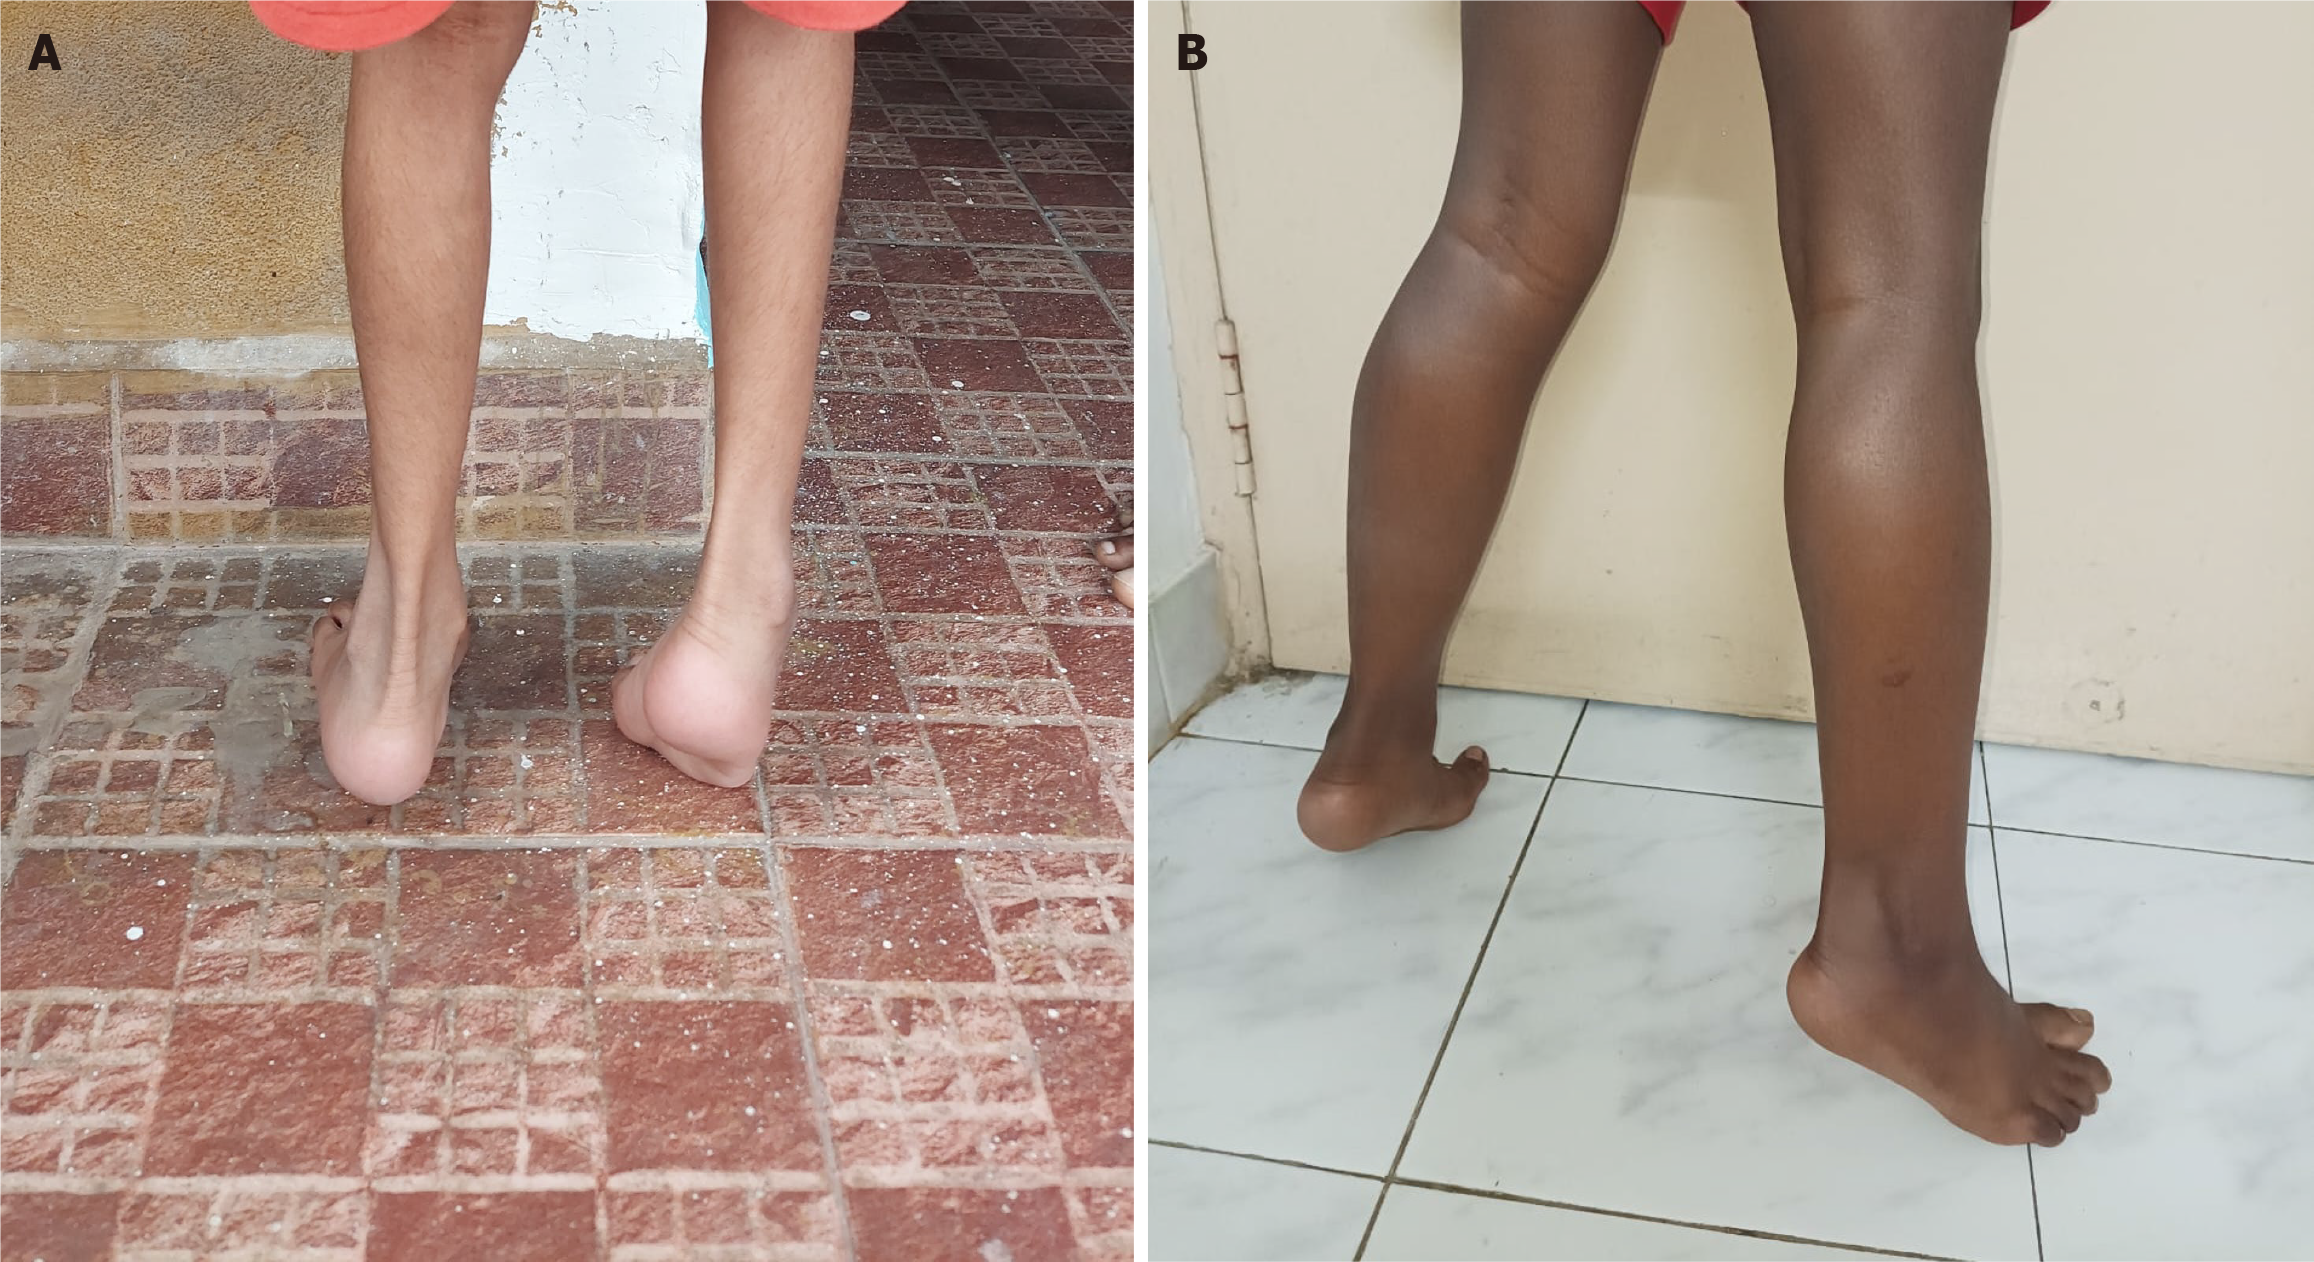
Figure 4 Variations in the lower limb of patients with dystrophy.
A: Duchenne muscular dystrophy (DMD+); B: DMD++.
- Citation: Sivakumar S, Rajavel A, Viswanathan V, Daniel EA, Gangadaran P, Natesan Sella R. miRNA dysregulation in Duchenne muscular dystrophy comorbidities. World J Exp Med 2025; 15(2): 100548
- URL: https://www.wjgnet.com/2220-315x/full/v15/i2/100548.htm
- DOI: https://dx.doi.org/10.5493/wjem.v15.i2.100548


