Copyright
©The Author(s) 2024.
World J Exp Med. Sep 20, 2024; 14(3): 92589
Published online Sep 20, 2024. doi: 10.5493/wjem.v14.i3.92589
Published online Sep 20, 2024. doi: 10.5493/wjem.v14.i3.92589
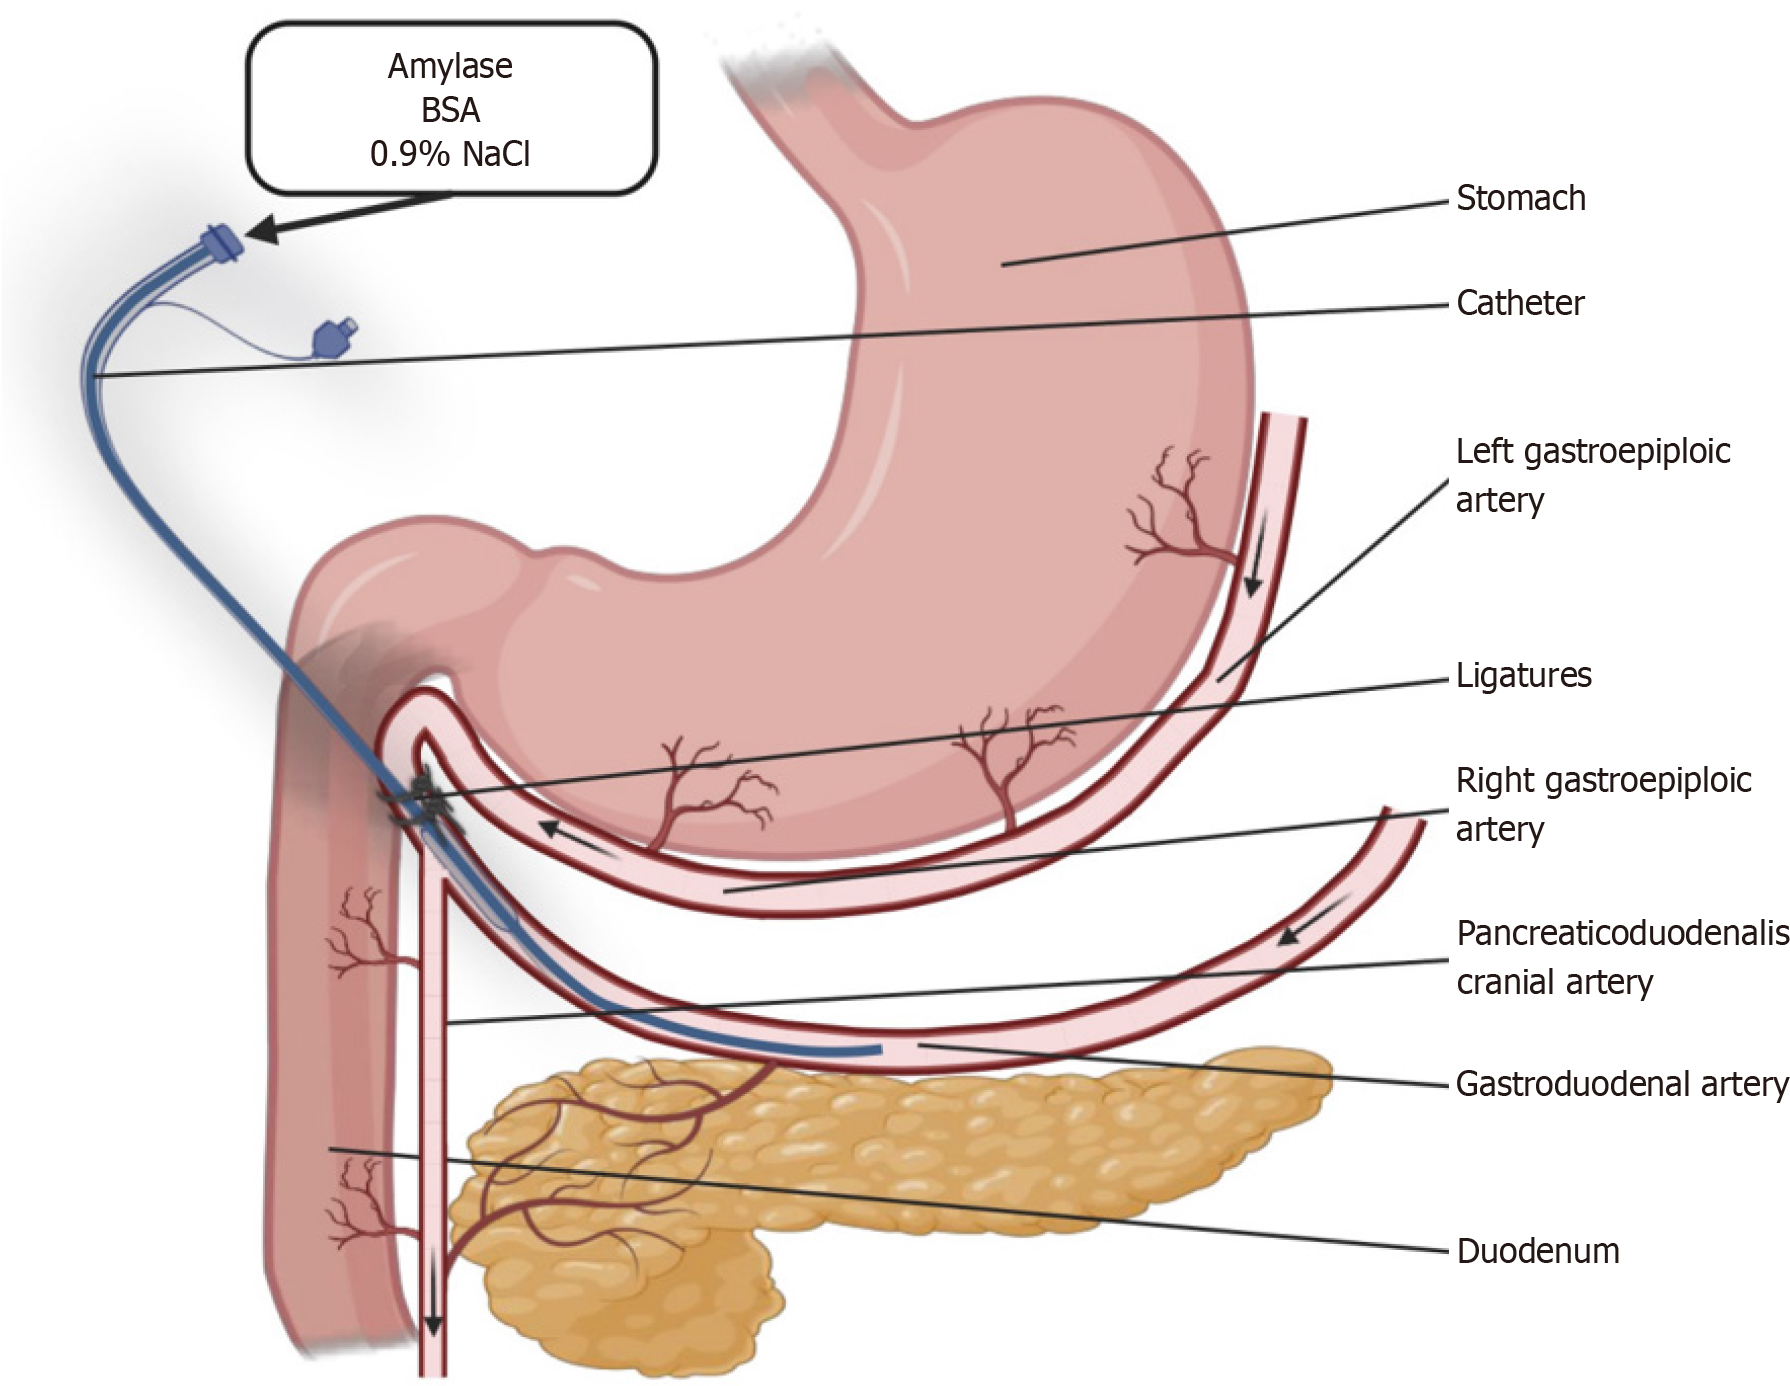
Figure 1 Schematic diagram showing the placement of the catheter, ensuring infusions exclusively to the pancreas and partially to the duodenum.
BSA: Bovine serum albumin.
Figure 2 Glucose and insulin levels after the intravenous glucose tolerance test in pigs 1 and 4 during infusion of amylase to the intrapancreatic arterial circulation.
A: Blood glucose levels; B: Plasma insulin levels. Data are expressed as individual values, data on area under the curve are expressed as mean ± SD. AUC: Area under the curve.
Figure 3 Glucose and insulin levels after the intravenous glucose tolerance test in pigs 5 and 6 during infusion of amylase to the intrapancreatic arterial circulation.
A: Blood glucose levels; B: Plasma insulin levels. Data are expressed as individual values, data on area under the curve are expressed as mean ± SD. AUC: Area under the curve.
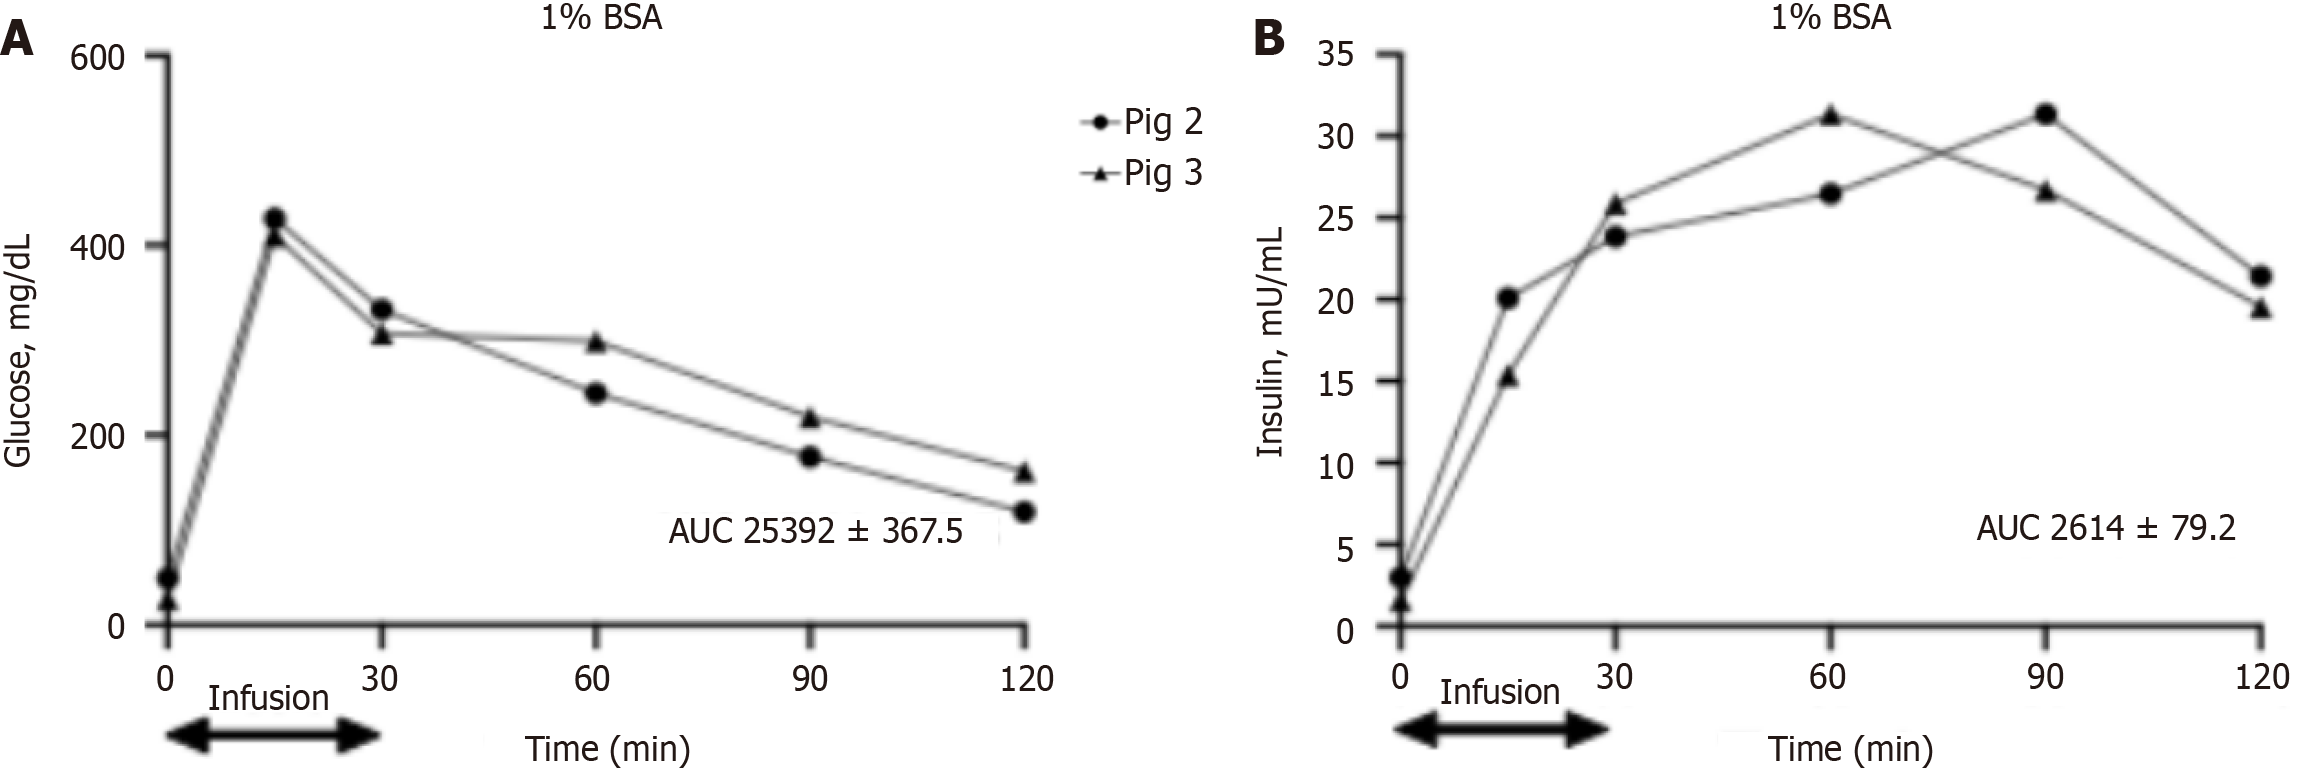
Figure 4 Glucose and insulin levels after the intravenous glucose tolerance test in pigs 2 and 3 during infusion of amylase to the intrapancreatic arterial circulation.
A: Blood glucose levels; B: Plasma insulin levels. Data are expressed as individual values, data on area under the curve are expressed as mean ± SD. AUC: Area under the curve; BSA: Bovine serum albumin.
- Citation: Pierzynowska K, Wychowański P, Zaworski K, Woliński J, Donaldson J, Szkopek D, Roszkowicz-Ostrowska K, Kondej A, Pierzynowski SG. Amylase intrapancreatic infusion delays insulin release during an intravenous glucose tolerance test, proof of acini–islet–acinar interactions. World J Exp Med 2024; 14(3): 92589
- URL: https://www.wjgnet.com/2220-315x/full/v14/i3/92589.htm
- DOI: https://dx.doi.org/10.5493/wjem.v14.i3.92589


