Published online Jun 20, 2023. doi: 10.5493/wjem.v13.i3.28
Peer-review started: January 6, 2023
First decision: March 15, 2023
Revised: April 7, 2023
Accepted: May 22, 2023
Article in press: May 22, 2023
Published online: June 20, 2023
Processing time: 160 Days and 17.1 Hours
The coronavirus disease 2019 (COVID-19) pandemic affects all aspects of our lives, including children. With the advancement of the pandemic, children under five years old are at increased risk of hospitalization relative to other age groups. This makes it paramount that we develop tools to address the two critical aspects of preserving children's health – new treatment protocols and new predictive models. For those purposes, we need to understand better the effects of COVID-19 on children, and we need to be able to predict the number of affected children as a proportion of the number of infected children. This is why our research focuses on clinical and epidemiological pictures of children with heart damage post-COVID, as a part of the general picture of post-COVID among this age group.
To demonstrate the role of children in the COVID-19 spread in Bulgaria and to test the hypothesis that there are no secondary transmissions in schools and from children to adults.
Our modeling and data show with high probability that in Bulgaria, with our current measures, vaccination strategy and contact structure, the pandemic is driven by the children and their contacts in school.
This makes it paramount that we develop tools to address the two critical aspects of preserving children's health – new treatment protocols and new predictive models. For those purposes, we need to understand better the effects of COVID-19 on children, and we need to be able to predict the number of affected children as a proportion of the number of infected children. This is why our research focuses on clinical and epidemiological pictures of children with heart damage post-COVID, as a part of the general picture of post-Covid among this age group.
Our modeling rejects that hypothesis, and the epidemiological data supports that. We used epidemiological data to support the validity of our modeling. The first summer wave in 2020 from the listed here school proms endorse the idea of transmissions from students to teachers.
Core Tip: The lack of vaccination strategy accelerates the spread of coronavirus disease 2019 among children and accelerate the spread among people below 50 years. Based on the latter hypothesis and the other three: (1) Disease spreads from children to adults – either directly to parents and grandparents or via network spread to different age groups; (2) the spread among children accelerates with the increasing R0 of different dominating viral variants; and (3) vaccinations among adults accelerate the spread among the less vaccinated group of children, we outlined the reasons for this age-restricted acceleration of the spread after the delta wave.
- Citation: Tomov L, Batselova H, Lazova S, Ganev B, Tzocheva I, Velikova T. Role of children in the Bulgarian COVID-19 epidemic: A mathematical model study. World J Exp Med 2023; 13(3): 28-46
- URL: https://www.wjgnet.com/2220-315X/full/v13/i3/28.htm
- DOI: https://dx.doi.org/10.5493/wjem.v13.i3.28
The coronavirus disease 2019 (COVID-19) pandemic impacts all aspects of our lives, including the increased burden on the healthcare system, altered work, education, social life, etc. The pandemic also affects children. They are at increased risk for type 1 diabetes post-COVID, even more, pronounced in children than the adult patients[1]. Additionally, they have persistent lung damage[2]. With the advancement of the pandemic, children under five years old are at increased risk of hospitalization relative to other age groups that have immunity from vaccination and/or infection[3]. This makes it paramount that we develop tools to address the two critical aspects of preserving children's health – new treatment protocols and new predictive abilities. For those purposes, we need to understand better the effects of COVID on children, and we need to be able to predict the number of affected children as a proportion of the number of infected children. This is why our research focuses on clinical and epidemiological pictures of children with heart damage post-COVID, as a part of the general picture of post-COVID among this age group.
Although severe acute respiratory syndrome coronavirus 2 (SARS-CoV-2) infection was previously considered clinically milder in children compared to adults, the severe consequences of COVID-19, known as multisystem inflammation in children (MIS-C), has become increasingly significant with the accumulation of practical experience worldwide. As we recently published, MIS-C is associated mainly with late post-viral immunological responses leading to multiorgan impairment and failure[4,5].
Except for liver involvement, cardiac damage is also typical in children after asymptomatic and symptomatic COVID-19, as myocardial, pericardial, and/or coronary manifestations. Recently, we presented the results from the retrospective analysis of pediatric patients with cardiovascular system involvement in 31.4% of confirmed COVID-19 cases admitted to the hospital[6,7]. The most common clinical features were acute myocarditis with severe contractile dysfunction, acute heart failure, and left main coronary artery dilation; systolic dysfunction, dilation and regional hypokinesia of the left ventricle; acute vasculitis with transient dilation of the coronary arteries; pericarditis as part of a pronounced polyserositis syndrome[6]. It has been demonstrated that children with pre-existing comorbidities (cardiovascular diseases, cancer, renal failure) are at risk for severe COVID-19[8,9].
Fortunately, the course of the disease after the complex treatment (immunomodulatory therapy with intravenous immunoglobulins and corticosteroids, inotropic drugs and anticoagulants) was favorable in all patients. Furthermore, although the COVID-19 therapy is non-specific, to some extent in some cases it may lead to further complications (i.e., liver injury, etc.)[10].
In the initial phase of the Covid-19 pandemic, some studies claimed that children rarely get COVID-19 and do not spread as much as adults via schools[11]. The airborne nature of the disease was also disputed[12], commenting also the short-range aerosol transmission and while masking will not decrease exposure to the virus to zero, it offers incremental benefits that, when combined with other strategies, will lower the risk of infection even more.
For this reason, very few preventive measures in schools in countries such as Bulgaria were implemented in 2020[13]. Transmission from children to adults was deemed secondary to the transmission from adults to children. After the first big wave in September to December 2020, masks were mandated in grades 5 and above but not enforced, with arguably low adherence, less than the general adherence[14] due to mask removal in breaks between classes.
We use mathematical modeling (time series analysis) to test the following hypotheses in the case of Bulgaria and to show the price of the lack of policy in schools: (1) The possibility of emerging variants to accelerate their spread among people below 50 years, thus compensating for the effect of acquired partial herd immunity; (2) disease spreads from children to adults – either directly to parents and grandparents or via network spread to different age groups; (3) the spread among children accelerates with the increasing R0 of different dominating viral variants; and (4) vaccinations among adults accelerate the spread among the less vaccinated group of children. Our modeling can be used for both explanations of dependency and short-term prediction of a future number of cases. It is also potentially applicable to small datasets, such as the MIS-C cases at Pirogov Hospital, as we show in this paper.
With starting the pandemic in Bulgaria, children were mostly speared from infection. On the one hand, it was thought that COVID-19 took a mild course in children. On the other hand, the testing was at the lowest rate among children. Up to now, the total number of infected children (0-18 years) is 103743[15].
We aimed to demonstrate the role of children in the COVID-19 spread in Bulgaria and to test the hypothesis that there are no secondary transmissions in schools and from children to adults. Our modeling rejects that hypothesis, and the epidemiological data supports that. We use epidemiological data to support the validity of our modeling. The first summer wave in 2020 from the listed here school proms endorses the idea of transmissions from students to teachers.
In our previous research[16], we used ARIMA models to predict deaths weekly from new cases among different age groups. The approach is suitable for time series analysis with time-varying effective reproductive number Rt. Moreover, it allows us to regress against other predictors to test some hypotheses which set of factors influences the spread of the disease. For children, we have several hypotheses.
The most important one is the significant influence of school closure on the number of new cases. The second in order of importance is that the disease spreads from children to adults – either directly to parents and grandparents or via network spread to different age groups. The third hypothesis is that the spread among children accelerates with the increasing R0 of different dominating viral variants. Since the R0, or basic reproduction number[17], is the number of secondary cases of a disease that result from the emergence of a single index case in a population of uniformly dispersed susceptible people, therefore, if the R0 is less than one, it indicates that the epidemic is under control; if it is larger than one, it indicates that the disease is spreading.
The fourth hypothesis is that vaccinations among adults accelerate the spread among the less vaccinated group of children. By acceleration, we mean the increased proportion of susceptible children with the vaccinations of the adults that redirects the spread among them. The fifth hypothesis, which is not self-evident, is that the vaccinations, when done uniformly across age groups above 0-19 age group, have positive feedback on the spread among the age groups over 60. Our basis for this last hypothesis is the difference in mobility and contacts by age group. Preferential vaccination of the age groups with higher contribution to the spread should decrease it to a larger degree than uniformly distributed vaccination if the vaccines slow the spread – if they convey some protection from infection.
Although our modeling is statistical in nature, there are autoregressive components in ARIMA models that should count for the effects of the accumulating number of survivors with their protection against reinfection. Although this number is subject to considerable uncertainty and is limited by our knowledge for the reinfections with SARS-CoV-2, seasonal coronaviruses induce short-lived immunity and we might expect a similar pattern here[18].
The accumulated protective immunity in the form of total cases could be added as a factor, but it has a high correlation with emerging variants. The emergence of new variants is the consequence of that increase in immunity and the co-evolution of humans and the pathogen, seeking equilibrium. This is one reason to expect the role of variants to be harder to detect in our models and to add only them as a factor. They also represent the net effect of acquired immunity. Any detectable influence will be the result of the net balance between increased virulence and immune escape of the viral variants vs the acquired immunity on a population level.
We use the official weekly date from the Unified National Portal in Bulgaria[19]. New cases are split into age groups - 0-19, 20-29, 30-39, 40-49, 50-59, 60-69, 70-79, 80-89, and 90+ years old. For vaccinations, we use data from [Our World In Data, Coronavirus (COVID-19) Vaccinations, https://ourworldindata.org/covid-vaccinations?country=BGR]. For the dominance of other virus variants, we use data from National Centre for Infectious and Parasitic diseases[20]. Finally, we use the Oxford stringency index data for school closures[21]. The data is categorical – 0-1-2-3 for different levels of school closures.
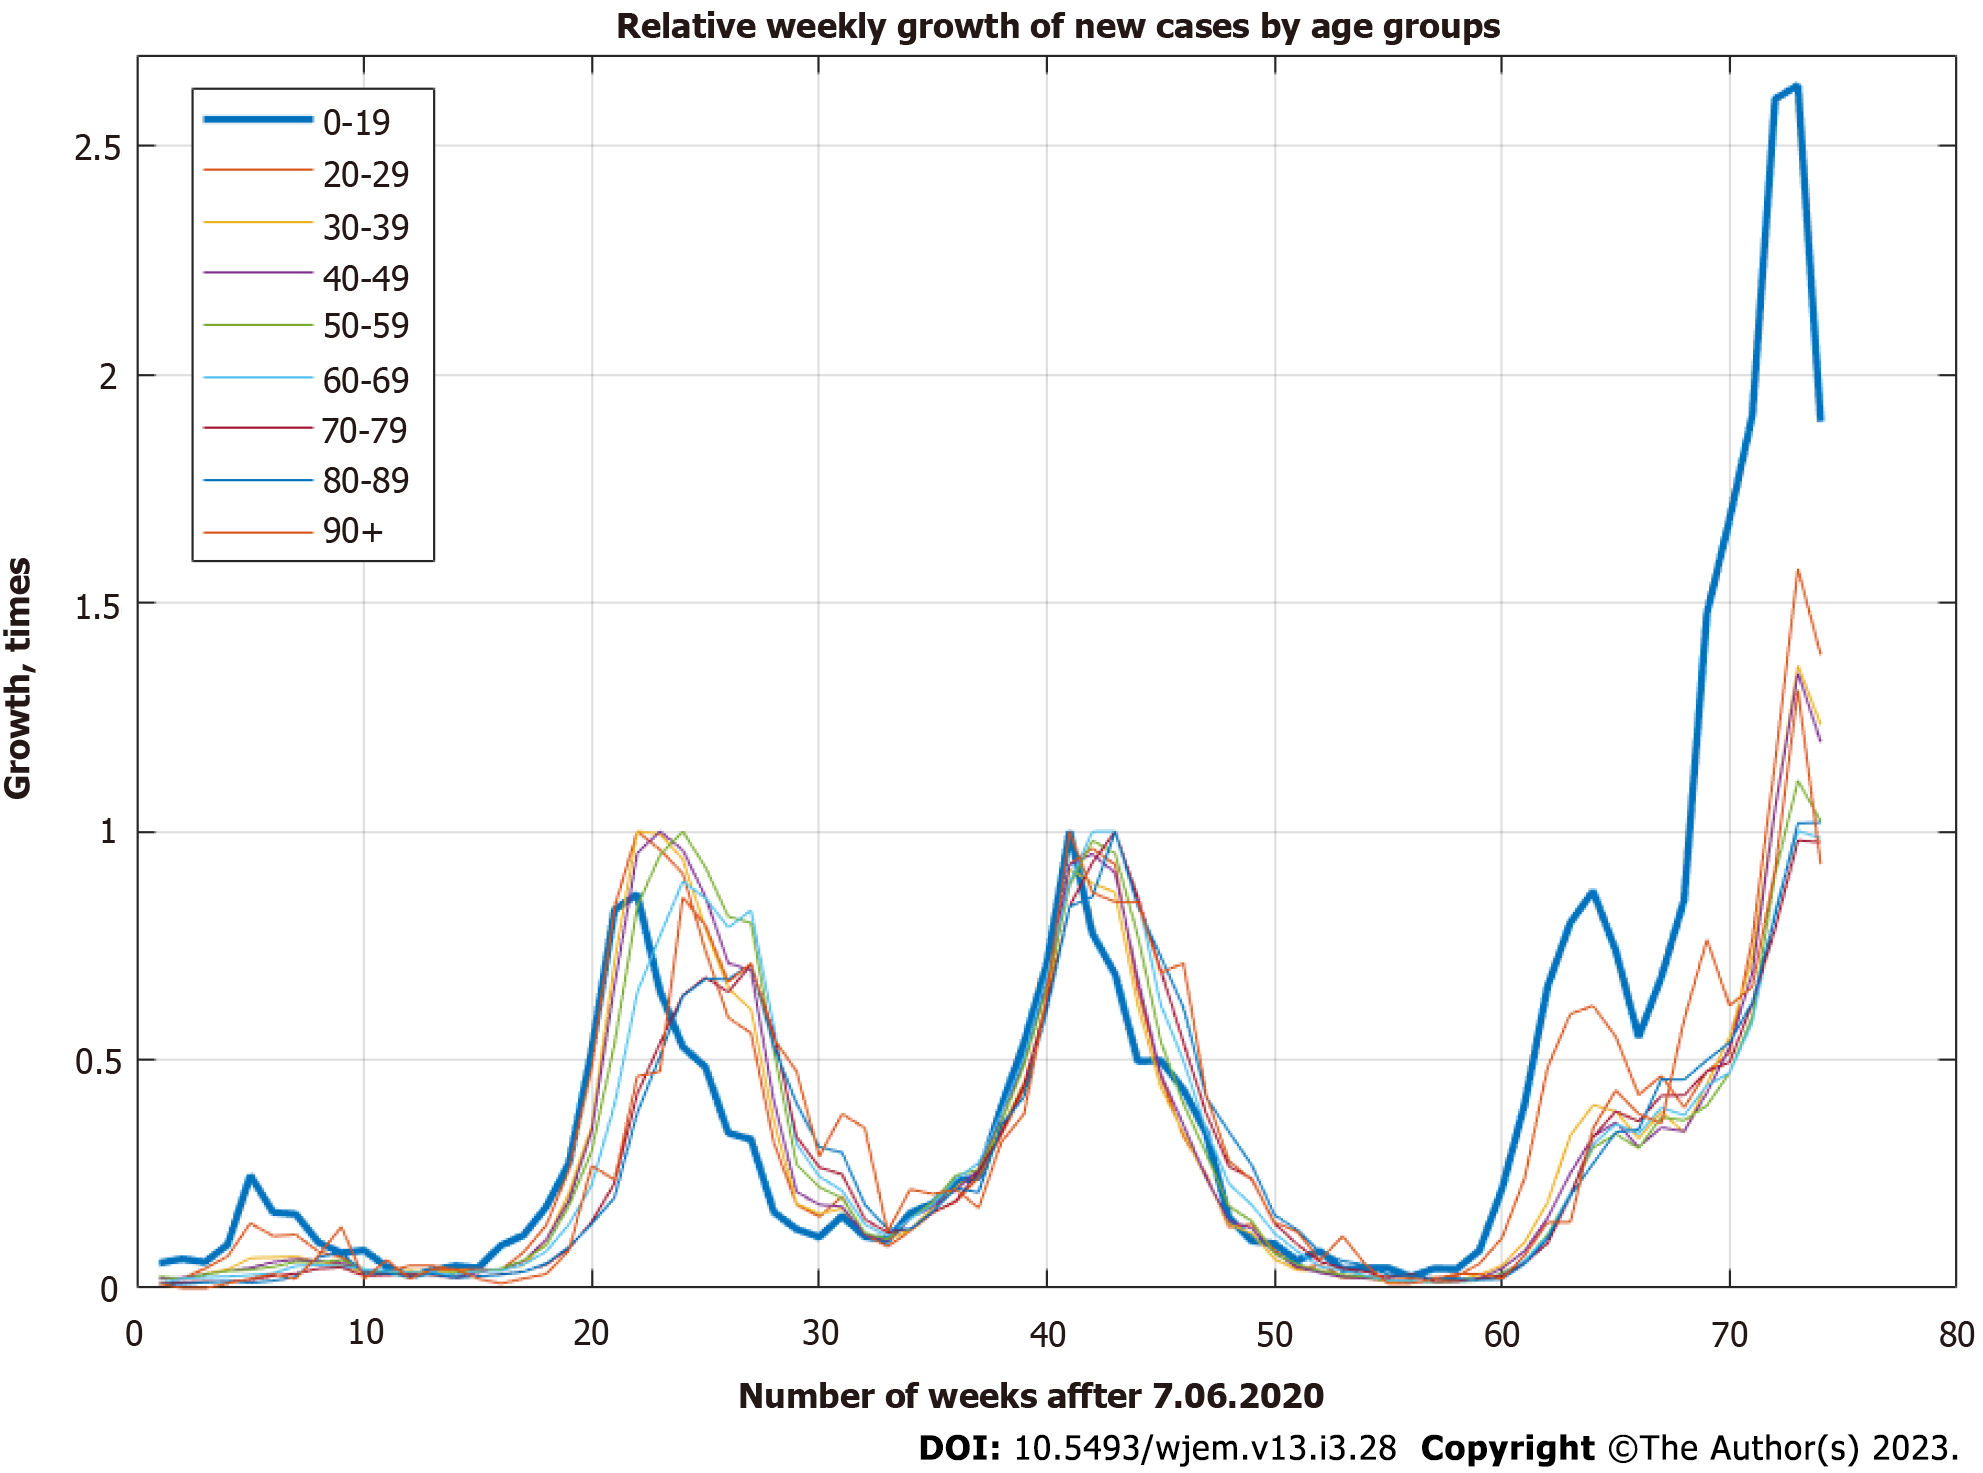
The data for new cases in different age groups is on a daily basis and is cumulative. We differentiate it and aggregate it weekly with the help of the open-source platform Octave in the interval between June 7, 2020 (week 23) and November 8, 2021 (week 44). We have a set of 74 wkly observations. As can be seen from the data (Figure 1), there is a very clear lag between new cases for 0-19 years, and other age groups – a consecutive movement from lower to higher age groups can be seen before any modeling being done.
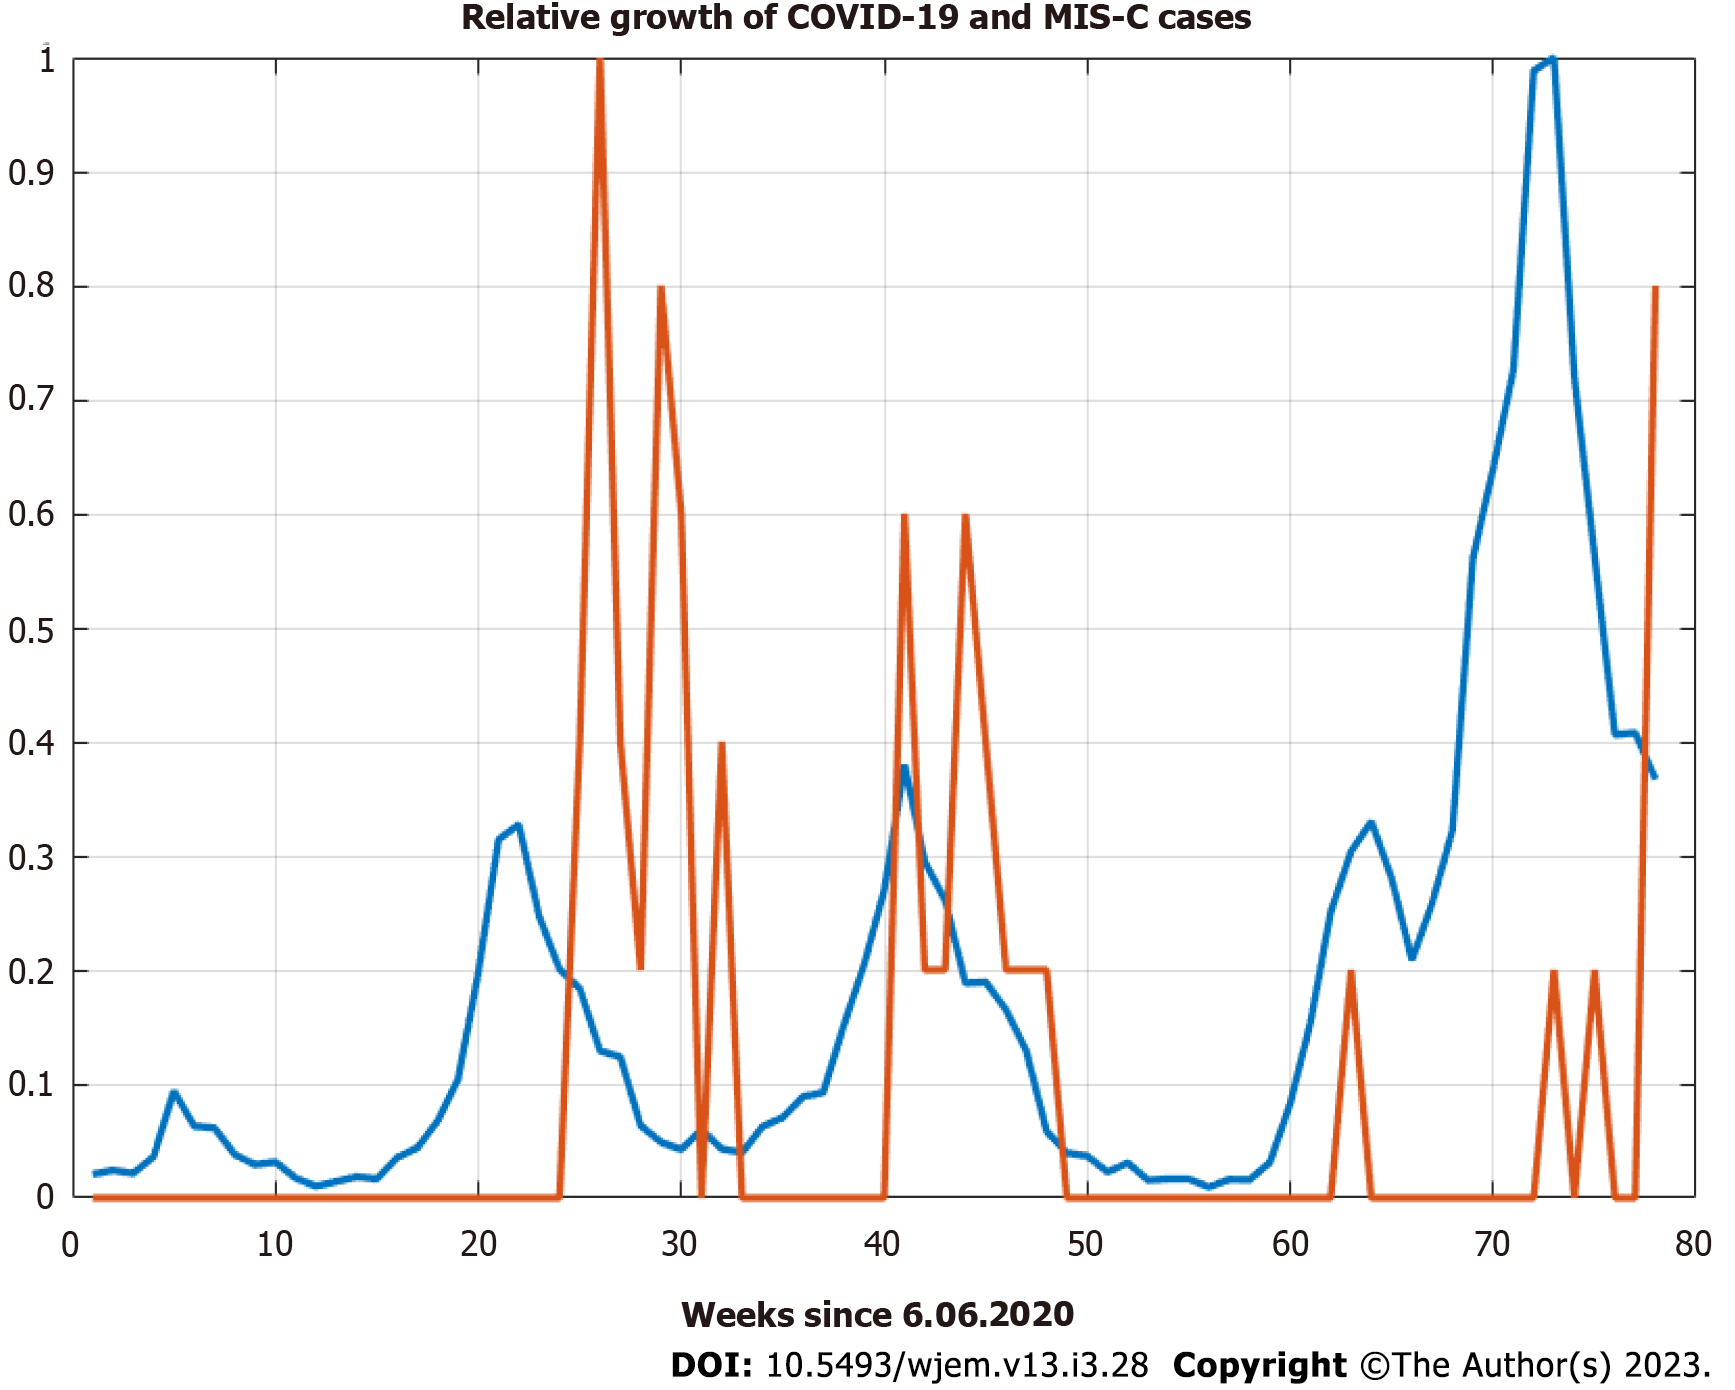
The sample crosscorrelation function between new cases for 0-19 year and the MIS-C cases show similar behavior with even larger lags up to 40 d (Figure 2 and 3) which shows the potential usefulness of a model, that describes the pandemic spreads among age groups. Children with MIS-C are lagging further behind the cases among adults.
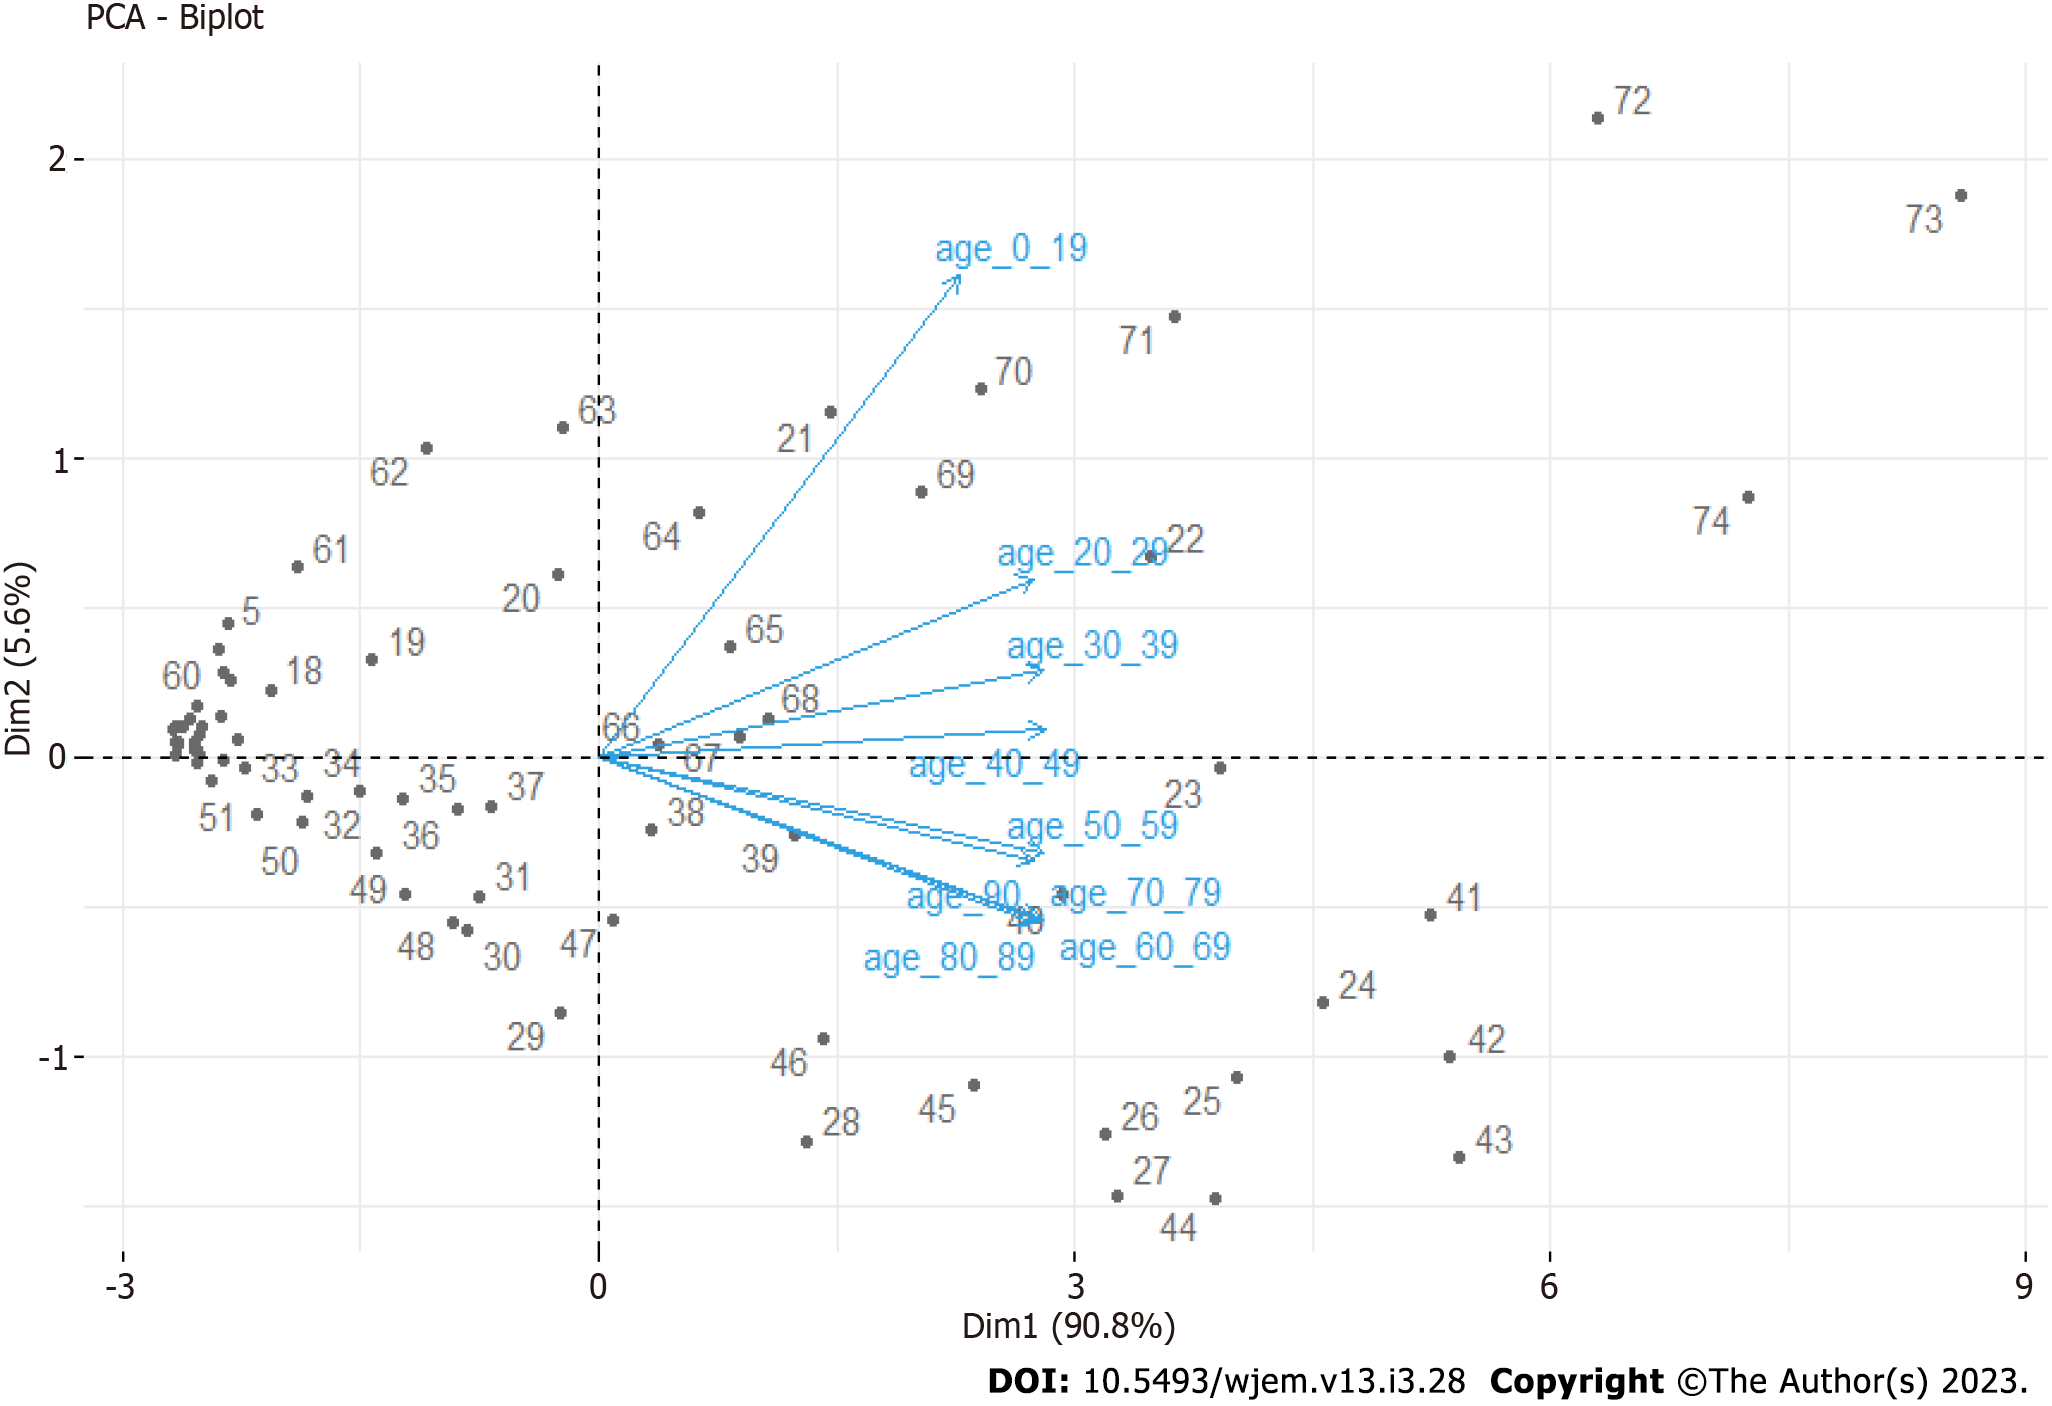
From the updated Principal Component Analysis (Figure 4), we can see that the 0-19 age groups stand apart from others, and other clear groups are identified – 20-49 years and 60-89 years. For our purposes, here we aggregate 20-49 years and 60-89. We leave 50-59 and 90+ due to a weaker correlation. Our hypothesis for 90+ is that these people live isolated from relatives, often in nursery homes or villages with weak traffic outside of summers, where seasonality decreases the spread. For the 50-59 age group, this is the age group in which children have grown up and are no longer in school. This is one possible explanation for the weaker connection to the 0-19 age group.
We used vaccines and variants data to create factor variables. For vaccines, 0%-9.99% of fully vaccinated people are with value 0%, 10%-19.99% are with 1%, and 20%-29.99% are with 2. For variants, the wild type from Wuhan is with 0; alpha is with 1, and Delta is with 2. Therefore, we do not consider it, for now, Delta+ separately, but when it gets dominant, we can add another value, 3, and we will update our model. As we showed in our previous research on which we step here, there are serious correlations between new cases in different age groups, which is the reason why we aggregate cases by combining age groups.
First, we investigated the spread among children. To test it, we used regression with ARIMA errors. Like in our previous research, we use R, with packages "forecast" and "urca". We examine for stationarity the time series with two different tests - Kwiatkowski-Phillips-Schmidt-Shin (KPSS) tests[22] and the Augmented Dickey-Fuller test (ADF)[23].
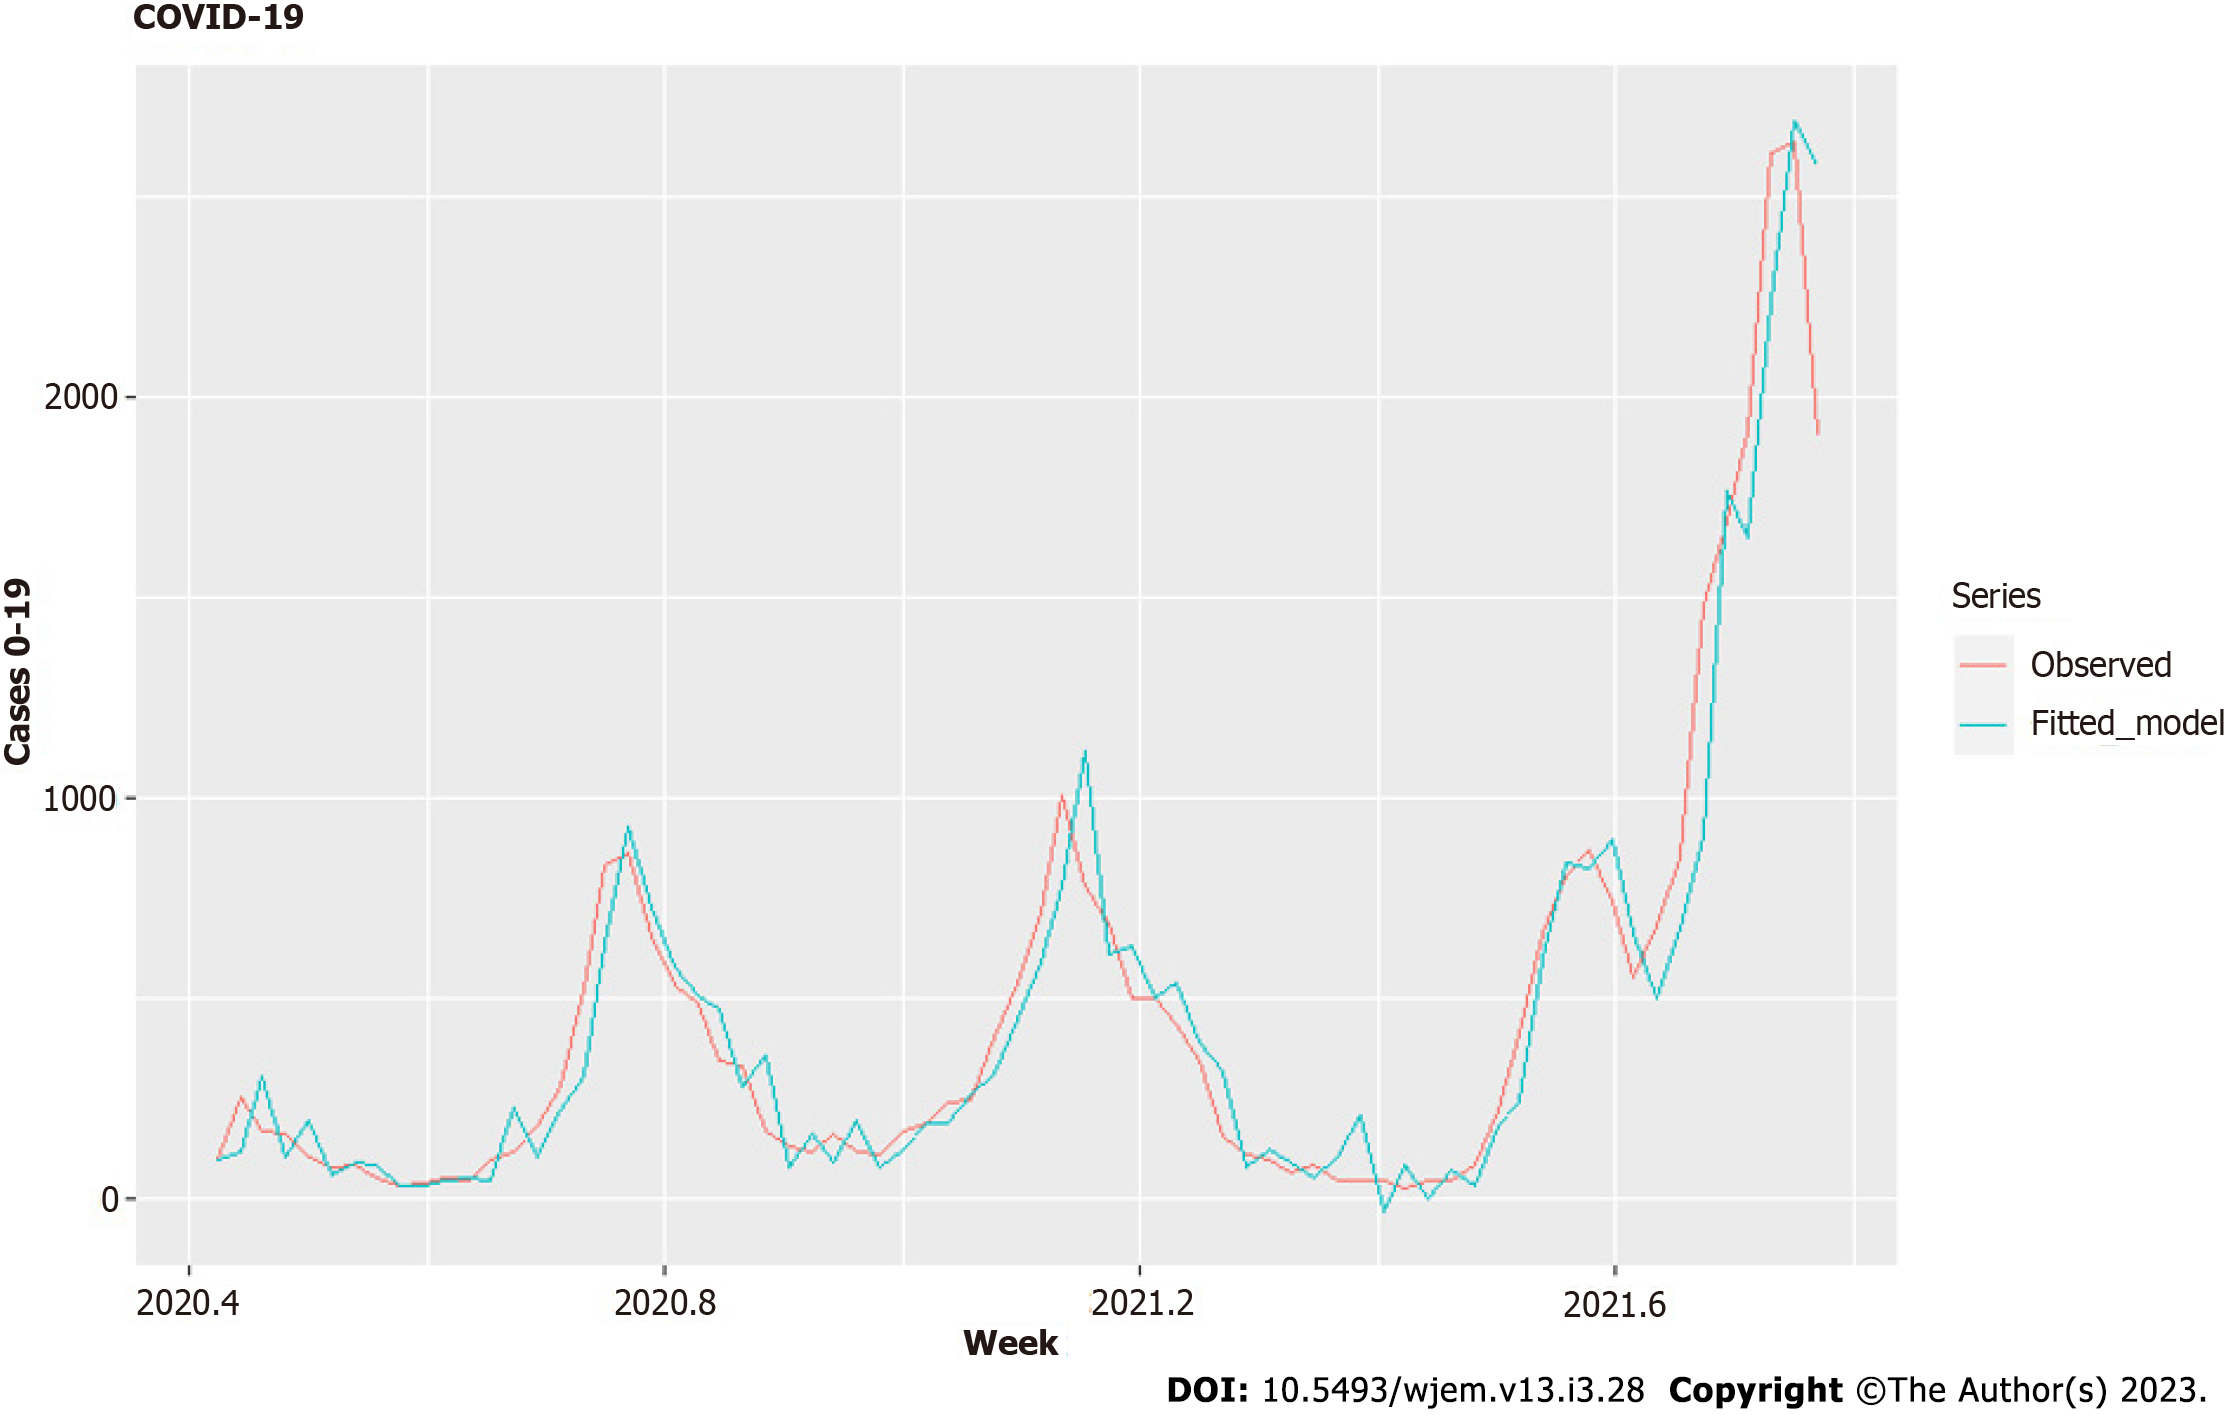
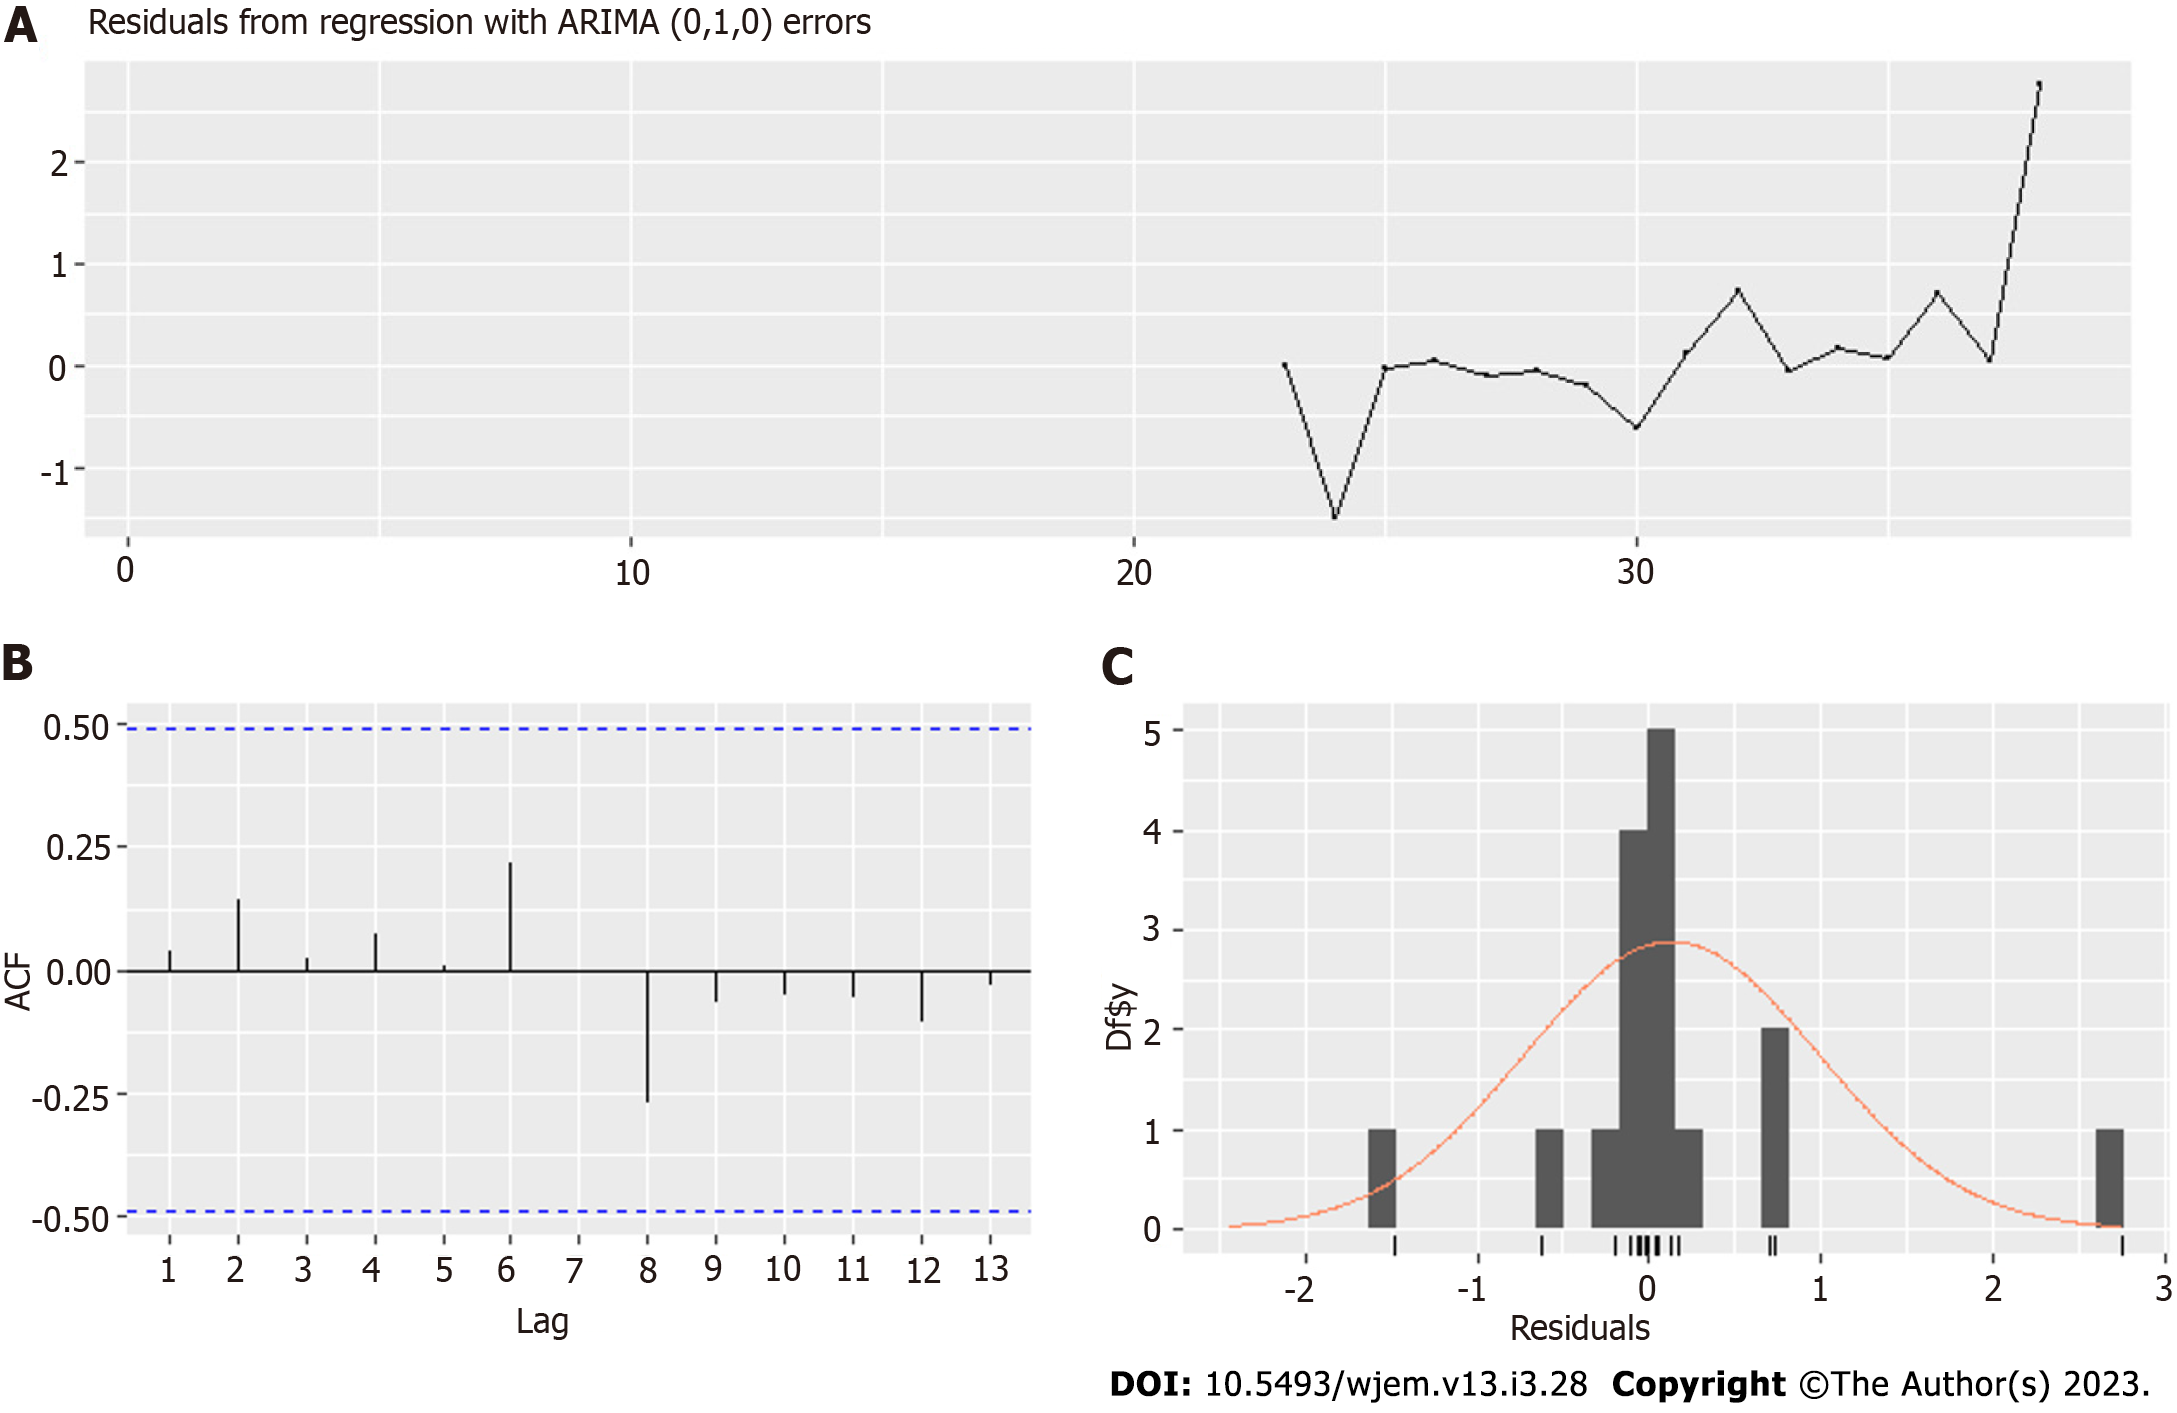
In the case of weekly data for 0-19 years old, both tests gave an order of differentiation 1. Therefore, we used the ARIMA model with fixed order of differentiation 1 and the auto for our purposes.arima() function[24] to select the best possible model. Our regressors are the variants factor and the vaccines factor. In addition, the same function estimates the dynamic regressions by adding the predictors thanks to the argument "xreg." After some additional lag selection of the chosen regressors, based on RMSE, MAPE, MAE, AIC, practical considerations and the standard errors of the coefficients, we obtained an optimal model - Model I (Tables 1 and 2, Figures 5 and 6) based on minimal data errors covering the period from June 7, 2020, to November 2, 2021.
| Variables | Variants | Vaccines | Schools L1 | Schools L2 |
| Variants | 1 | 0.7877448 | -0.4553950 | -0.4553950 |
| Vaccines | 0.7877448 | 1 | -0.4089070 | -0.4502049 |
| Schools L1 | 0.4553950 | -0.4089070 | 1 | -0.4089070 |
| Schools L2 | 0.4553950 | 0.4502049 | 0.8506835 | 1 |
| Model summary | ||
| Coefficient | Estimate | Standard error |
| MA1 | 0.4995 | 0.1272 |
| Variantsa | 71.0883 | 98.4872 |
| Vaccines L2 | 191.2172 | 114.5689 |
| Schools L1 | -103.5798 | 57.1372 |
| Schools L2 | -37.4081 | 56.7021 |
| R2 | 0.926 | |
| RMSE | 154.84 | |
| Bias | 8.79 | |
| MAPE | 43.35 | |
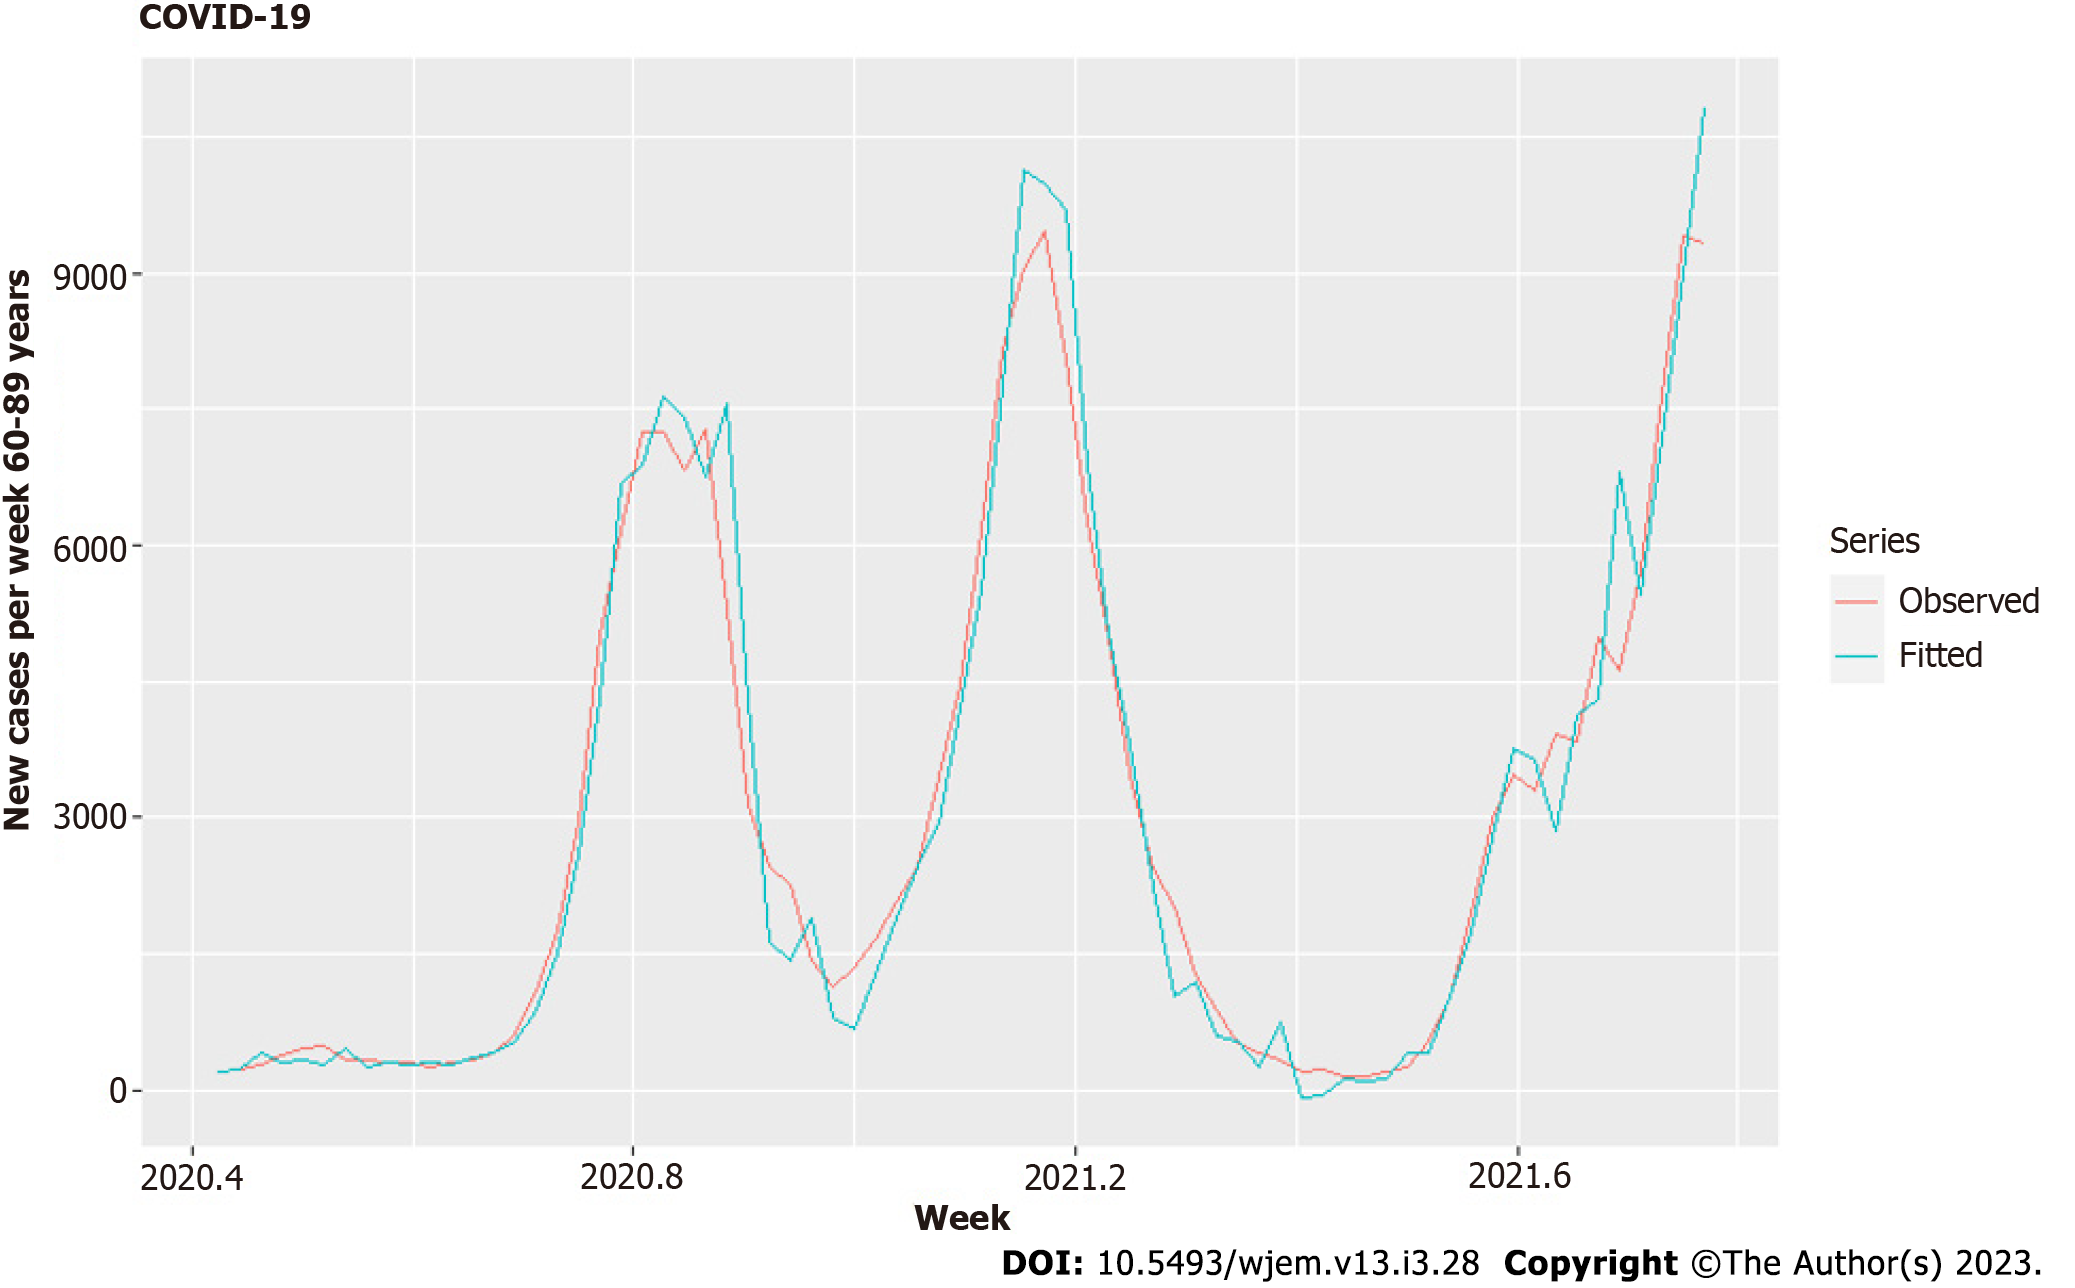
One of our significant hypotheses is the spread across age groups – from children to parents and grandparents in households and by secondary contacts. There are clear lags, shown in Figure 1, for which we model here. We separate the other age groups into two main groups – the group of parents 20-49 and the group of grandparents with contacts to children 60-89. The age group 50-59 is largely devoid of direct contact with children or grandchildren, and the same is for 90+. We used second-order differencing on our model to account for quadratic growth[25] and decrease the correlation between predictors to acceptable levels. Using the similar criteria as in Model I, we receive optimal model - Model II (Tables 3 and 4, Figures 7 and 8)
| Variables | Variants | Vaccines | 0-19 L1 | 0-19 L2 | 0-19 L3 |
| Variants | 1 | 0.00 | -0.08 | 0 | 0.00 |
| Vaccines | 0 | 1 | -0.19 | -0.13 | 0.34 |
| 0-19 L1 | -0.08 | -0.19 | 1 | -0.40 | -0.04 |
| 0-19 L2 | 0 | -0.13 | -0.40 | 1 | -0.28 |
| 0-19 L3 | 0.00 | 0.34 | -0.04 | -0.28 | 1 |
| Model summary | ||
| Coefficient | Estimate | Standard error |
| MA1 | -0.4661 | 0.1438 |
| Variantsa | 147.7111 | 385.2214 |
| Vaccines | 548.6656 | 412.7460 |
| 0-19 L1 | 1.2614 | 0.5521 |
| 0-19 L2 | 1.4164 | 0.5521 |
| 0-19 L3 | 1.1012 | 0.6543 |
| R2 | 0.962 | |
| RMSE | 620.16 | |
| Bias | -16.44 | |
| MAPE | 23.38 | |
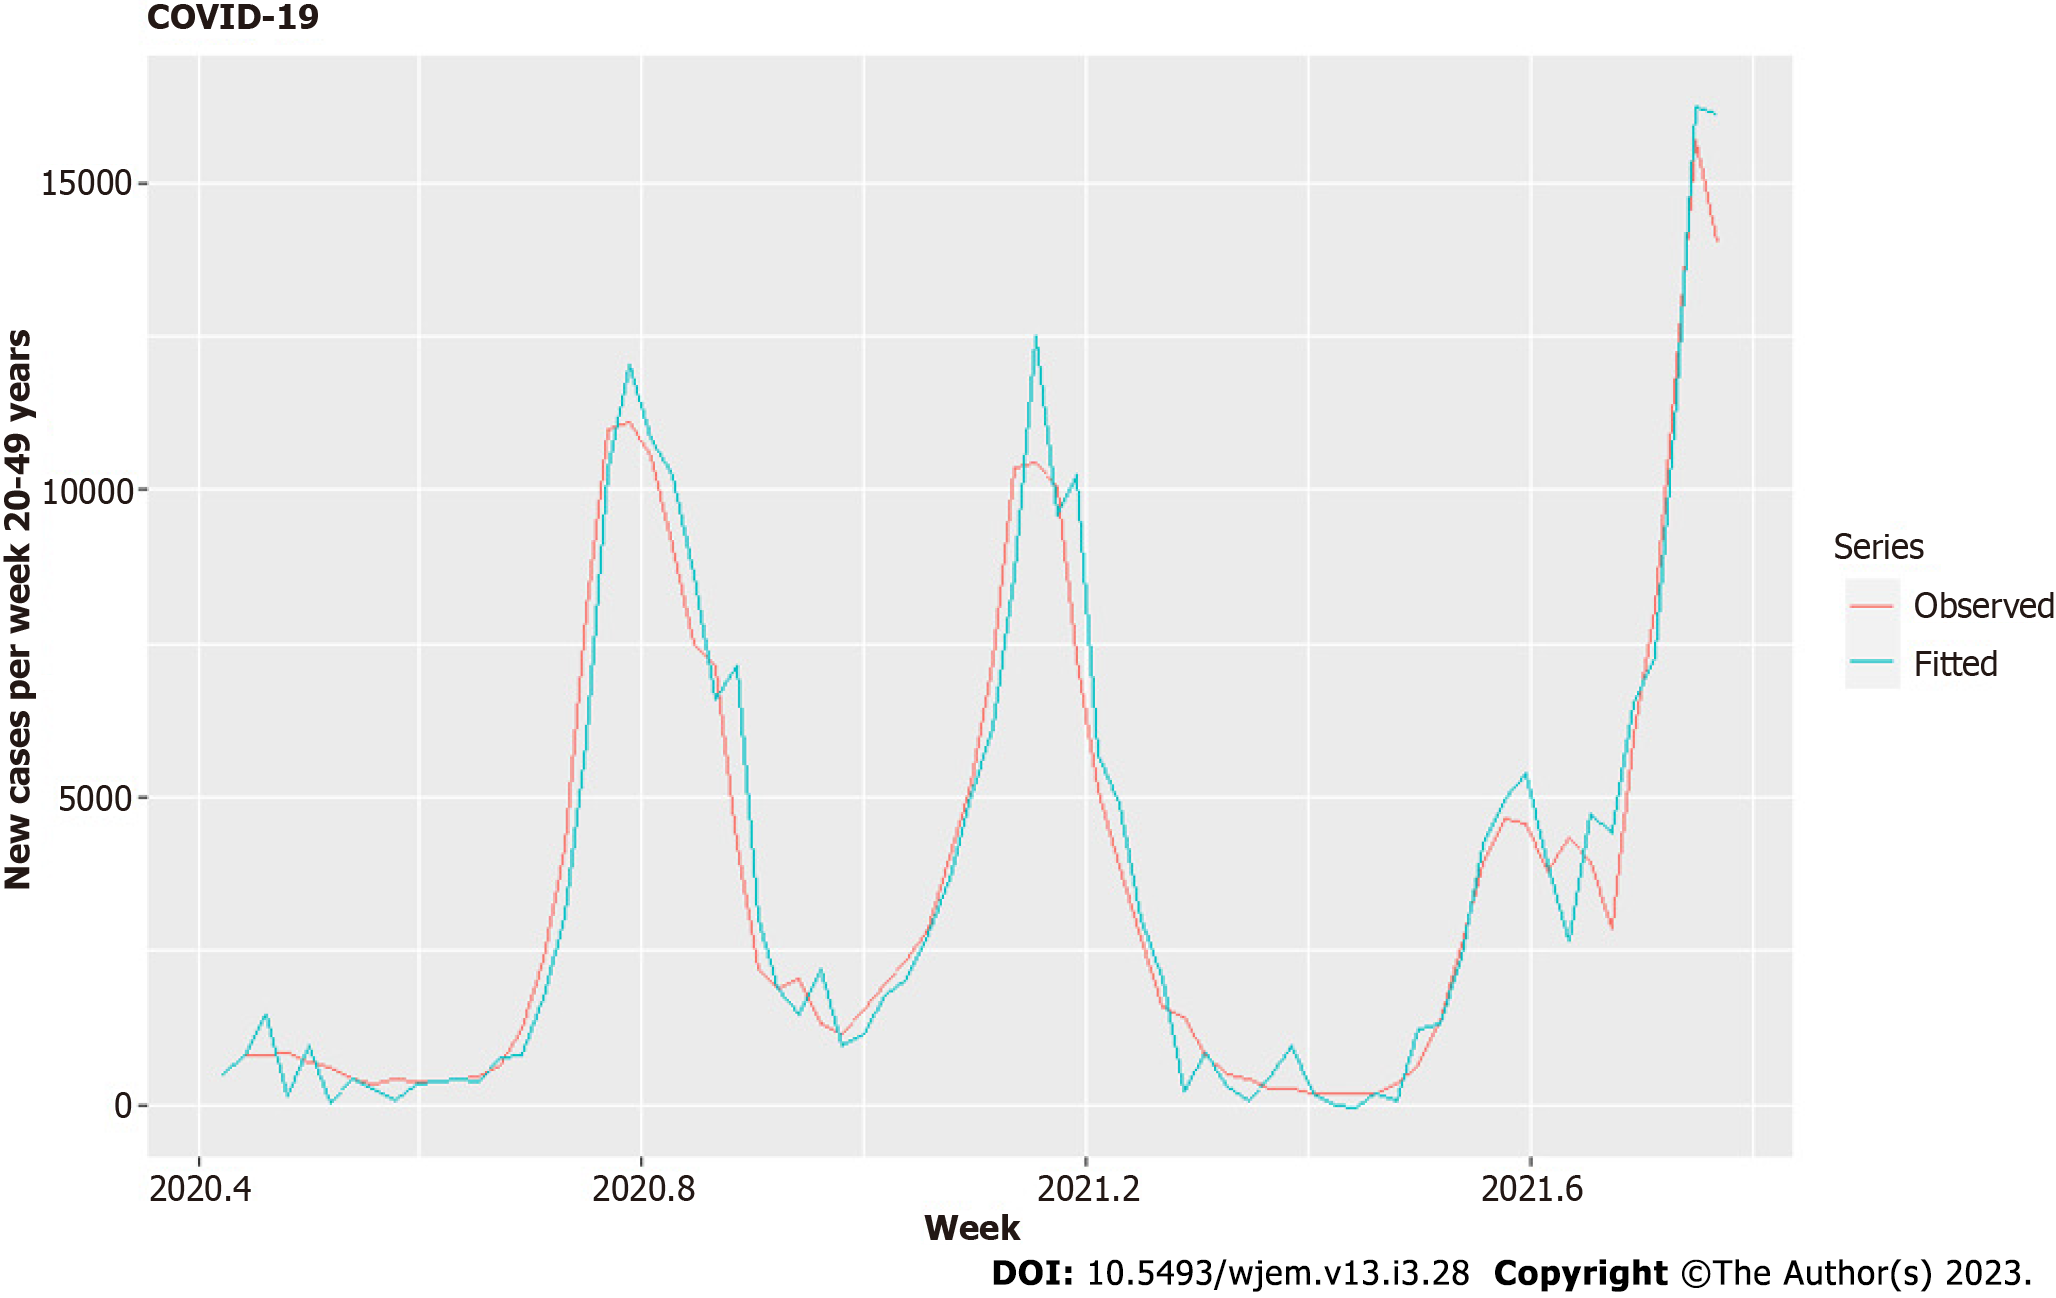
For our third model – Model III, we use the same regressors, but this time against the new weekly cases for the age groups 20-49 (Table 5, Figures 9 and 10).
On the individual level, the onset of symptoms from MIS-C is, on average, 5 wk (4 to 6 wk) after the acute phase of the disease[26]. On the regional level, however, we see very clearly much more significant delays from cross-correlation analysis between new cases of 0-19 years old and new cases of MIS-C on a weekly basis (Figures 2 and 3). The delays are 41-48 wk between new cases and MIS-C cases. One possible explanation for this is that MIS-C is a very low probability event, which means that many covid-19 cases are necessary for one mis-c case to happen, and a lot of time must pass to accumulate these cases. Another possible explanation is that the analysis included data from a single center in the capital of Bulgaria, which cannot be fully representative considering that the Department is intensive and urgent but has no cardiology profile.
On the other hand, accumulating data for more than one year can make it possible to search, including the "seasonality" hypothesis. However, when December came, naturally, there was a peak again. Unfortunately, however, we did not find a description of this phenomenon in the literature.
"In this cohort study of 248 persons with MIS-C, MIS-C incidence was 5.1 persons per 1000000 person-months and 316 persons per 1000000 SARS-CoV-2 infections in persons younger than 21 years. Incidence was higher among Black, Hispanic or Latino, and Asian or Pacific Islander persons compared with White persons and in younger persons compared with older persons."[27]. Another more straightforward but less likely explanation is due to the dynamics of repeated waves which are highly correlated with each other (very similar in nature). It is less likely due to the significantly higher correlations between cases and MIS-C for the more considerable lags of 41-48 wk. Whatever the cause, a simple predictive model benefits from the lags with higher correlations.
The epidemiological data includes 4 additional MIS-C cases, a total of 39, which arrived in weeks 77th and 78th since June 6, 2020 (the initial date for new cases by age groups time series), which is November 29, 2021 - December 5, 2021. The relative growth does not display these leading delays (lags) of over 40 wk, which shows why it was necessary to compute the cross-correlation (Figure 2) function in the first place. The ADF shows one root at unity – the process of MIS-C arrival is non-stationary, but its first finite difference is a stationary process. Therefore, at least one differencing is needed for Arima modeling.
We can consider the arrival times of children with MIS-C as independent in time. This is possible due to the perceived random nature of the occurrence of MIS-C due to independent factors and the lack of clear predictors of which child will have MIS-C in the post-acute phase. Therefore, the most suitable distribution for independent arrivals is the Poisson distribution.
We have to note that this modeling is most appropriate when the mean value is constant, which is not so during the pandemic, in which the process of MIS-C arrivals is non-stationary. In a post hoc analysis, this Poisson distribution may change its lambda. However, it can still be used to forecast by taking the λ as a parameter in time λ (t) and forecasting its change. Then at every point in time, this distribution can be recalculated, and we can have the expected value and some confidence interval for which the number of arrivals at a given time period will be there with predefined probability (for example, 95% confidence interval).
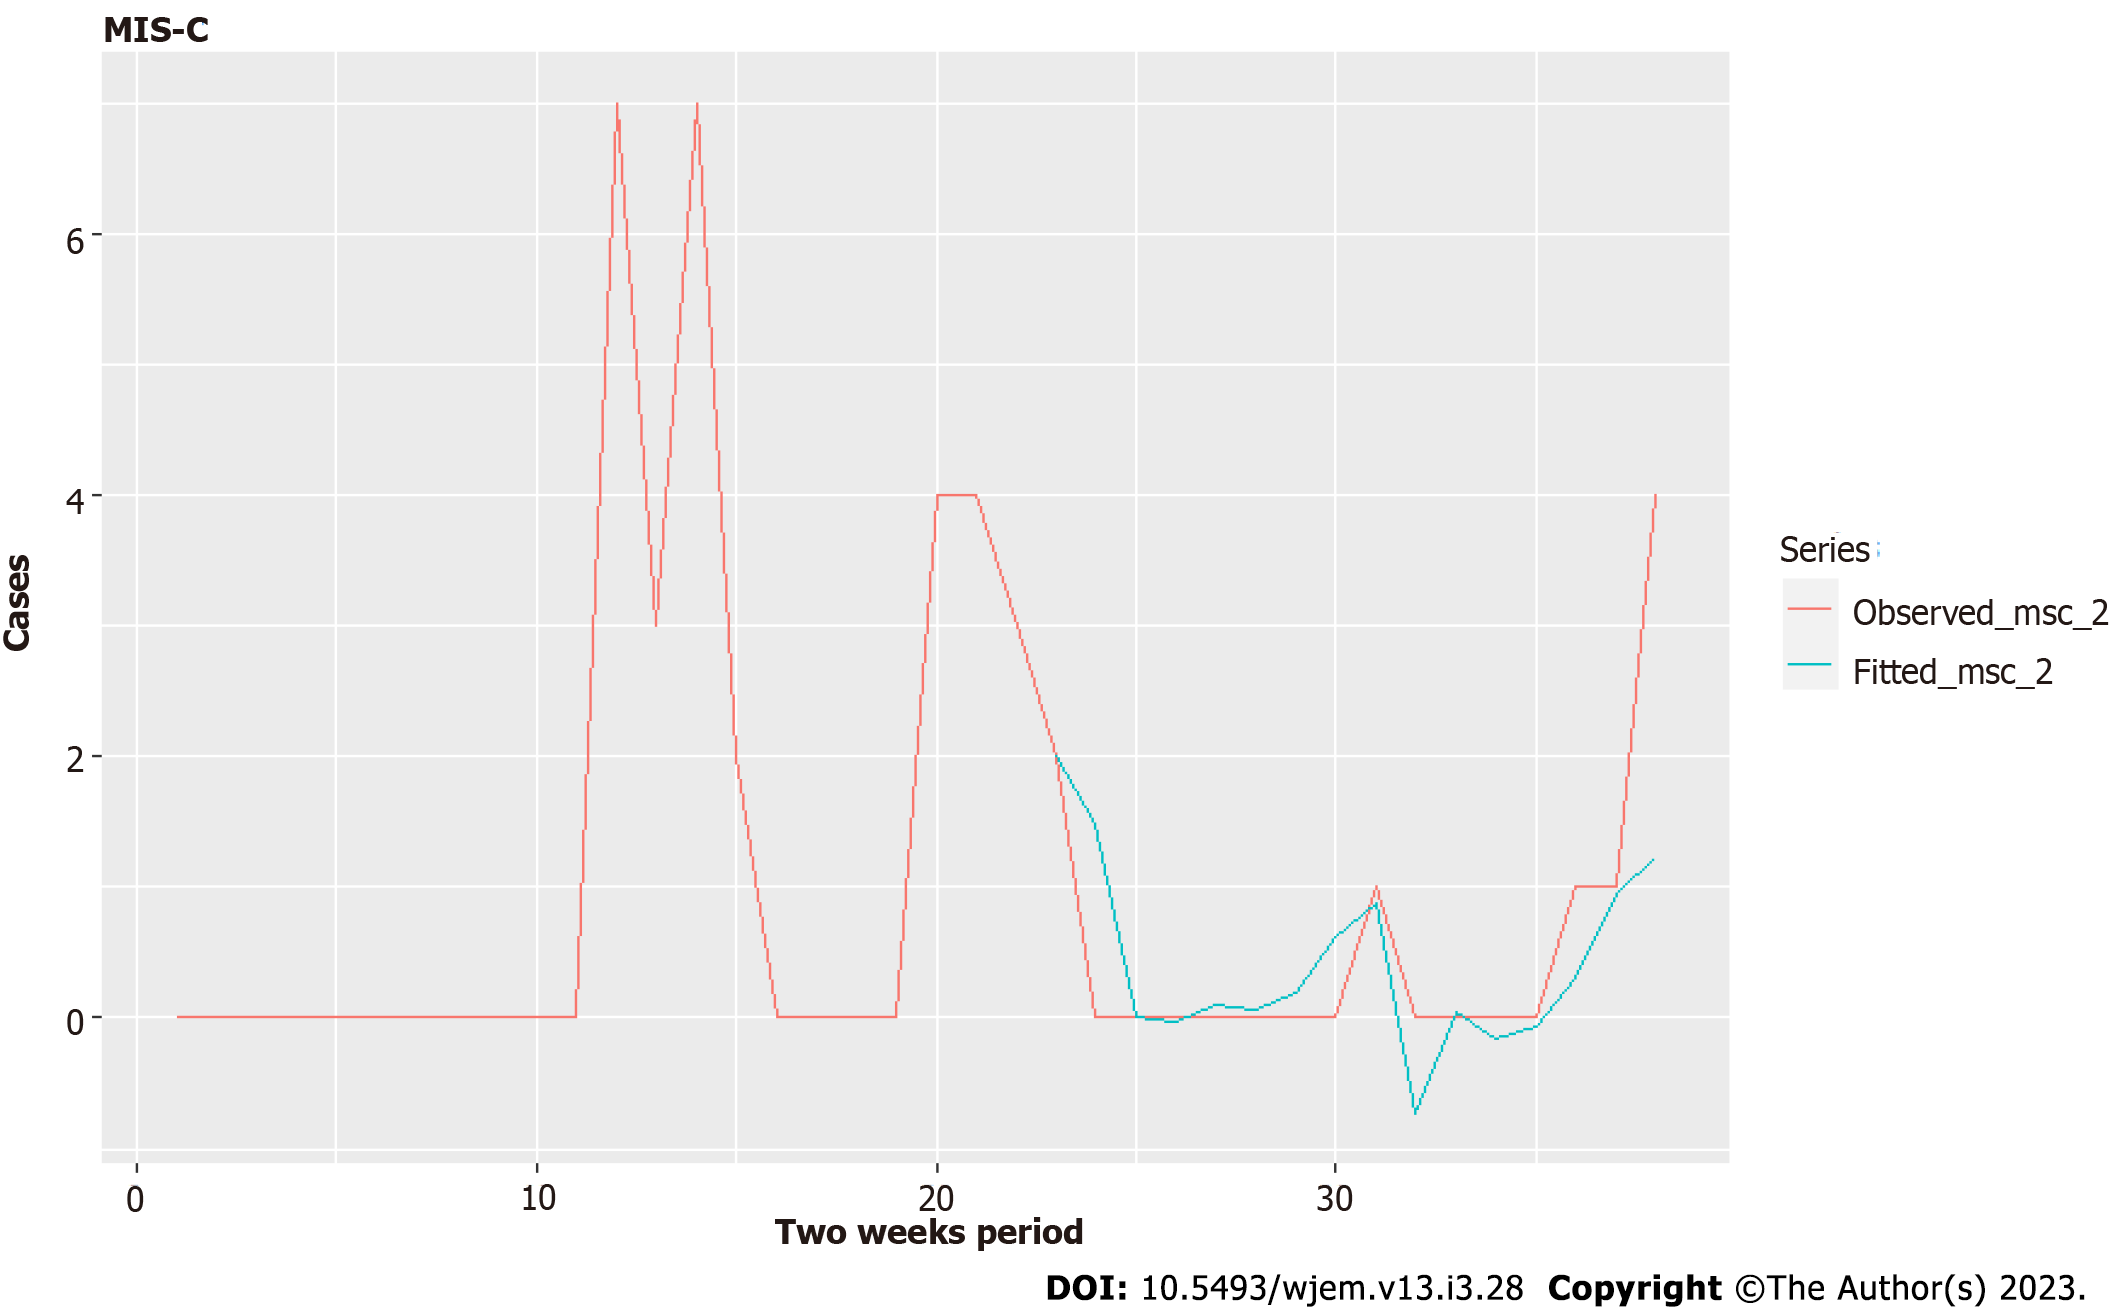
To obtain a model that explains the variation relatively well for this small set of data (39 cases), we grouped both new cases for 0-19 on a national level and MIS-C in one center –the Pediatric department and Pediatric ICU in the main Emergency Hospital in the capital city on a bi-weekly basis. This allowed us to have a good evaluation of the NC L21 parameter (Table 6), which shows the new cases 21 bi-weekly periods ago.
| Model summary | ||
| Coefficient | Estimate | Standard error |
| NC L21 | 0.0016 | 0.0008 |
| NC L22 | -0.0011 | 0.0007 |
| NC L23 | 1e-04 | 7e-04 |
| R2 | N/A | |
| RMSE | 0.8425338 | |
| Bias | N/A | |
| MASE | 0.4601526 | |
In general, the MIS-C cases in Pirogov are 1% of the cases among 0-19, which gives roughly 2%-3% in the respective age group for that disease, which is a subset of 0-19. This is incredibly high compared to the relatively low frequency of MIS-C, as we quoted already. Nevertheless, this can be used to obtain a very rough estimation for the number of children missed by testing if we combine this set with the data from other hospitals in Bulgaria.
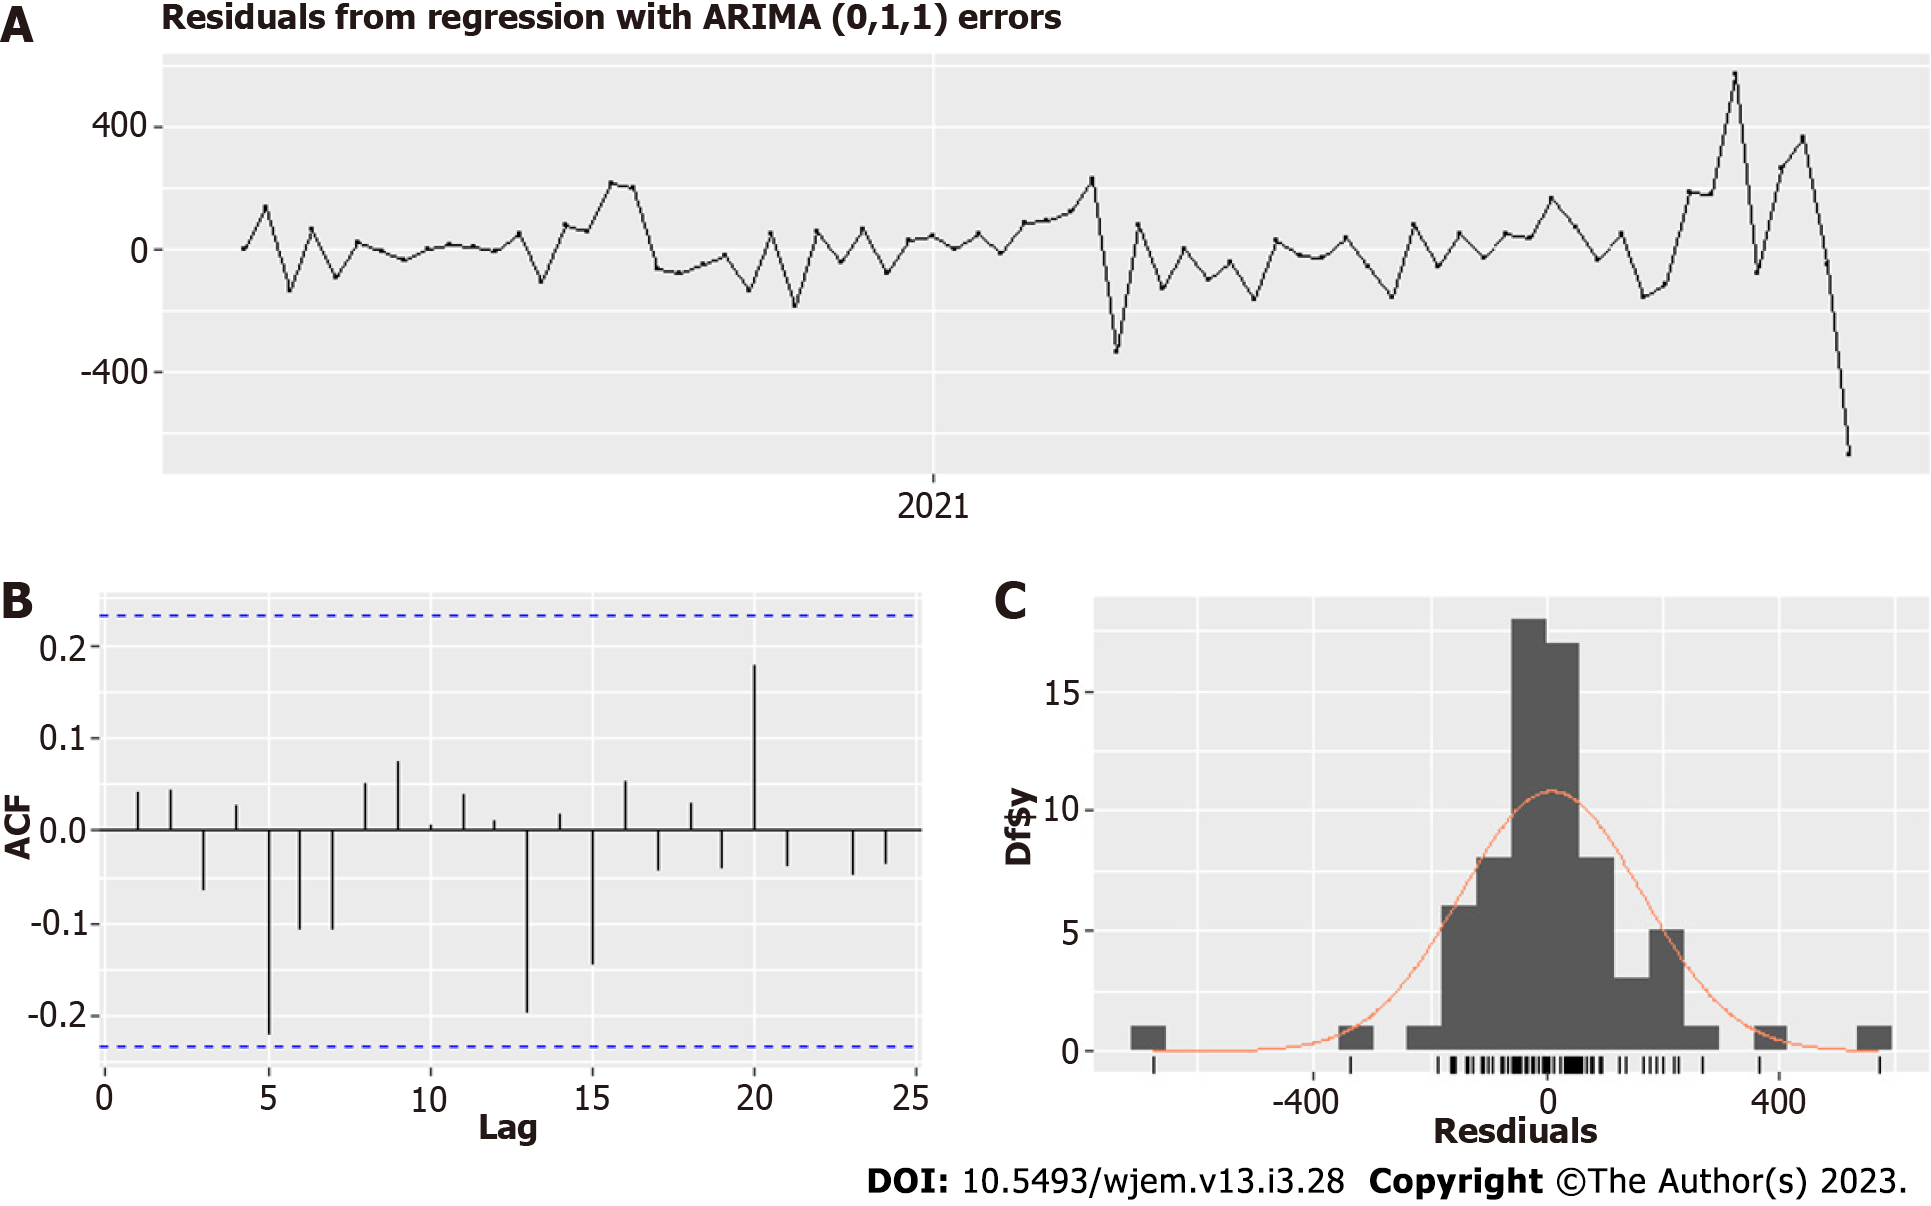
The optimal model is Arima (0,1,1) (Table 2, Figures 5 and 6) and uses school closures with lags of 1 and 2 wk, variants with lag 0 wk and vaccines with a lag of 2 wk. We ensure that the correlation between the four predictors (regressors) is acceptable, as seen in Table 1. The model summary is given in Table II. The residuals are shown in Figure 5, and the model fit – is in Figure 6. A rule of thumb for a good fit is to have an absolute value of a coefficient twice as significant as its standard error.
As Table 2 shows, school closures and vaccines have significant impacts on the spread among children – 0-19 years old age group. Michos et al[28] reported the hospitalization rates of children due to COVID-19 in Greece and the United States[29,30].
In terms of age groups, among > 1.2 million children below 18 years of age with SARS-CoV-2 infection in the USA between March and December 2020, children were distributed as follows: Preschool (age 0 through 4 years)–7.4%; elementary school (age 5 through 10 years)–10.9%; middle school (age 11 through 13 years)–7.9%; high school (age 14 through 17 years)–16.3%. However, in Bulgaria, no such information is available.
Closures decrease significantly the numbers – closure of level 3 falls on average with 310 cases per week or a minimum of 30% reduction of the number of cases. It is a well-estimated coefficient with a standard error of half its value. Close to that proper precision of estimation is the Vaccines factor, which gives 192 cases weekly per 10% of fully vaccinated adults or an overall close to 400 cases per week increase. We see here that this is a probable conclusion – vaccinations of adults accelerate the spread among mostly unvaccinated children.
Despite all issues with data related to the testing of children in Bulgaria, we managed to explain 93% of the variation with our model. With this currently limited data, the role of variants remains unverified due to a relatively high correlation with vaccinations – they have similar dynamics. There is also an accumulation of immunity through prior infection that competes with the variants' tendency to increase rates among children. We may update or change the model accordingly after the Delta and Omicron wave to include more values to the variants factor and to check whether variants accelerate the spread or distinguish it from the vaccination pressure.
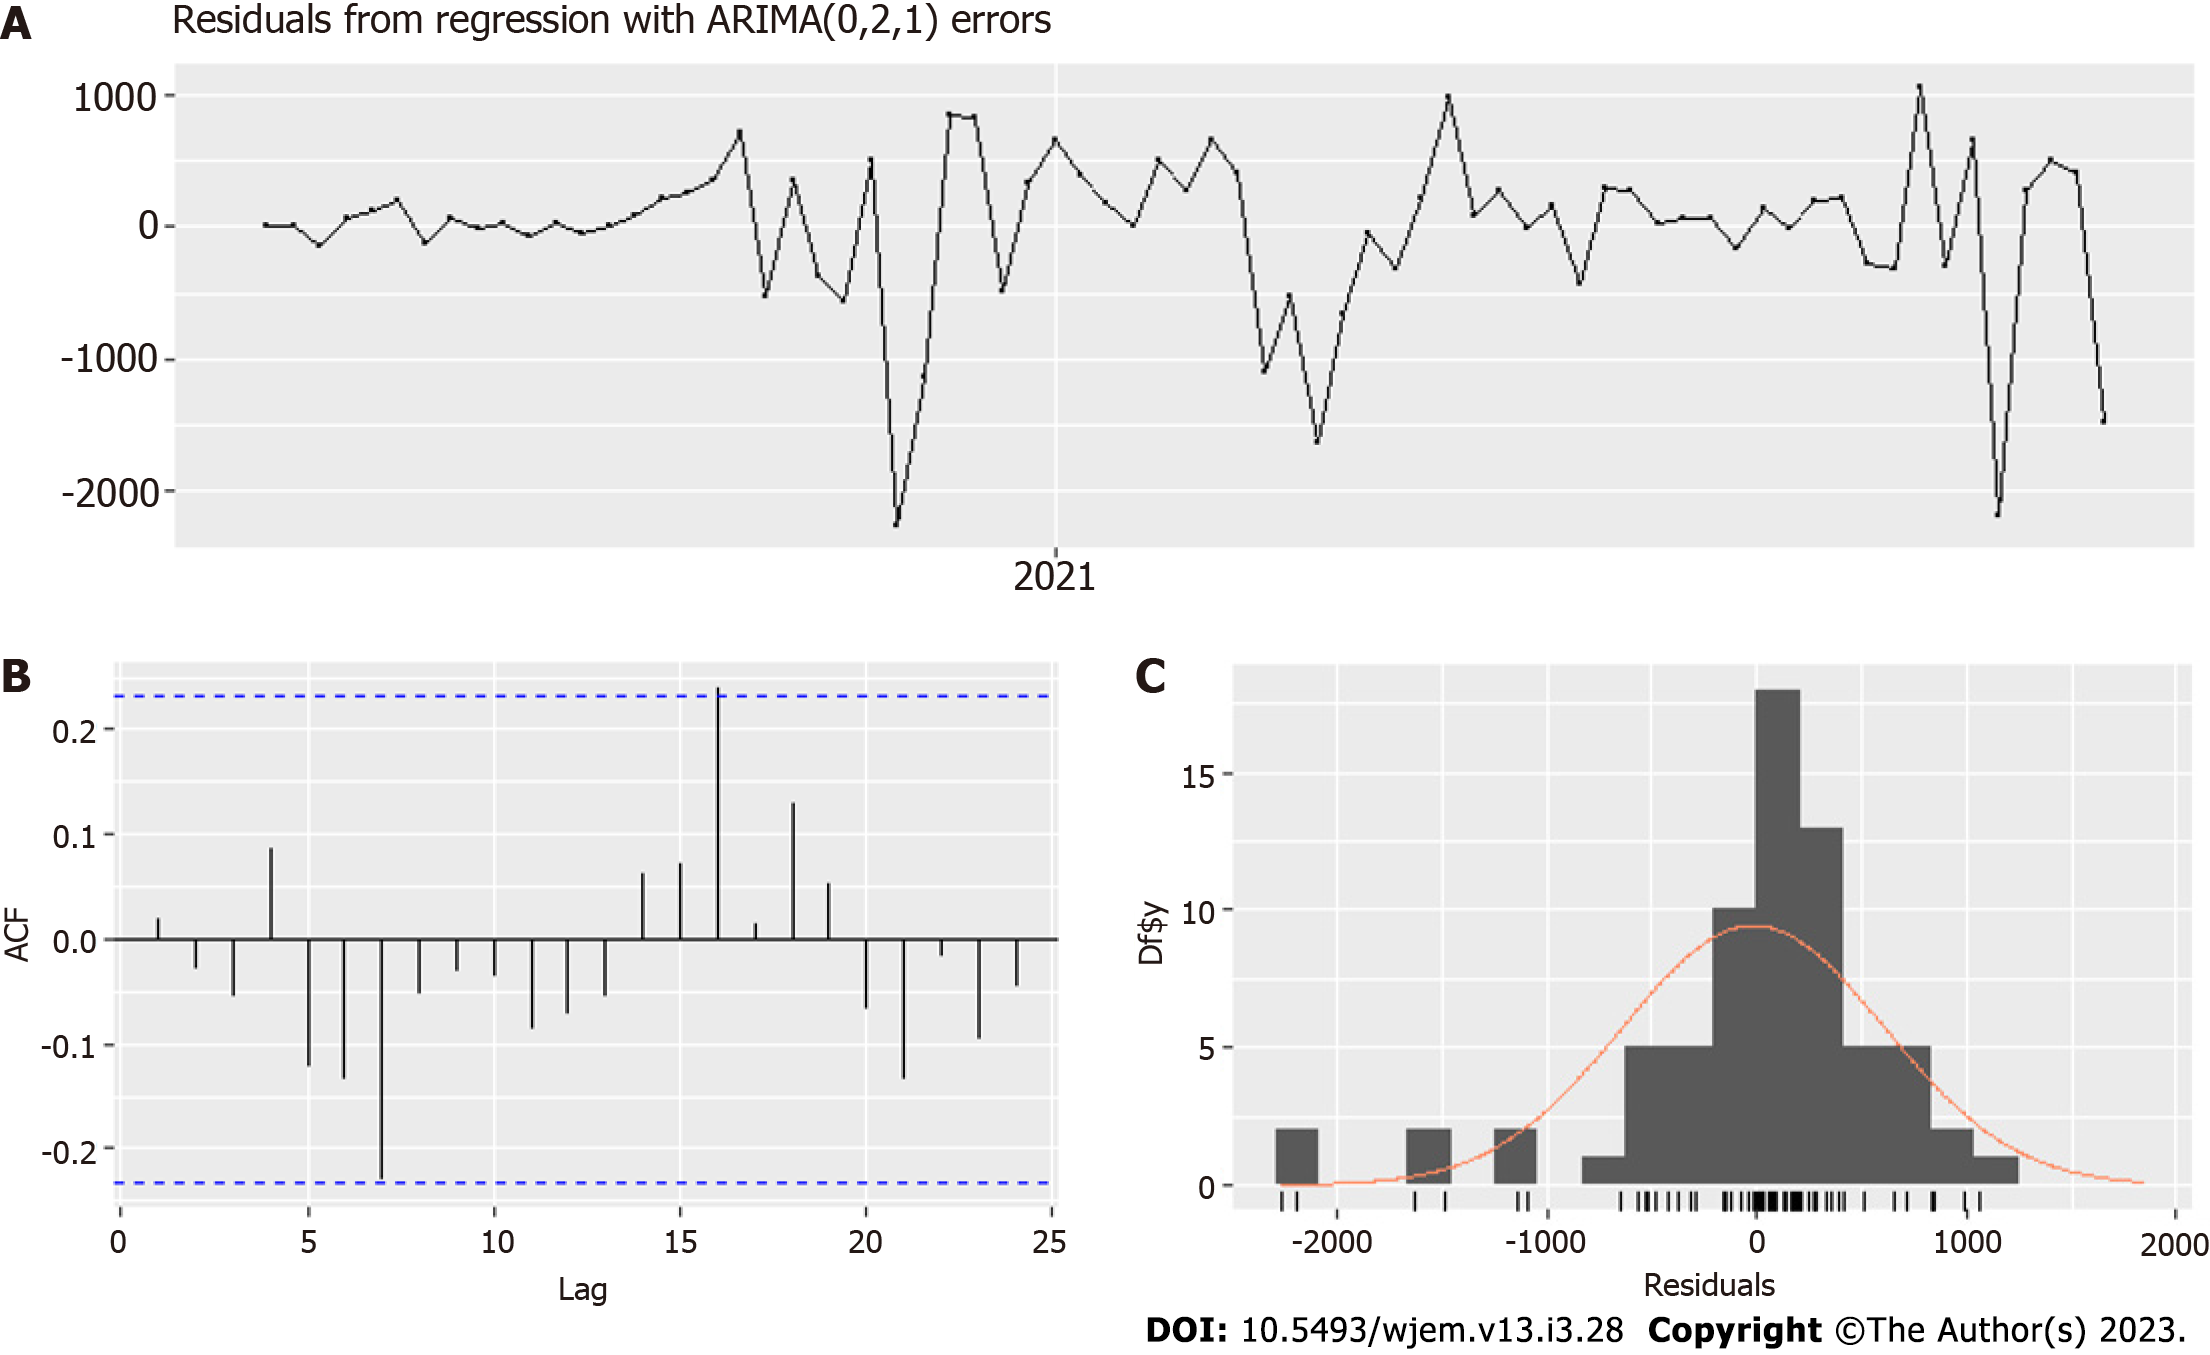
For Model II and the age group of 60-89, the correlations (Table 3) are acceptable, and most of the coefficients are well estimated with small standard error, excluding variants (Table 4). The residuals are shown in Figure 7. The cases in the 0-19 group explain 96.2% of the variation in cases for the 60-89 years group (Figure 8).
The results for Model III showed that the new cases among 0-19 years old with a lag of two weeks are not necessary to predict the dynamics of the age group 20-49, and its removal improved the model. The correlations of this subset of regressors are the same as in Table 2. The model summary is given in Table 5, the residuals are in Figure 9, and the fitted model is in Figure 10.
For the age group of 20-49 years, the influence of vaccinations in accelerating the spread among them is twice as strong – the coefficient in Table 5 is double relative to the same coefficient in Table 4 and with a relatively smaller standard error of estimation, bordering the proper ratio of 2:1 coefficient to error. One part of the explanation is that they are closely linked to children – the coefficient with Lag 1, which corresponds to the household infections is 5 times larger (a household effective reproductive number of 5.73 and the standard error of estimation is ten times smaller, than the error of the same coefficient in the model for 60-80. The ratio of coefficient-to-standard error here jumps from 2:1 to 100:1. The role of the variant becomes probable in this age group – now, the standard error of estimation is smaller than the estimated coefficient. The current insufficient set of 74 observations increases the likelihood of coming to a positive conclusion for variants and spread among young people after the pandemic despite the acquired immunity of prior infections. Such a conclusion is also possible for the 0-19 age group, with a standard error of estimation close to the value of the coefficient, but is less likely for people in the 60-89 age group. It appears that the acceleration in the spread from variants is age dependent. One possible explanation is that with the increase of R0 of the variants, the age groups with more intensive contacts get more "advantage" over other age groups. Another explanation would be a saturation point in age risks from the pathogen – a weaker immune system that lowers the threshold for the effects of virulence (and R0) on the spread. This would mean that from some R0 and above, the spread cannot accelerate further for specific age groups. These hypotheses need further analysis and testing in future research.
Probabilistic modeling is a less precise way to predict or explain the dynamics than the time series analysis approach we employed in this article's first section. The distribution in Figure 11 shows us there is over a 5% chance of having 5 children per week, which gives a wide interval of new beds are needed weekly, and with the non-stationarity of the process, this has to be recalculated every week. With the increase in prevalence among children with new viral variants, it is possible λ(t) to increase further, which means that we need to forecast it to do these recalculations. The estimating procedure will amplify the forecast error (fitting data to the Poisson distribution). Therefore, we prefer the time series analysis approach even for the small number of MIS-C cases.
Results for MIS-C are promising but not yet conclusive. We need larger datasets to which to apply our methodology to have a better prediction on a weekly basis. We consider this an extreme test of our approach – can we model the MIS-C dynamics from such a small set? It appears that we can. In our model, we try to regress the new MIS-C cases against the new cases for the age group 0-19 years (we don't have detailed data by smaller sub-groups for the entire pandemic).
Our model in Table 6 is for biweekly cases. Coefficient NC L21, which is with a lag of one biweekly period, or up to 14 d, is well estimated with a value to standard error 2:1. We have close to good evaluation for NCL22 (which is with a lag of two periods, or up to 4 wk) with ratio 1.58. For a good assessment of NC L23, we need more data. The significant lags allow us to model properly only after half of the period of 78 wk, so we consider these results as promising, not conclusive. However, even with that small data set, we can give some predictions with Model IV (Figures 12 and 13) and some explanation of the data variation. We will continue the effort to model these cases by expanding our dataset in joint research with other hospitals in Bulgaria.
We aimed to assess the role of children in the ongoing epidemic in Bulgaria and to predict the impact of the pandemic on MIS-C cases in Pirogov. The initial claims in the literature that children have no impact and schools do not need strict measures do not hold in our analysis. Furthermore, it is clear that children are drivers of the epidemic in Bulgaria, probably due to the few school measures and no quarantines for their families when a class is quarantined[31].
We were able to predict cases in two age groups that are societally linked to children – 20-49 and 60-89 – parent and grandparents (and their close same-age contacts). Even before modeling, a large lag between cases in children (0-19) and cases in these groups was visible (Figure 1). What brings us more information is the difference between these two groups and the age groups that are less likely to be connected in the same household with children – 50-59 and 90+. As our analysis shows, school closures were a vital part of the containment of previous waves[32,33]. For that reason, not only children with their intense contacts but children via schools were drivers of the pandemic waves up to and including Delta[34]. Although there are summer waves from children to adults (2020 and 2021), they are transient and reflect migrations from cities to villages and tourist destinations, while autumn and winter waves show stable trajectories while schools are opened and turn after the closures – which our model I captured.
We can see some plausible counterintuitive influences of vaccinations on the spread among adults in 60-89 years. It appears to have a strong positive impact, accelerating the spread (of course, for such conclusions, more research is necessary). The standard error of estimation is smaller than the coefficient. It is not small enough to accept the value of the coefficient but enough to give us some confidence about the direction of the influence. The current vaccination policy in Bulgaria, which is not focused on risk groups, does more harm than good since the mortality risk grows exponentially with age[16]. What is the reason? At first glance, the paradoxical negative impact of the vaccination program on increasing the incidence of COVID-19 can be explained by the rapid relaxation of anti-epidemiological measures at a deficit of vaccination coverage. The delay according to the model of the MIS-C case by 1 year is interesting because right now we have such a wave, one year after the previous one."
Furthermore, vaccines accelerate the spread significantly among children, as our first model showed, and as our second model demonstrates, the spread among 60-89 is strongly predicted with lags of 1, 2 and 3 wk from cases in the 0-19 age group. The lack of exponential distribution of vaccinations across age groups (Figure 14) that would match the risk probably leads to a net negative effect on the number of cases among older individuals. Currently, the low vaccination rate translates this negative effect into a negative impact on deaths, which can be estimated from our model for the age-mortality risk. This might change with an increase in vaccination coverage or a change in the distribution of vaccination coverage.
Our modeling and data show with high probability that in Bulgaria, with our current measures, vaccination strategy and contact structure, the pandemic is driven by the children and their contacts in school. This is the simplest explanation of our three models. Furthermore, the lack of vaccination strategy accelerates the spread among children and from them to the age groups linked to them. For a country with low vaccination coverage of 23% up to November 16, 2021, this translates into an increased number of deaths and hospitalizations. There is a possibility of emerging variants to accelerate their spread among people below 50 years, thus compensating for the effect of acquired partial herd immunity, but that has to be confirmed by a larger set of observations and possibly new models to catch precisely the effects of the variants. This hypothesis and the other two we outlined as reasons for this age-restricted acceleration of the spread are part of our future research, as long as updating these three models after the end of the delta wave.
The modeling of MIS-C cases comes with few surprises – first, it is possible to model it with ARIMA even for a very low case amount, only for Pirogov, not on a national level. Suppose we put together all cases in Bulgaria. In that case, we will have a substantially larger dataset and the ability to make practically usable forecasts for MIS-C based on the historical record. Second, the optimal lags for prediction are huge – 41 to 48 wk or 21 to 24 bi-weekly periods. This is due to the low probability of occurrence of MIS-C among children or data artifacts (in which case it will change with a larger dataset). Third, the Poisson distribution can be used for modeling the probability of n cases arriving at a given week, but this is not a surprise, considering the independence of cases from one another in time. A challenge for modeling will be the arrival of new variants such as Delta, Delta+ and Omicron, which can change this probability and make historical data less useful for prediction. For that reason, we need the full dataset of MIS-C to model the dependency between the cases and the variants, which is part of our plan for future research, as well as modeling the network of covid-19 spread across ages in more detail, with more data for 0-19 subgroups (it appeared for first time in 25.09.2021 in the open data portal[35,36] and more elaborate dynamic network models).
Transmission from children to adults was deemed secondary to the transmission from adults to children. After the first big wave in September to December 2020, masks were mandated in grades 5 and above but not enforced, with arguably low adherence, less than the general adherence due to mask removal in breaks between classes.
With starting the pandemic in Bulgaria, children were mostly speared from infection. On the one hand, it was thought that coronavirus disease 2019 (COVID-19) took a mild course in children. On the other hand, the testing was at the lowest rate among children. Up to now, the total number of infected children (0-18 years) is 103743.
We aimed to demonstrate the role of children in the COVID-19 spread in Bulgaria and to test the hypothesis that there are no secondary transmissions in schools and from children to adults.
We used ARIMA models with external regressors and Poisson distribution modeling to test our hypotheses.
Our models allows to predict the new weekly cases in different age groups from the new cases in children one and two week prior. The age groups 50-59 and 90+ are less predictable and are also more isolated from children, consistent with the idea that children drive the pandemic in Bulgaria.
Our models support the hypothesis that children are drivers of the pandemic in Bulgaria.
In the first year of the pandemic it was suggested that children rarely transmit the virus to adults. On this basis Bulgarian Ministry of Health decided to allow the parents of quarantined children to continue to work and move freely in society. We will use more sophisticated models such as branching process to demonstrate that even if the probability of infection from children to adults is very low, the free movement of the parents will still trigger a pandemic wave.
Provenance and peer review: Invited article; Externally peer reviewed.
Peer-review model: Single blind
Specialty type: Statistics and probability
Country/Territory of origin: Bulgaria
Peer-review report’s scientific quality classification
Grade A (Excellent): 0
Grade B (Very good): B, B
Grade C (Good): 0
Grade D (Fair): 0
Grade E (Poor): 0
P-Reviewer: Fabbri N, Italy; Taghizadeh-Hesary F, Iran S-Editor: Liu JH L-Editor: A P-Editor: Ju JL
| 1. | Kendall EK, Olaker VR, Kaelber DC, Xu R, Davis PB. Association of SARS-CoV-2 Infection With New-Onset Type 1 Diabetes Among Pediatric Patients From 2020 to 2021. JAMA Netw Open. 2022;5:e2233014. [RCA] [PubMed] [DOI] [Full Text] [Full Text (PDF)] [Cited by in Crossref: 18] [Cited by in RCA: 79] [Article Influence: 26.3] [Reference Citation Analysis (0)] |
| 2. | Heiss R, Tan L, Schmidt S, Regensburger AP, Ewert F, Mammadova D, Buehler A, Vogel-Claussen J, Voskrebenzev A, Rauh M, Rompel O, Nagel AM, Lévy S, Bickelhaupt S, May MS, Uder M, Metzler M, Trollmann R, Woelfle J, Wagner AL, Knieling F. Pulmonary Dysfunction after Pediatric COVID-19. Radiology. 2023;306:e221250. [RCA] [PubMed] [DOI] [Full Text] [Full Text (PDF)] [Cited by in Crossref: 6] [Cited by in RCA: 46] [Article Influence: 23.0] [Reference Citation Analysis (0)] |
| 3. | National Institutes of Health. Accessed [12-18-2022]. Available from: https://www.covid19treatmentguidelines.nih.gov/. |
| 4. | Lazova S, Alexandrova T, Gorelyova-Stefanova N, Atanasov K, Tzotcheva I, Velikova T. Liver Involvement in Children with COVID-19 and Multisystem Inflammatory Syndrome: A Single-Center Bulgarian Observational Study. Microorganisms. 2021;9. [RCA] [PubMed] [DOI] [Full Text] [Full Text (PDF)] [Cited by in Crossref: 18] [Cited by in RCA: 13] [Article Influence: 3.3] [Reference Citation Analysis (0)] |
| 5. | Atanasov K, Gorelyova-Stefanova N, Tsocheva I, Psederski Hr, Lazova Sn. Disease spectrum in children with multisystemic inflammatory syndrome (MIS-C) - clinical case, Emergency Medicine, 2021. Last access on May 16, 2023. Available from: https://pirogov.eu/bg/download/2419. |
| 6. | Ganev B, Lazova S, Genova K, Tzotcheva I. Clinical variants of cardiovascular involvement in sars-cov-2 associated multisystem inflammatory syndrome in children - a case series, electronic presentation, XV National Pediatric Congress, Borovets, 2021. |
| 7. | Dasheva A, Telcharova A, Ganeva M, Stefanov S, Vasileva Z, Nenova K, Kaneva A, Genova K. Multisystemic inflammatory syndrome in children and acute myocarditis after SARS-CoV-2 - description of 6 cases and literature review, Pediatriа, issue 3, 2021. |
| 8. | Rakhsha A, Azghandi S, Taghizadeh-Hesary F. COVID-19 pandemic and patients with cancer: The protocol of a Clinical Oncology center in Tehran, Iran. Rep Pract Oncol Radiother. 2020;25:765-767. [RCA] [PubMed] [DOI] [Full Text] [Full Text (PDF)] [Cited by in Crossref: 19] [Cited by in RCA: 19] [Article Influence: 3.8] [Reference Citation Analysis (0)] |
| 9. | Rakhsha A, Azghandi S, Taghizadeh-Hesary F. Decision on Chemotherapy Amidst COVID-19 Pandemic: a Review and a Practical Approach from Iran. Infect Chemother. 2020;52:496-502. [RCA] [PubMed] [DOI] [Full Text] [Full Text (PDF)] [Cited by in Crossref: 22] [Cited by in RCA: 20] [Article Influence: 4.0] [Reference Citation Analysis (0)] |
| 10. | Li X, Wang W, Yan S, Zhao W, Xiong H, Bao C, Chen J, Yue Y, Su Y, Zhang C. Drug-induced liver injury in COVID-19 treatment: Incidence, mechanisms and clinical management. Front Pharmacol. 2022;13:1019487. [RCA] [PubMed] [DOI] [Full Text] [Cited by in Crossref: 1] [Cited by in RCA: 2] [Article Influence: 0.7] [Reference Citation Analysis (0)] |
| 11. | Heavey L, Casey G, Kelly C, Kelly D, McDarby G. No evidence of secondary transmission of COVID-19 from children attending school in Ireland, 2020. Euro Surveill. 2020;25. [RCA] [PubMed] [DOI] [Full Text] [Full Text (PDF)] [Cited by in Crossref: 173] [Cited by in RCA: 172] [Article Influence: 34.4] [Reference Citation Analysis (0)] |
| 12. | Tang JW. SARS-CoV-2 and aerosols-Arguing over the evidence. J Virol Methods. 2021;289:114033. [RCA] [PubMed] [DOI] [Full Text] [Full Text (PDF)] [Cited by in Crossref: 3] [Cited by in RCA: 5] [Article Influence: 1.0] [Reference Citation Analysis (0)] |
| 13. | Ministry of Education and Science, Order RD09-3310/ November 18, 2020. Available from: https://www.mon.bg/upload/24492/zap3310_maski_18112020.pdf. |
| 14. | Badillo-Goicoechea E, Chang TH, Kim E, LaRocca S, Morris K, Deng X, Chiu S, Bradford A, Garcia A, Kern C, Cobb C, Kreuter F, Stuart EA. Global trends and predictors of face mask usage during the COVID-19 pandemic. BMC Public Health. 2021;21:2099. [RCA] [PubMed] [DOI] [Full Text] [Full Text (PDF)] [Cited by in Crossref: 11] [Cited by in RCA: 61] [Article Influence: 15.3] [Reference Citation Analysis (0)] |
| 15. | United informative portal. Accessed January 4, 2023. Available from: https://coronavirus.bg/bg/statistika. |
| 16. | Tomov, Tchorbadjieff and Angelov, 2021, Age-specific mortality risk from Covid-19 in Bulgaria, Computer Science and Education in Computer Science, (accepted), [DOI: 10. 13140/RG.2.2.26678.01600/1] Last access on May 16, 2023. Available from: https://www.researchgate.net/publication/356420373_Epidemiology_of_COVID-19_spread_in_Bulgaria. |
| 17. | Delamater PL, Street EJ, Leslie TF, Yang YT, Jacobsen KH. Complexity of the Basic Reproduction Number (R(0)). Emerg Infect Dis. 2019;25:1-4. [RCA] [PubMed] [DOI] [Full Text] [Full Text (PDF)] [Cited by in Crossref: 483] [Cited by in RCA: 454] [Article Influence: 75.7] [Reference Citation Analysis (0)] |
| 18. | Edridge AWD, Kaczorowska J, Hoste ACR, Bakker M, Klein M, Loens K, Jebbink MF, Matser A, Kinsella CM, Rueda P, Ieven M, Goossens H, Prins M, Sastre P, Deijs M, van der Hoek L. Seasonal coronavirus protective immunity is short-lasting. Nat Med. 2020;26:1691-1693. [RCA] [PubMed] [DOI] [Full Text] [Cited by in Crossref: 475] [Cited by in RCA: 530] [Article Influence: 106.0] [Reference Citation Analysis (0)] |
| 19. | Covid-19, Unified National Portal. (last accessed on November 12, 2022. Available from: http://www.coronavirus.bg. |
| 20. | Report for genomic surveillance from 16.08.2021, National Centre for Infectious and Parasitic diseases, (last accessed on October 24 2022). Available from: https://www.ncipd.org/index.php?option=com_k2&view=item&id=627:ncov-sequencing-03082021&lang=bg. |
| 21. | COVID-19 government response tracker. Available from: https://covidtracker.bsg.ox.ac.uk/ (last accessed on November 8 2021. |
| 22. | Kwiatkowski D, Phillips PCB, Schmidt P, Shin Y. Testing the null hypothesis of stationarity against the alternative of a unit root: How sure are we that economic time series have a unit root? Journal of Econometrics. 1992;54:159-178. [DOI] [Full Text] |
| 23. | Dickey DA and Fuller WA. "Distribution of the Estimators for Autoregressive Time Series with a Unit Root". Journal of the American Statistical Association. 1979;74:427-431. [RCA] [DOI] [Full Text] [Cited by in Crossref: 3418] [Cited by in RCA: 611] [Article Influence: 13.3] [Reference Citation Analysis (0)] |
| 24. | Hyndman RJ, Khandakar Y. "Automatic time series forecasting: The forecast package for R". Journal of Statistical Software. 2008;26. [RCA] [DOI] [Full Text] [Cited by in Crossref: 1117] [Cited by in RCA: 1116] [Article Influence: 65.6] [Reference Citation Analysis (0)] |
| 25. | Brandenburg A. Piecewise quadratic growth during the 2019 novel coronavirus epidemic. Infect Dis Model. 2020;5:681-690. [RCA] [PubMed] [DOI] [Full Text] [Full Text (PDF)] [Cited by in Crossref: 16] [Cited by in RCA: 17] [Article Influence: 3.4] [Reference Citation Analysis (0)] |
| 26. | Consiglio CR, Cotugno N, Sardh F, Pou C, Amodio D, Rodriguez L, Tan Z, Zicari S, Ruggiero A, Pascucci GR, Santilli V, Campbell T, Bryceson Y, Eriksson D, Wang J, Marchesi A, Lakshmikanth T, Campana A, Villani A, Rossi P; CACTUS Study Team, Landegren N, Palma P, Brodin P. The Immunology of Multisystem Inflammatory Syndrome in Children with COVID-19. Cell. 2020;183:968-981.e7. [RCA] [PubMed] [DOI] [Full Text] [Full Text (PDF)] [Cited by in Crossref: 679] [Cited by in RCA: 653] [Article Influence: 130.6] [Reference Citation Analysis (0)] |
| 27. | Payne AB, Gilani Z, Godfred-Cato S, Belay ED, Feldstein LR, Patel MM, Randolph AG, Newhams M, Thomas D, Magleby R, Hsu K, Burns M, Dufort E, Maxted A, Pietrowski M, Longenberger A, Bidol S, Henderson J, Sosa L, Edmundson A, Tobin-D'Angelo M, Edison L, Heidemann S, Singh AR, Giuliano JS Jr, Kleinman LC, Tarquinio KM, Walsh RF, Fitzgerald JC, Clouser KN, Gertz SJ, Carroll RW, Carroll CL, Hoots BE, Reed C, Dahlgren FS, Oster ME, Pierce TJ, Curns AT, Langley GE, Campbell AP; MIS-C Incidence Authorship Group, Balachandran N, Murray TS, Burkholder C, Brancard T, Lifshitz J, Leach D, Charpie I, Tice C, Coffin SE, Perella D, Jones K, Marohn KL, Yager PH, Fernandes ND, Flori HR, Koncicki ML, Walker KS, Di Pentima MC, Li S, Horwitz SM, Gaur S, Coffey DC, Harwayne-Gidansky I, Hymes SR, Thomas NJ, Ackerman KG, Cholette JM. Incidence of Multisystem Inflammatory Syndrome in Children Among US Persons Infected With SARS-CoV-2. JAMA Netw Open. 2021;4:e2116420. [RCA] [PubMed] [DOI] [Full Text] [Cited by in Crossref: 179] [Cited by in RCA: 276] [Article Influence: 69.0] [Reference Citation Analysis (0)] |
| 28. | Michos A, Savvidou P, Syridou G, Eleftheriou E, Iosifidis E, Grivea I, Spoulou V, Galanakis E, Syrogiannopoulos G, Tsolia M, Roilides E, Papaevangelou V. SARS-CoV-2 molecular testing in Greek hospital paediatric departments: a nationwide study. Epidemiol Infect. 2021;149:e70. [RCA] [PubMed] [DOI] [Full Text] [Full Text (PDF)] [Cited by in Crossref: 1] [Cited by in RCA: 3] [Article Influence: 0.8] [Reference Citation Analysis (0)] |
| 29. | Nikolopoulou GB, Maltezou HC. COVID-19 in Children: Where do we Stand? Arch Med Res. 2022;53:1-8. [RCA] [PubMed] [DOI] [Full Text] [Full Text (PDF)] [Cited by in Crossref: 46] [Cited by in RCA: 150] [Article Influence: 50.0] [Reference Citation Analysis (0)] |
| 30. | Leidman E, Duca LM, Omura JD, Proia K, Stephens JW, Sauber-Schatz EK. COVID-19 Trends Among Persons Aged 0-24 Years - United States, March 1-December 12, 2020. MMWR Morb Mortal Wkly Rep. 2021;70:88-94. [RCA] [PubMed] [DOI] [Full Text] [Full Text (PDF)] [Cited by in Crossref: 111] [Cited by in RCA: 155] [Article Influence: 38.8] [Reference Citation Analysis (0)] |
| 31. | Ministry of health – What parents should know for their children who go to school. Available from: https://www.mh.government.bg/bg/novini/aktualno/kakvo-tryabva-da-znayat-roditelite-na-deca-posesha/ - last accessed at 15th of January 2022. |
| 32. | Tomov LP, Velikova TV, Batselova HM. Health risk management in kindergartens, schools and universities, during COVID-19 pandemic: a heuristic framework. American International Journal of Biology and Life Sciences. 2021;3:40-43. [DOI] [Full Text] |
| 33. | Georgiev DS, Batselova HM, Kotsev SV, Velikova TV. Reopening of Schools in Bulgaria during COVID-19 Pandemic: 2021 Edition. Int J Adv Res MicroBiol Immunol. 2020;2:20-21. |
| 34. | Tomov LP, Batselova HM, Velikova TV. COVID-19 Delta Wave Caused Early Overburden of Hospital Capacity in the Bulgarian Healthcare System in 2021. Healthcare (Basel). 2022;10. [RCA] [PubMed] [DOI] [Full Text] [Full Text (PDF)] [Cited by in Crossref: 5] [Reference Citation Analysis (0)] |
| 35. | Population by statistical regions, age, place of residence and sex. Data for demographics for 2020. Available from: https://www.nsi.bg/en/content/2977/population-statistical-regions-age-place-residence-and-sex. |
| 36. | Portal for open data. Available from: https://data.egov.bg/covid-19?section=8&subsection=16&item=36. |


