Copyright
©2014 Baishideng Publishing Group Inc.
World J Exp Med. Aug 20, 2014; 4(3): 38-45
Published online Aug 20, 2014. doi: 10.5493/wjem.v4.i3.38
Published online Aug 20, 2014. doi: 10.5493/wjem.v4.i3.38
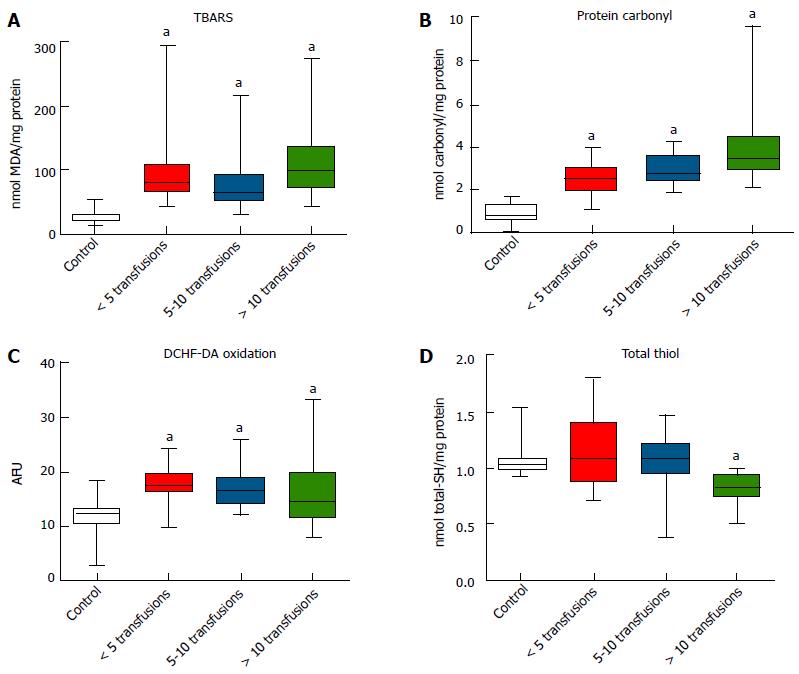
Figure 1 Oxidative stress markers in transfusion patients.
A: Thiobarbituric acid-reactive substances (TBARS); B: Protein carbonyl; C: 2’,7’-dichlorodihydrofluorescein diacetate (DCHF-DA) oxidation; and D: Total thiol levels in controls (n = 15), those receiving < 5 transfusions (n = 14), 5-10 transfusions (n = 11), and > 10 transfusions (n = 14); aP < 0.05 vs controls.
Figure 2 Antioxidant enzymes in transfusion patients.
A: Catalase (CAT) activity; B: Superoxide dismutase (SOD) activity; and C: Glutathione peroxidase (GPx) activity in controls (n = 15), those receiving < 5 transfusions (n = 14), 5-10 transfusions (n = 11), and > 10 transfusions (n = 14); aP < 0.05 vs controls.
- Citation: Fernandes MS, Rissi TT, Zuravski L, Mezzomo J, Vargas CR, Folmer V, Soares FAA, Manfredini V, Ahmed M, Puntel RL. Oxidative stress and labile plasmatic iron in anemic patients following blood therapy. World J Exp Med 2014; 4(3): 38-45
- URL: https://www.wjgnet.com/2220-315X/full/v4/i3/38.htm
- DOI: https://dx.doi.org/10.5493/wjem.v4.i3.38


