Copyright
©2013 Baishideng.
World J Exp Med. Feb 20, 2013; 3(1): 11-20
Published online Feb 20, 2013. doi: 10.5493/wjem.v3.i1.11
Published online Feb 20, 2013. doi: 10.5493/wjem.v3.i1.11
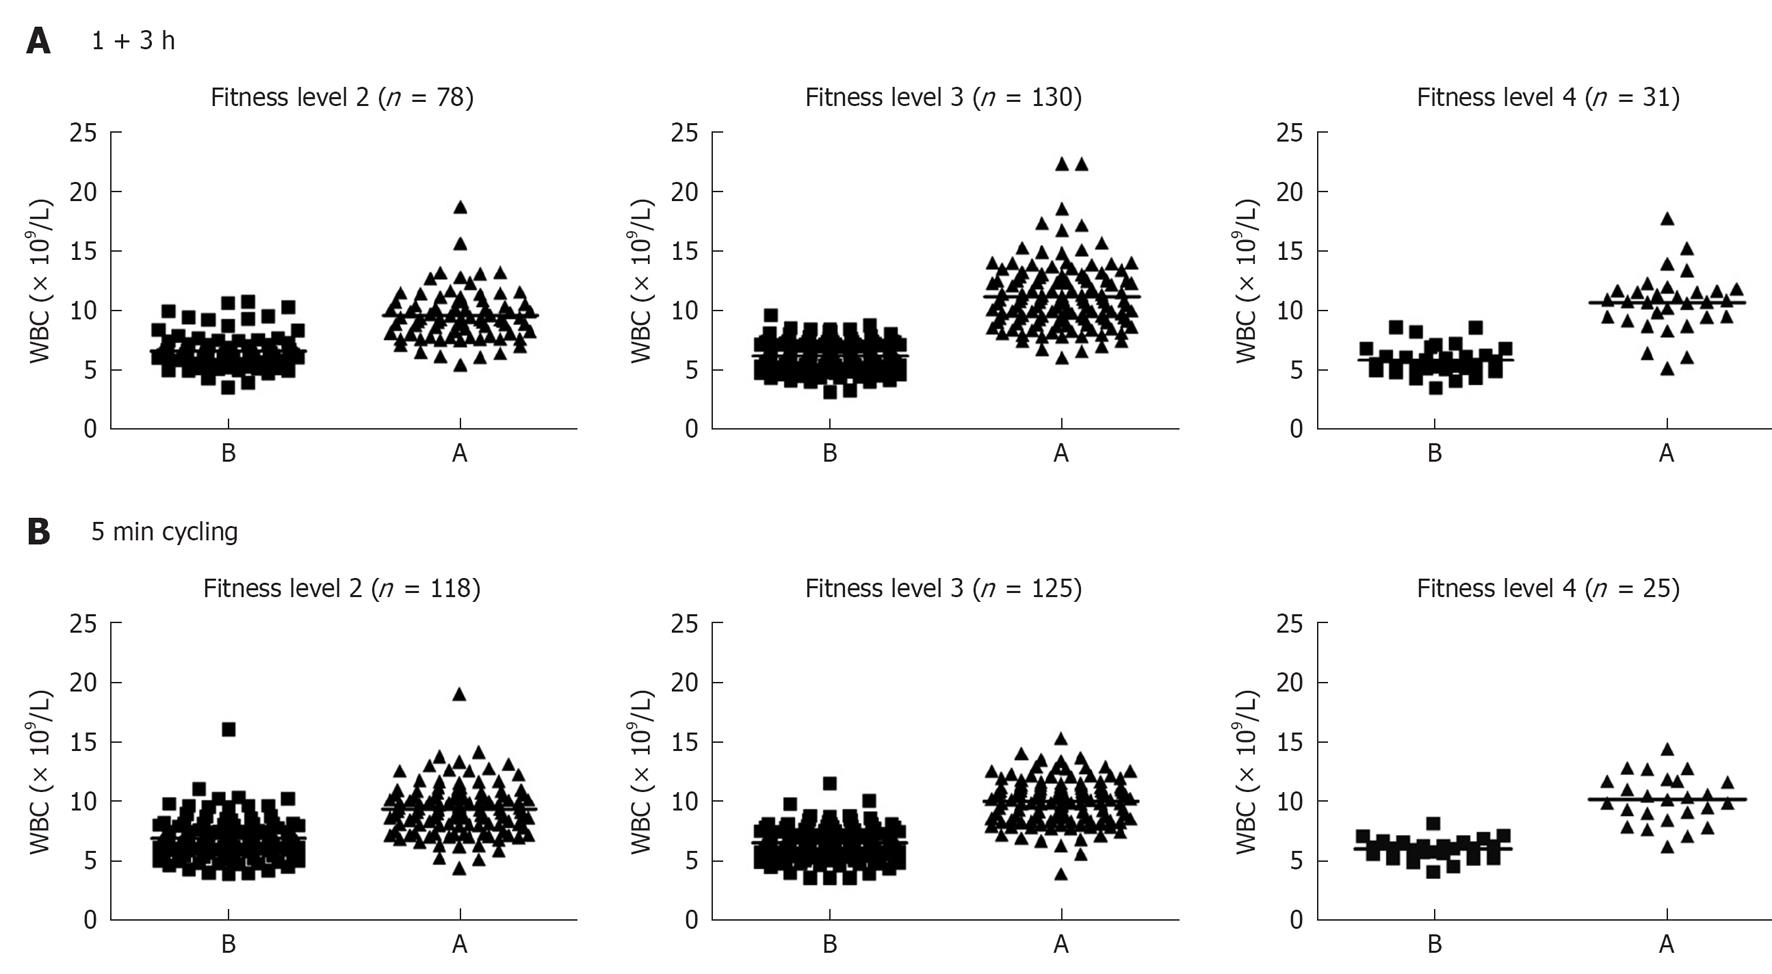
Figure 1 Fitness levels of individuals involved in this study.
The numbers of white blood cells (WBCs) were counted according to the fitness levels of individuals (levels 1-4 from low to high intensity) in each group (those that run for 1 h and then rested for 3 h, and those that cycled for 5 min). The numbers of individuals in each category are shown. Also shown the numbers of WBCs before and after exercise. B: Before; A: After.
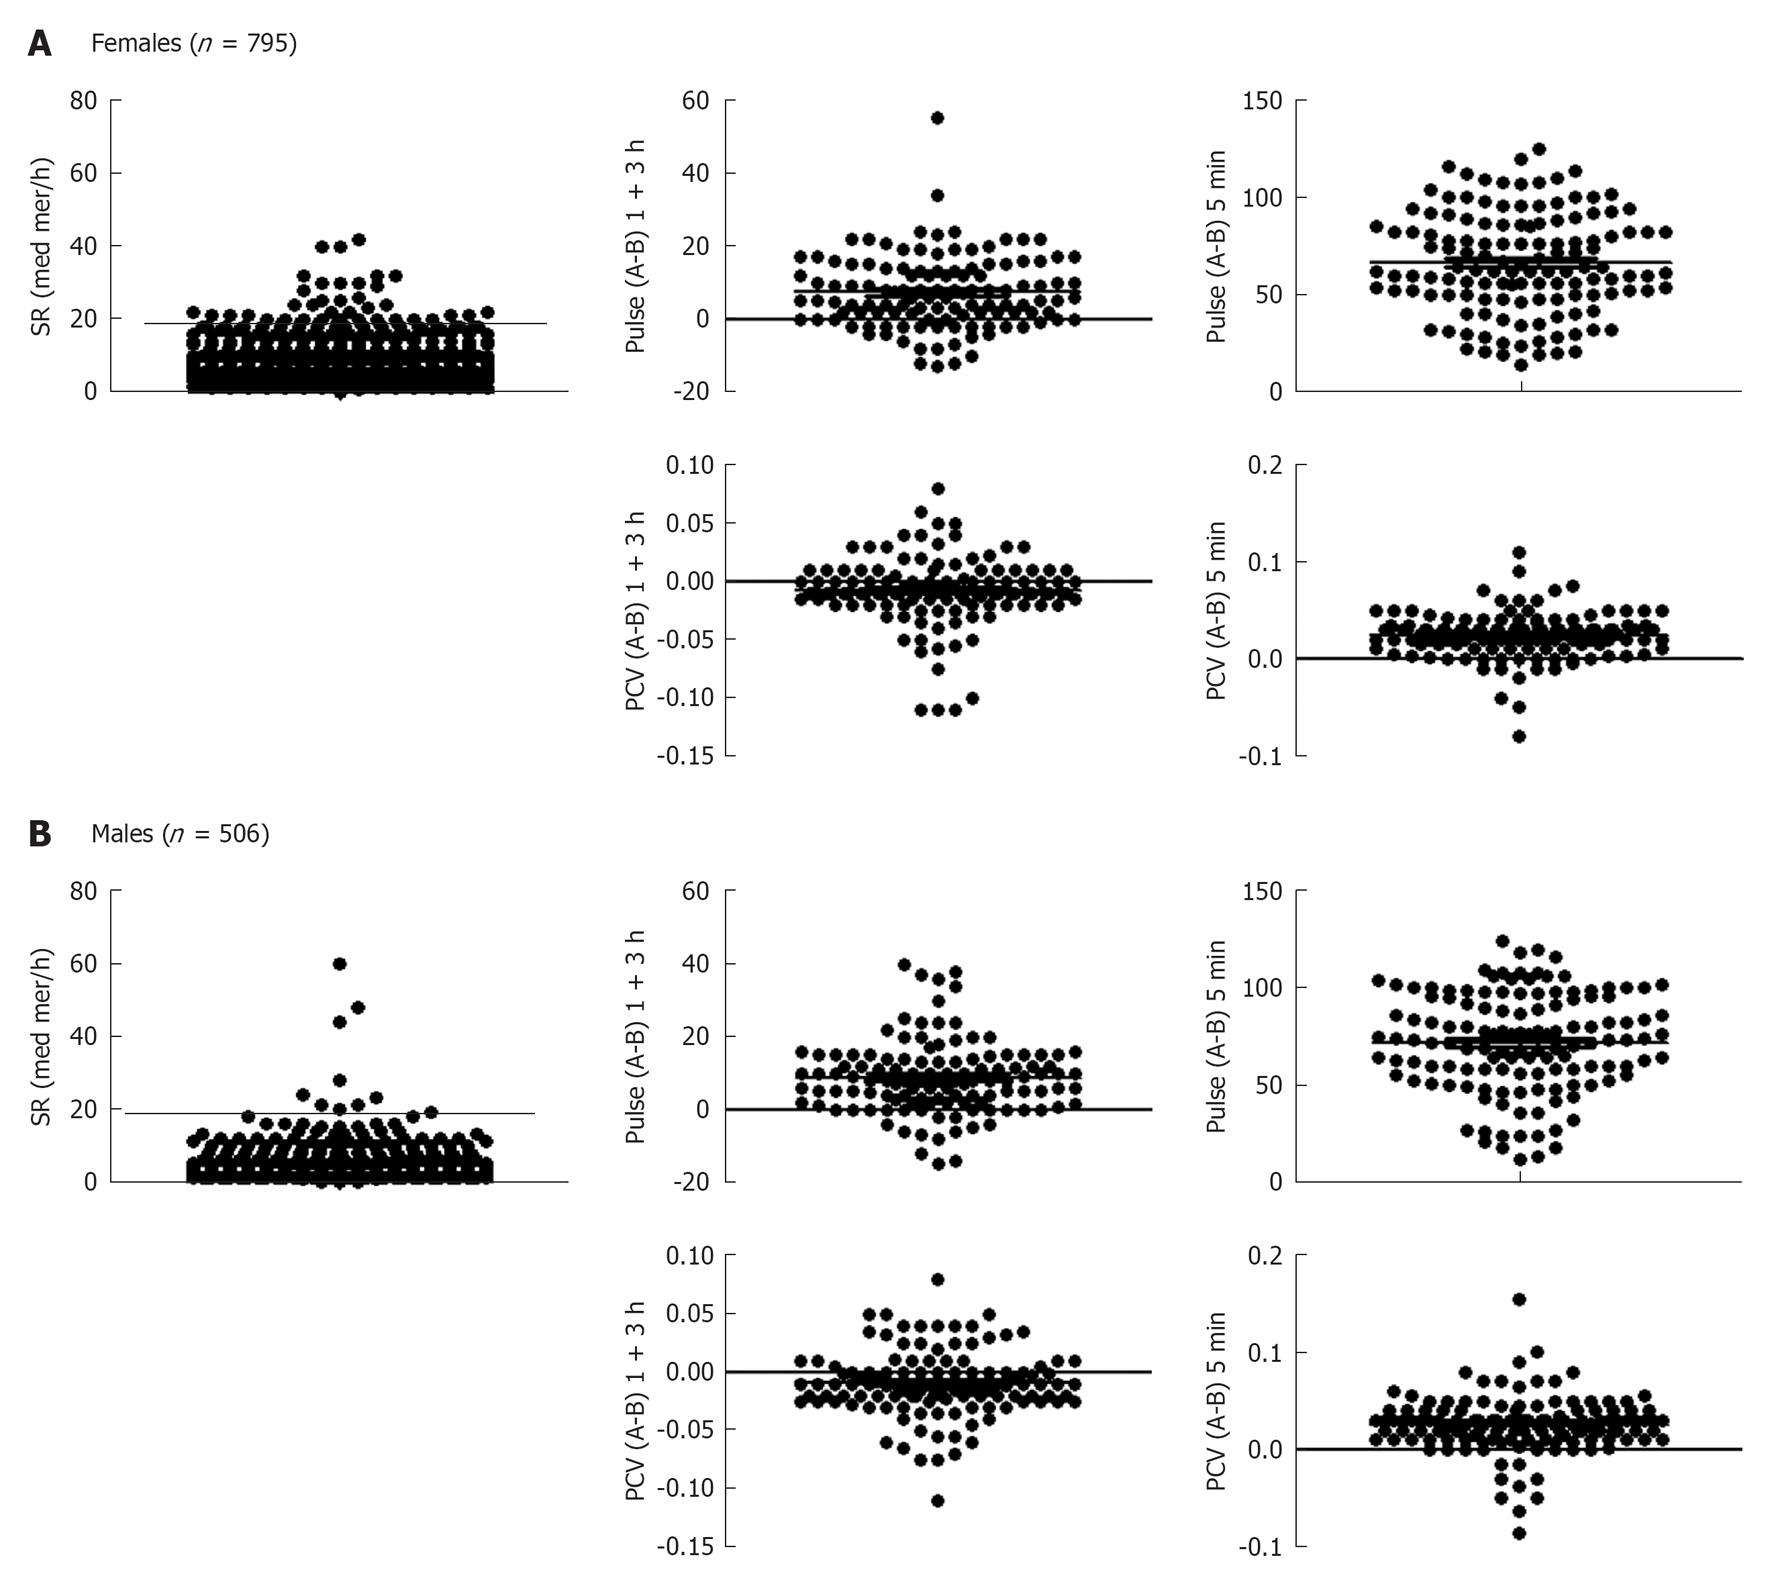
Figure 2 Evaluation of blood and hearts.
A: Sedimentation rate (SR) was measured in 795 female students (age 19-44 years, average 23 years old). Females with SR more than 20 mm/h were excluded from the evaluation (above the thick line). Packed cell volume (PCV) and heart rate (pulse) changes were calculated after exercise minus before exercise in 120 females who run or skied for 1 h and then rested for 3 h (1+3 h). PCV and pulse were also measured in about 135 females who exercised for 5 min at a maximum intensity; B: This is similar to Panel A except that 506 males were examined for SR; those that have more than 15 mm/h were excluded (above the thick line). Lines in the other panels show the PCV or pulse after minus before exercise. Each dot represents one individual. B: Before; A: After.
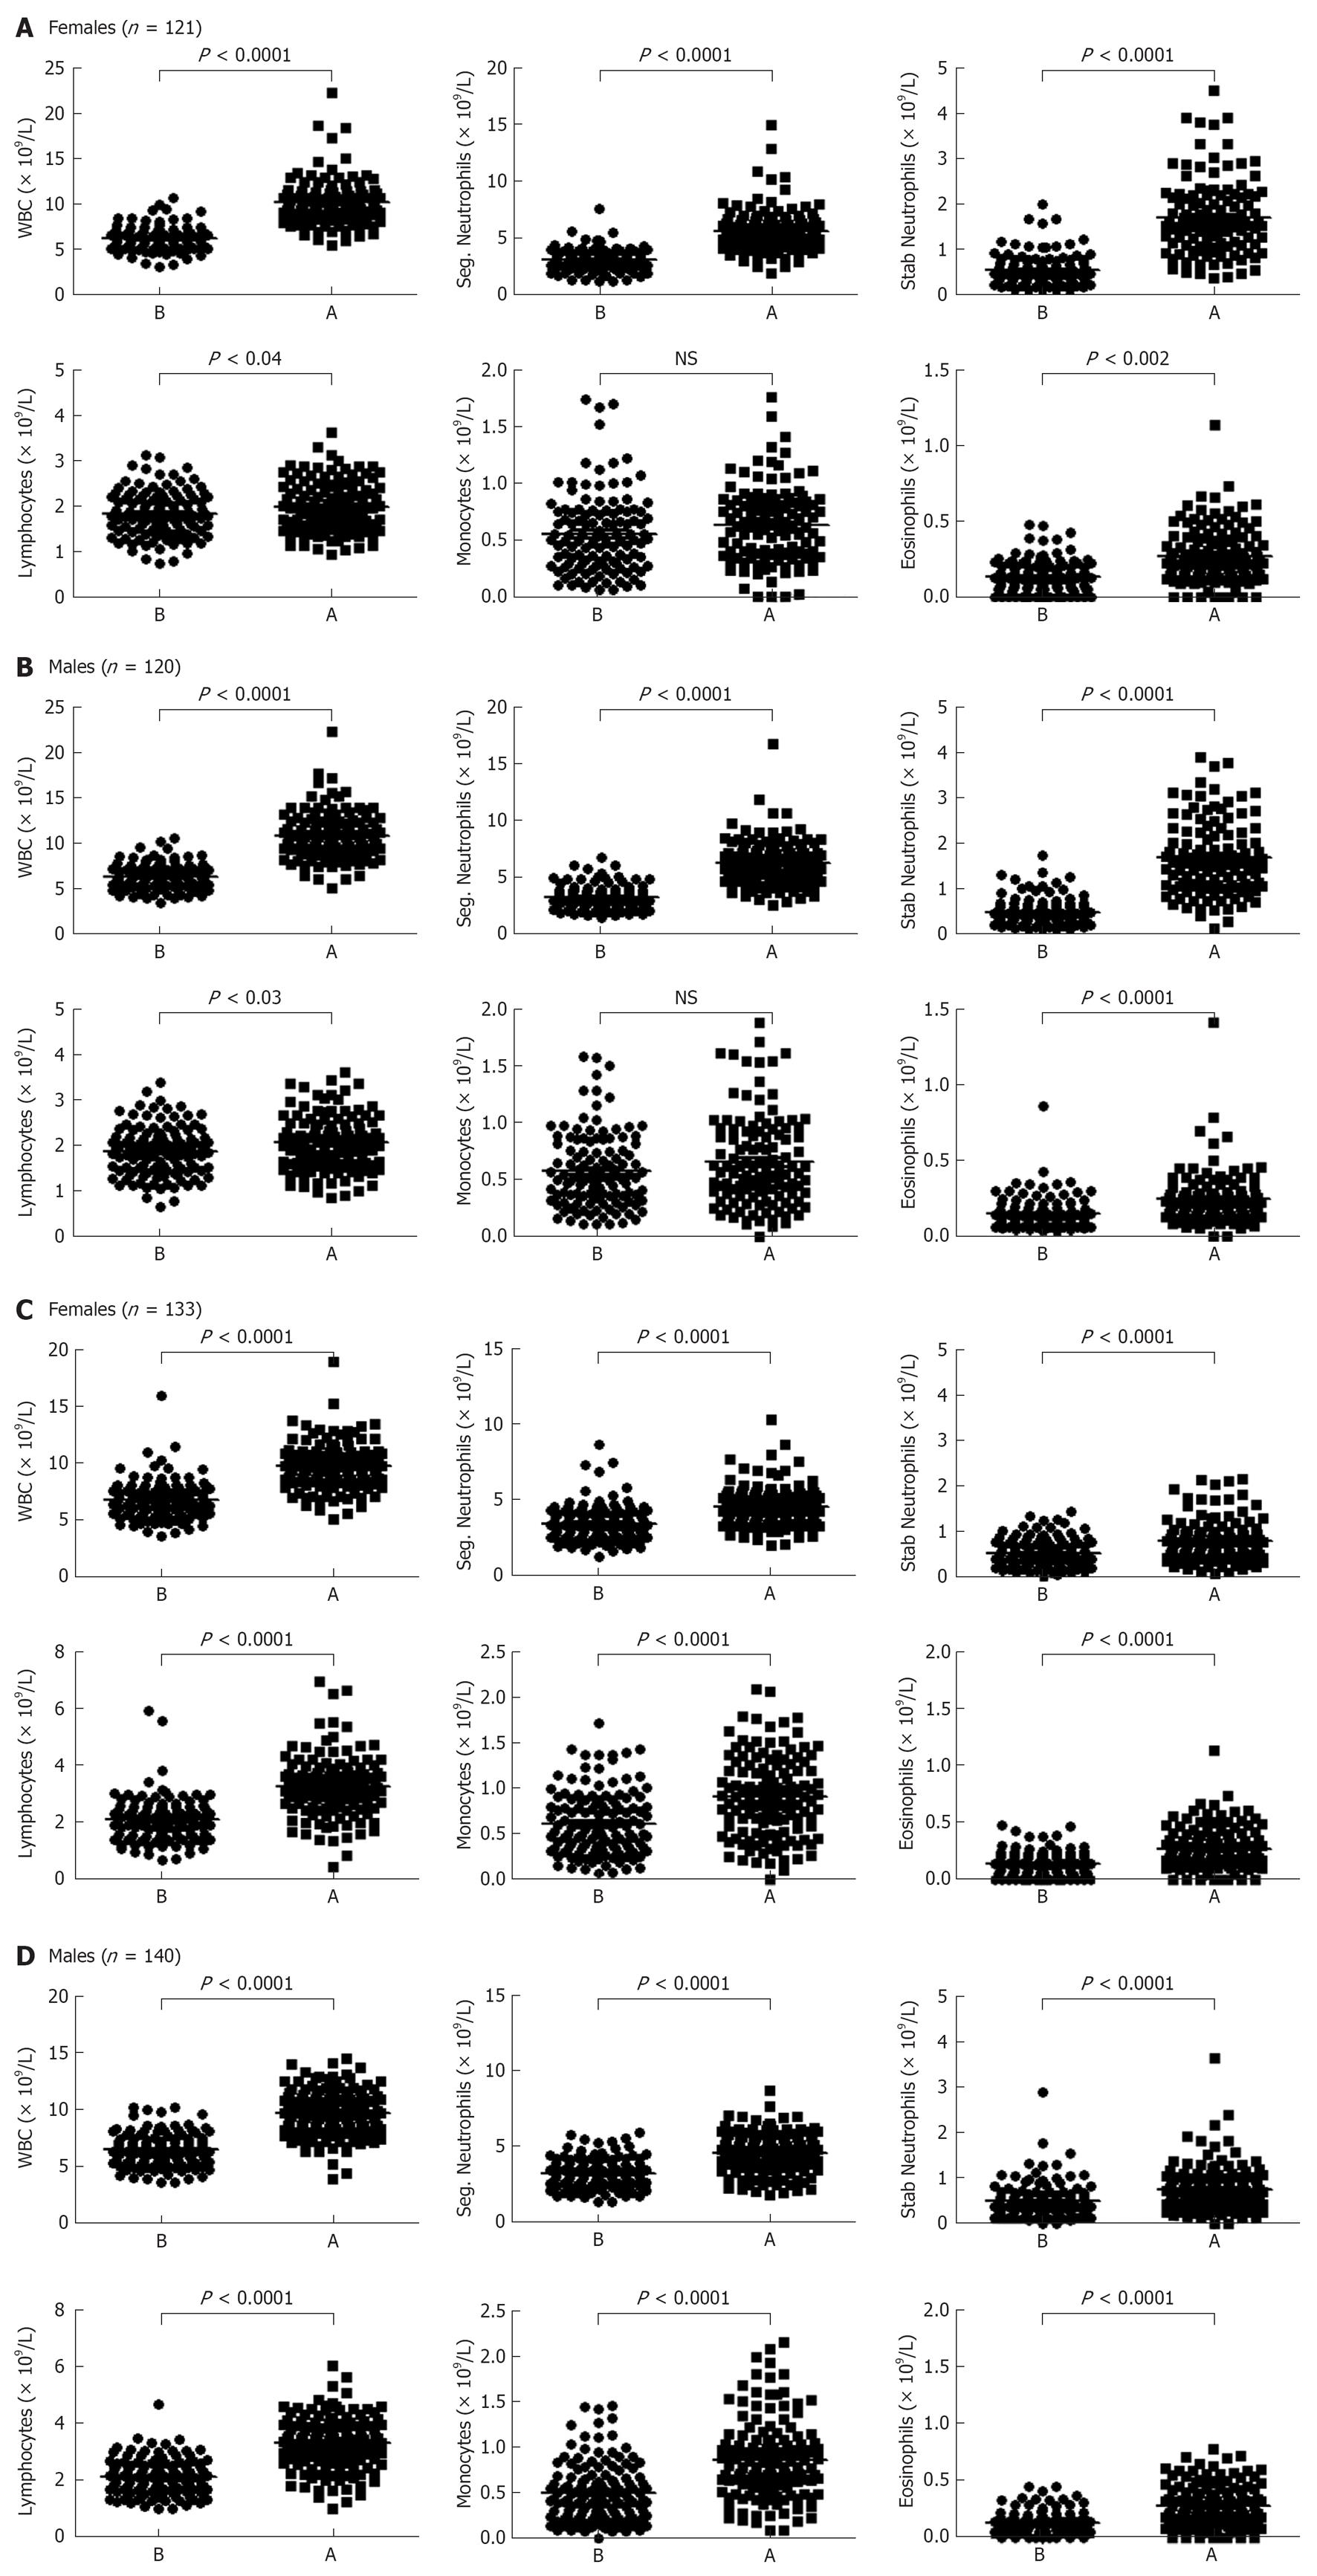
Figure 3 Evaluation of leukocytosis before and after leisure exercise.
A: Total numbers of white blood cells, segmented (seg.) neutrophils, stab (band) neutrophils, total lymphocytes, monocytes and eosinophils were calculated from 121 healthy females before and after 1 h run (or ski) and 3 h rest. Lines indicate the mean values. P values compared the differences in the numbers between after and before exercise; B: This is similar to panel A, except that 120 healthy males were examined. Each dot represents one individual; C: Total numbers of white blood cells, segmented neutrophils, stab (band) neutrophils, total lymphocytes, monocytes and eosinophils were calculated from 133 healthy females before and after 5 min of intense exercise. Lines indicate the mean values. P values compared the differences in the numbers between after and before exercise; D: This is similar to panel A, except that 140 healthy males were examined. Each dot represents one individual. B: Before; A: After; WBC: White blood cell.
Figure 4 Fold increase in the numbers of white blood cells after exercise.
Each dot represents one Individual. The increase in the numbers of leukocytes after exercise varies between 1-3 times. WBC: White blood cell.
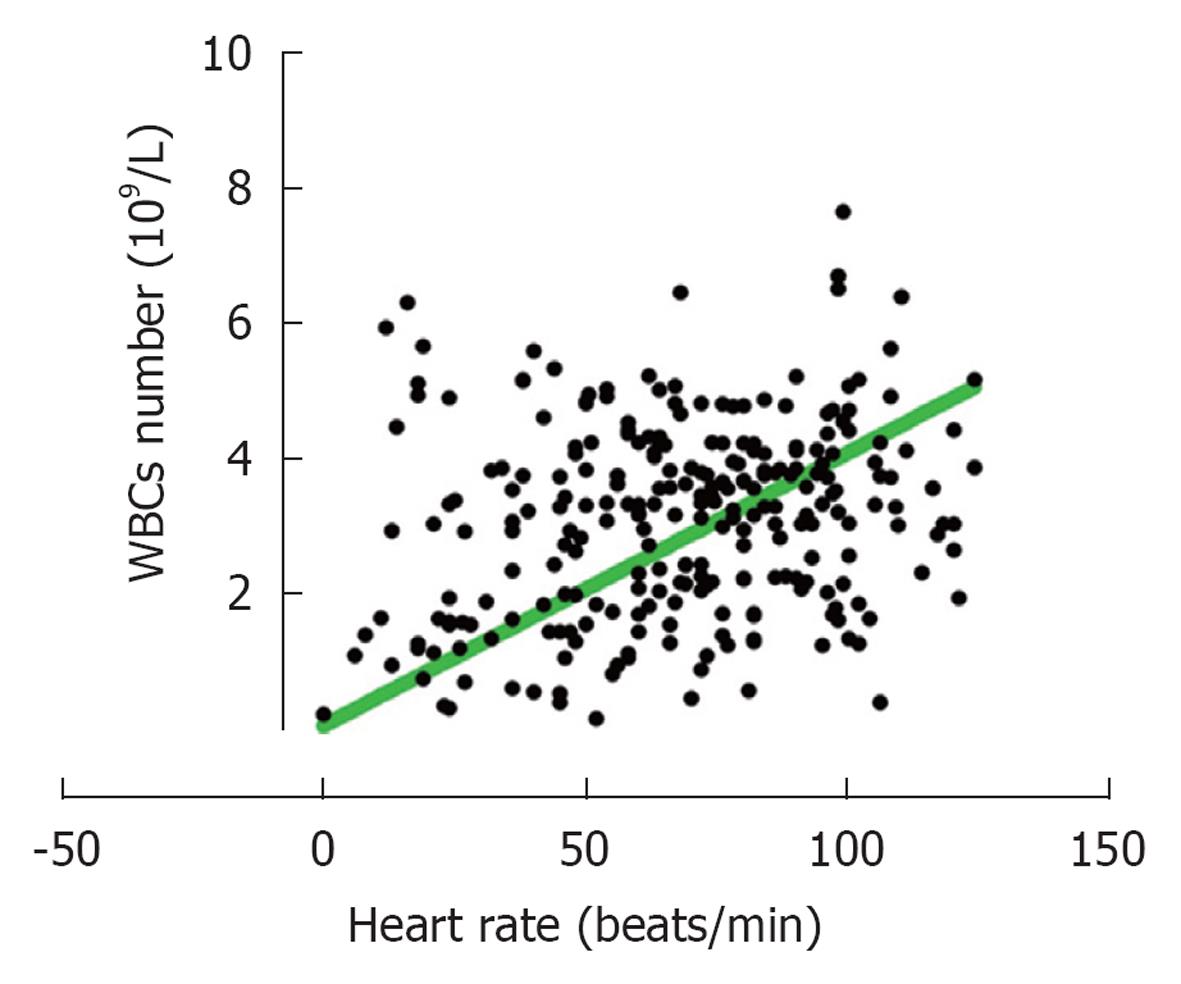
Figure 5 Correlations between the numbers of white blood cells and heart rate after intense exercise.
The increase in the numbers of white blood cells accumulating in the blood after 5 min intense cycling is correlated with increased heart rate. WBCs: White blood cells.
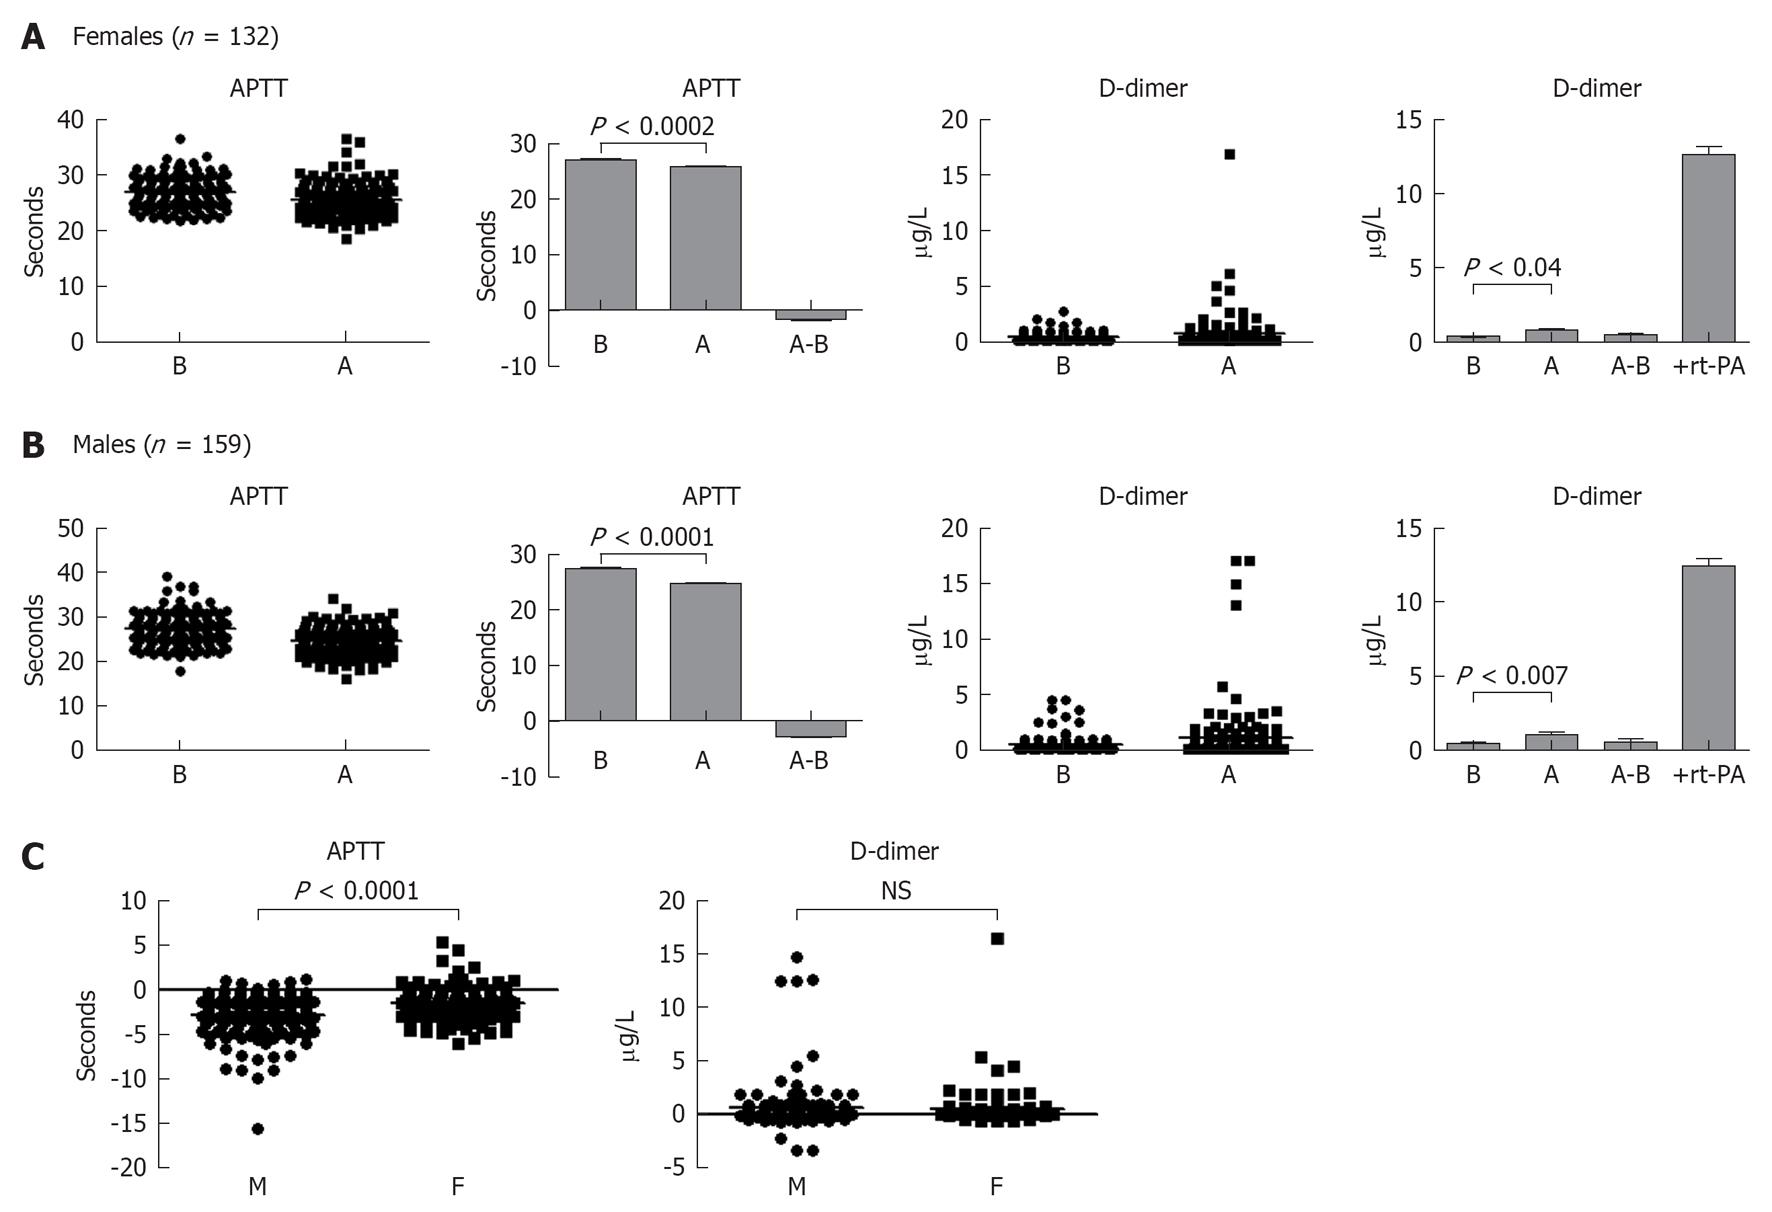
Figure 6 Evaluation of blood hemostasis.
A: Activated partial thromboplastin time (APTT) and D-dimer were measured in 132 healthy females before and after 5 min intense exercise. P values show the difference between after and before exercise. In the last panel actilyse “recombinant tissue-PA = rt-PA” was added to the assay in the presence thrombin and plasma samples collected from these individual and represent positive control. Dot and column graphs are shown to indicate the differences between after and before exercise; B: This is similar to panel A except that plasma samples of 159 healthy males were examined; C: Comparison among males (M) and females (F) for differences in APTT or D-dimer values (before minus after exercise). B: Before; A: After; NS: Not significant.
- Citation: Sand KL, Flatebo T, Andersen MB, Maghazachi AA. Effects of exercise on leukocytosis and blood hemostasis in 800 healthy young females and males. World J Exp Med 2013; 3(1): 11-20
- URL: https://www.wjgnet.com/2220-315X/full/v3/i1/11.htm
- DOI: https://dx.doi.org/10.5493/wjem.v3.i1.11


