Copyright
©2013 Baishideng.
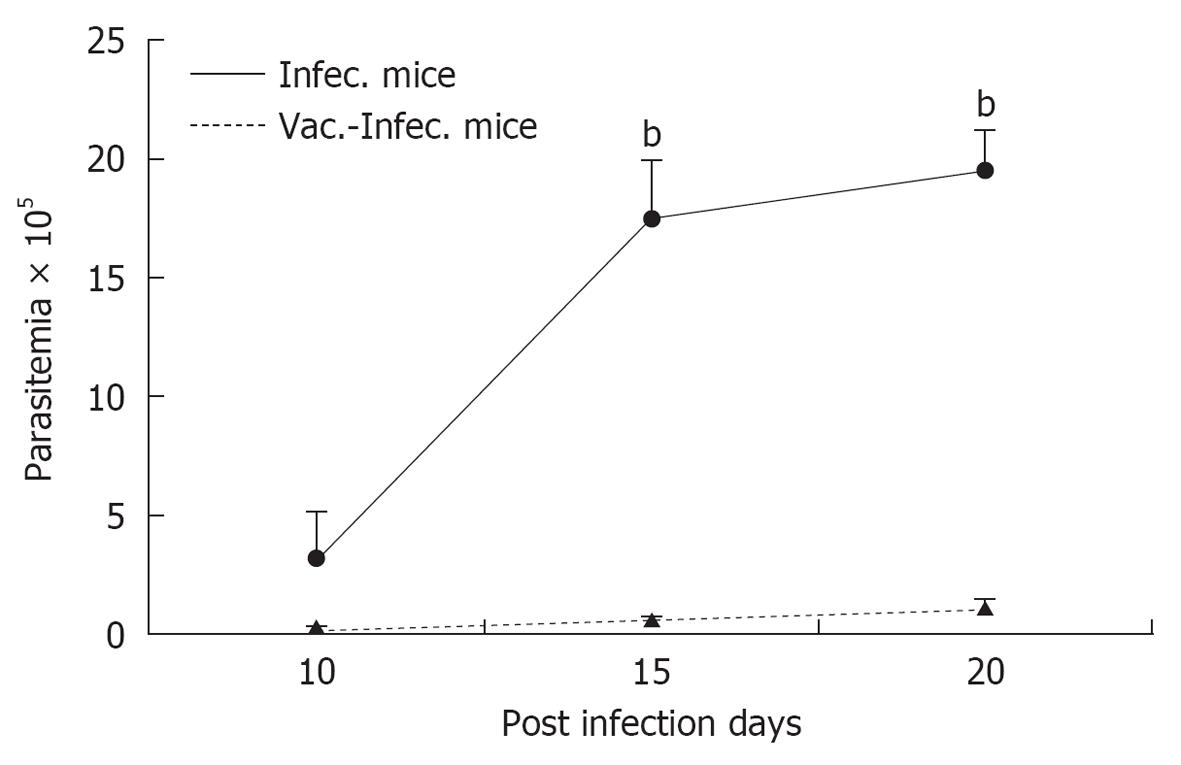
Figure 1 Parasitemia levels (geometric mean ± SE) in Trypanosoma cruzi infected mice (I) and in mice previously vaccinated with Trypanosoma cruzi and challenged with Trypanosoma cruzi (V-I).
The differences in parasitemia levels were evaluated by t-test: bP < 0.001.
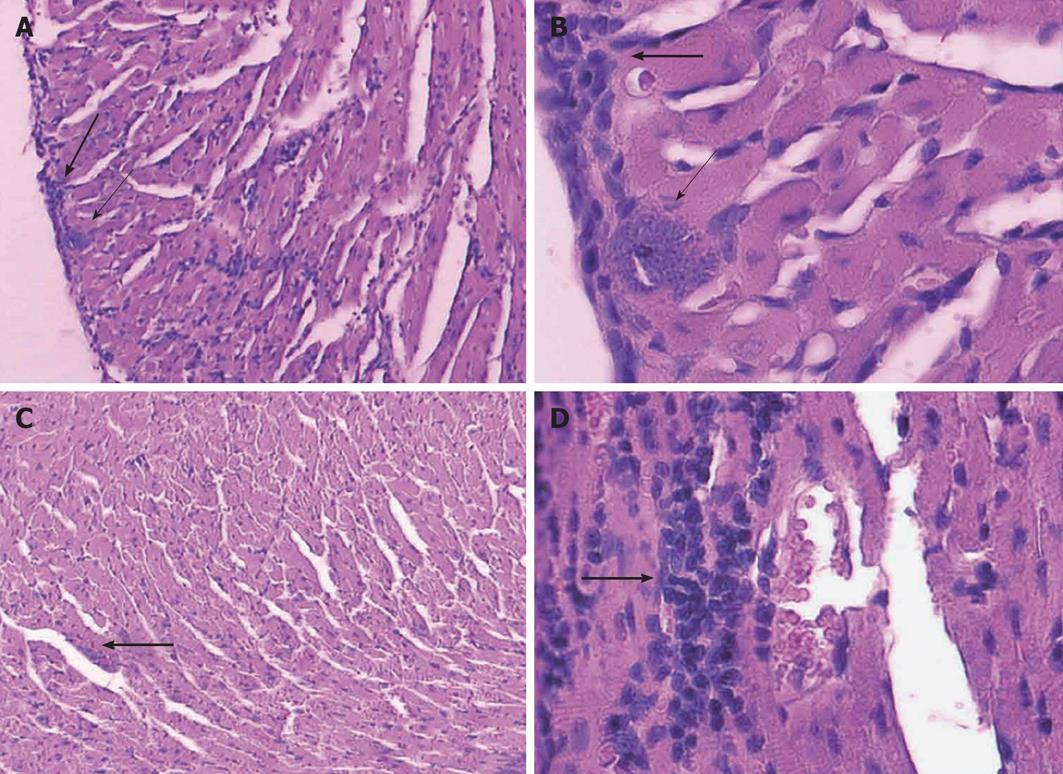
Figure 2 Histological studies: all sections were stained with hematoxylin and eosin.
Histological sections of heart. A, B: Control groups show nests of amastigotes (thin arrows) and mononuclear cell infiltration (thick arrow); C, D: Representative sections from mice vaccinated with Trypanosoma cruzi. Infected mice show focal mononuclear cell infiltrates (thick arrows). No amastigote nest was observed (A, C: 100 ×; B, D: 400 ×).
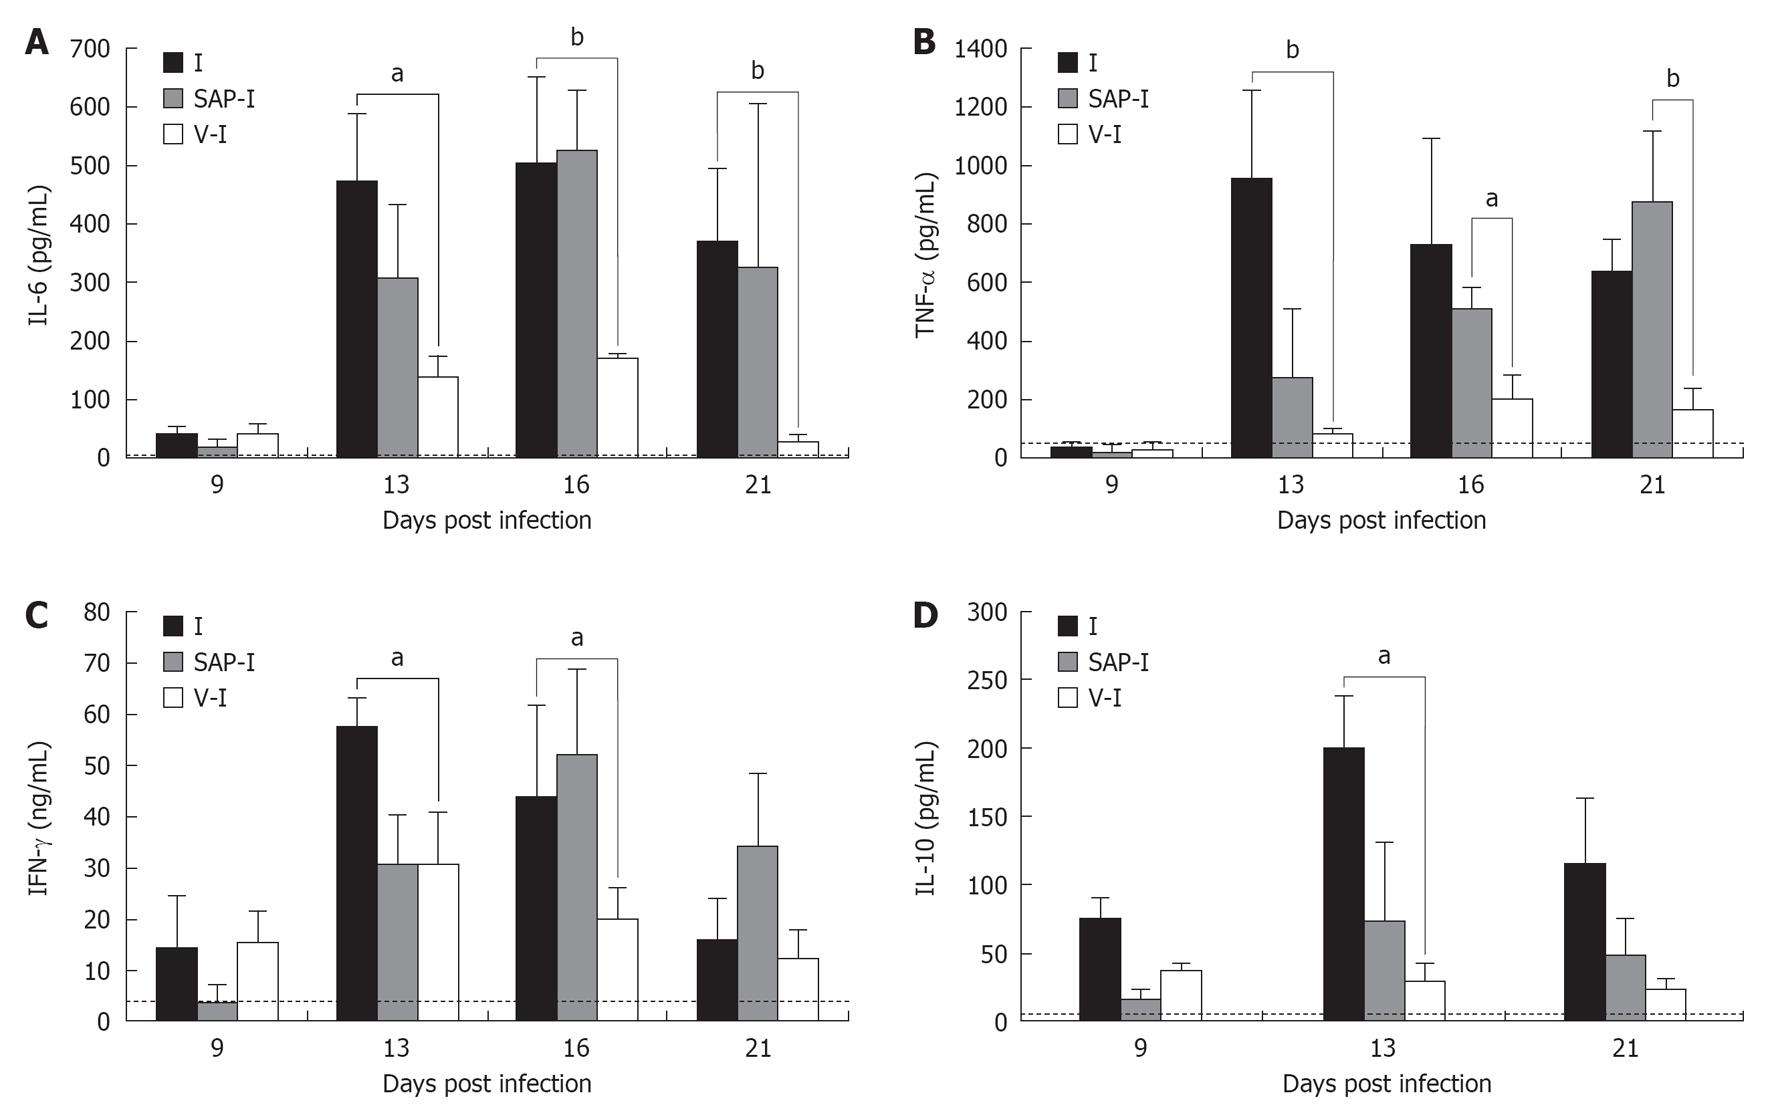
Figure 3 Kinetic of circulating cytokine levels in mice infected with Trypanosoma cruzi (A), in mice treated with saponin adjuvant and infected and in mice vaccinated with Trypanosoma cruzi and after infected (A-D).
mean ± SE cytokine are represented. The area below the pointed line indicates the 95% confidence limit of each cytokine observed in plasma from uninfected mice. A: Interleukin (IL)-6; B: Tumor necrosis factor (TNF)-α; C: Interferon (IFN)-γ; D: IL-10. The differences in cytokine levels among I and SAP-I groups with respect to V-I group were evaluated by t-test: aP < 0.05, bP < 0.01.
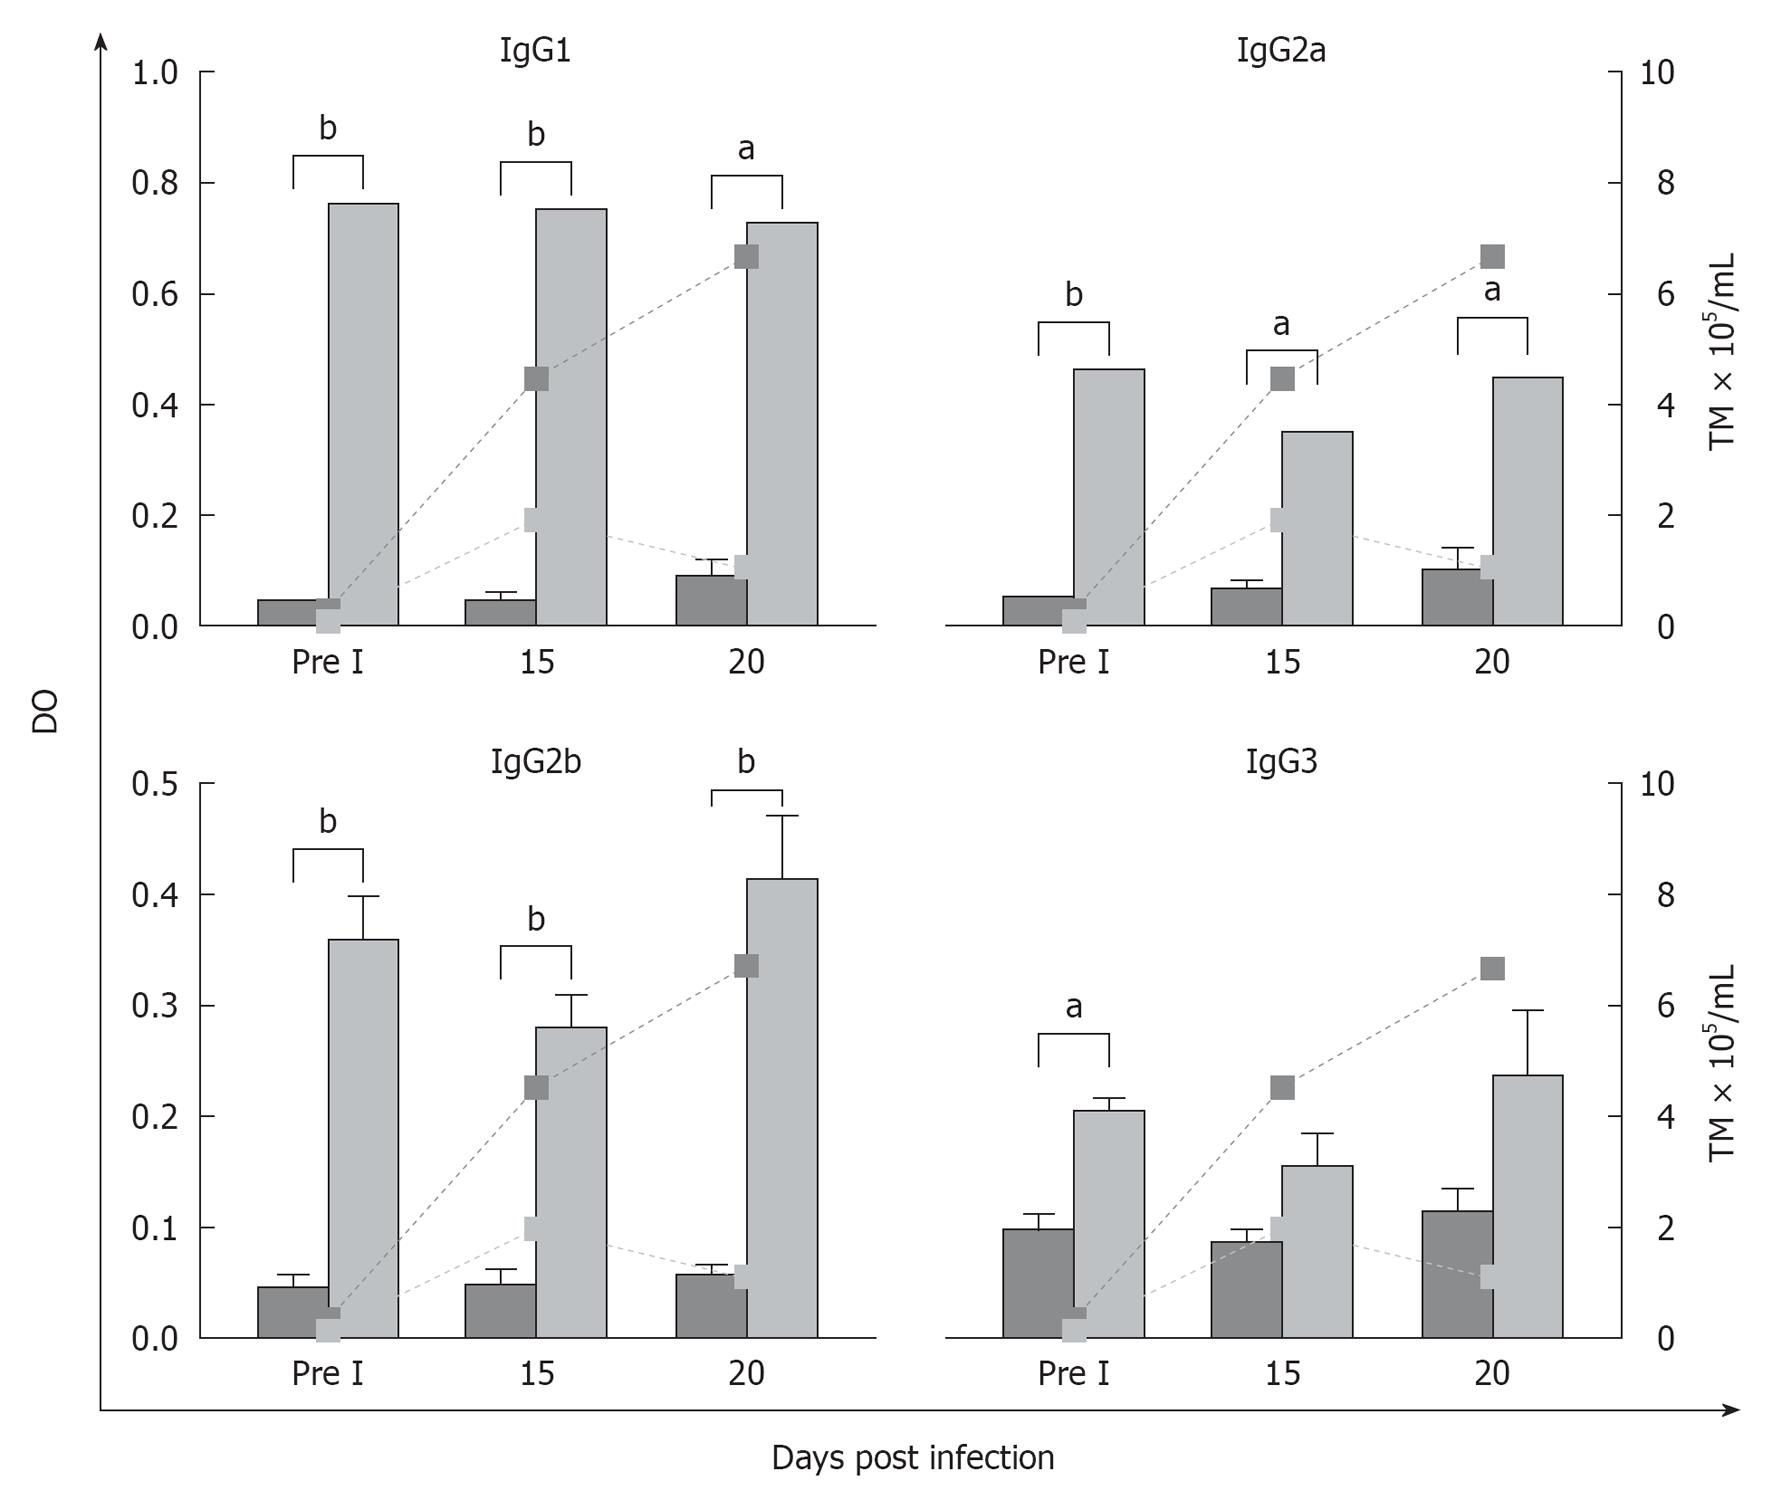
Figure 4 Specific IgG isotype levels in peritoneal fluid obtained from vaccinated, (light gray bars) or control mice, (dark gray bars) before and after infection determined by enzyme-linked immunosorbent assay (optical density mean ± SE).
The doted line is the parasitemia level at different time of infection. Significant differences between both groups evaluated by Student’s t-test (aP < 0.05, bP < 0.001).
- Citation: Basso B. Modulation of immune response in experimental Chagas disease. World J Exp Med 2013; 3(1): 1-10
- URL: https://www.wjgnet.com/2220-315X/full/v3/i1/1.htm
- DOI: https://dx.doi.org/10.5493/wjem.v3.i1.1


