Copyright
©2012 Baishideng.
World J Exp Med. Aug 20, 2012; 2(4): 78-85
Published online Aug 20, 2012. doi: 10.5493/wjem.v2.i4.78
Published online Aug 20, 2012. doi: 10.5493/wjem.v2.i4.78
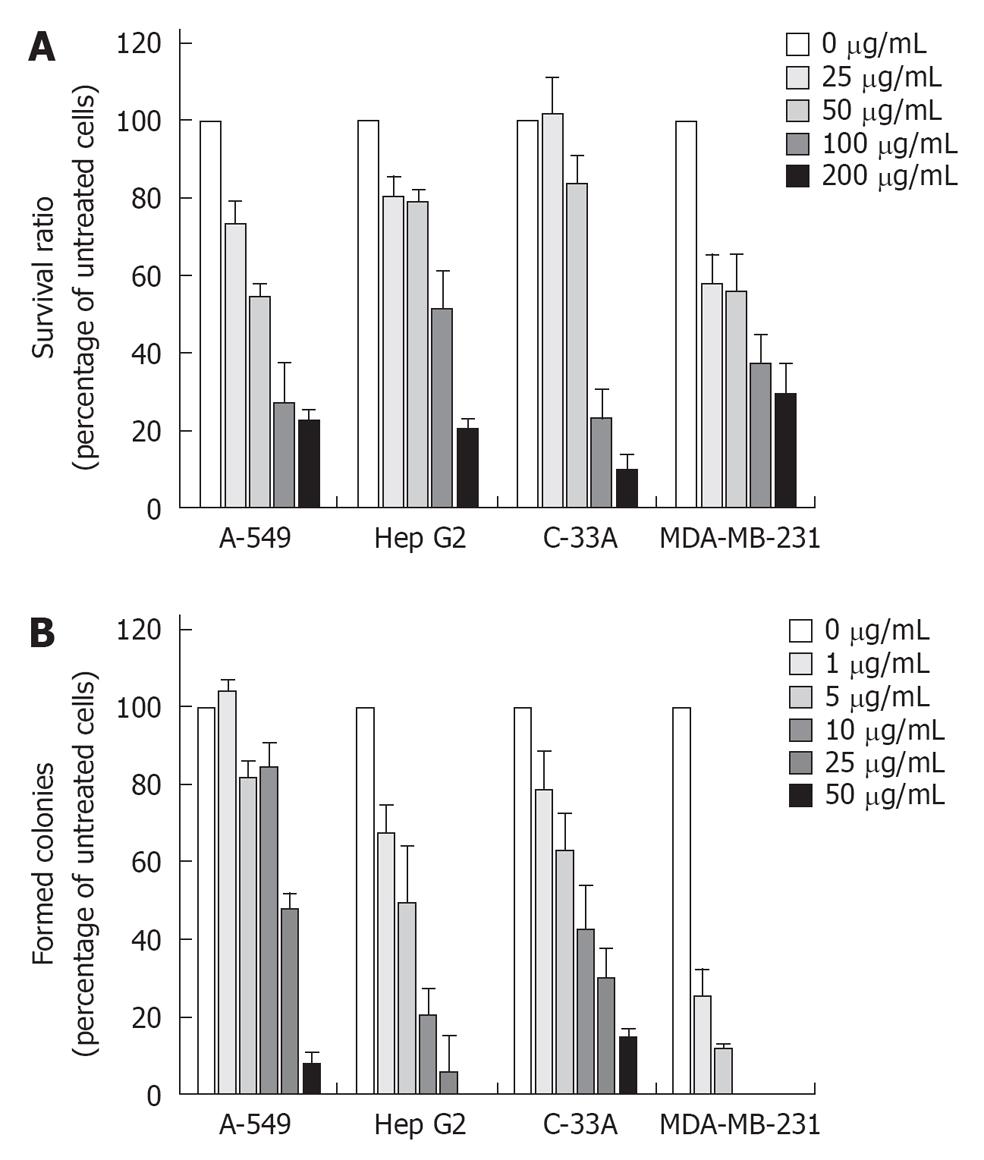
Figure 1 The inhibitory effect of longan seed extract on the growth of cancer cells.
The longan seed extract (LSE)-inhibited growth assessed herein consists of cancer cell proliferation by (A) trypan blue assay and (B) colony forming activity. For the cell proliferation assay, 100 000 cancer cells as indicated were seeded in 60-mm sterile plastic dishes and treated with different concentrations of LSE. After incubation at 37 °C for 48 h, cells were detached by treatment with trypsin, and the suspended cells were stained with trypan blue. The viable cells were then counted under a phase contrast microscope. Colony formation activity was assessed by seeding 200 cells into 60-mm dishes then treating these cells with different concentrations of LSE. After incubation for 14 d, the formed colonies that contained more than 50 cells were regarded as one colony, and the numbers of colonies in the dishes were counted. The data represent the average of three independent experiments and are expressed as the mean ± SD.
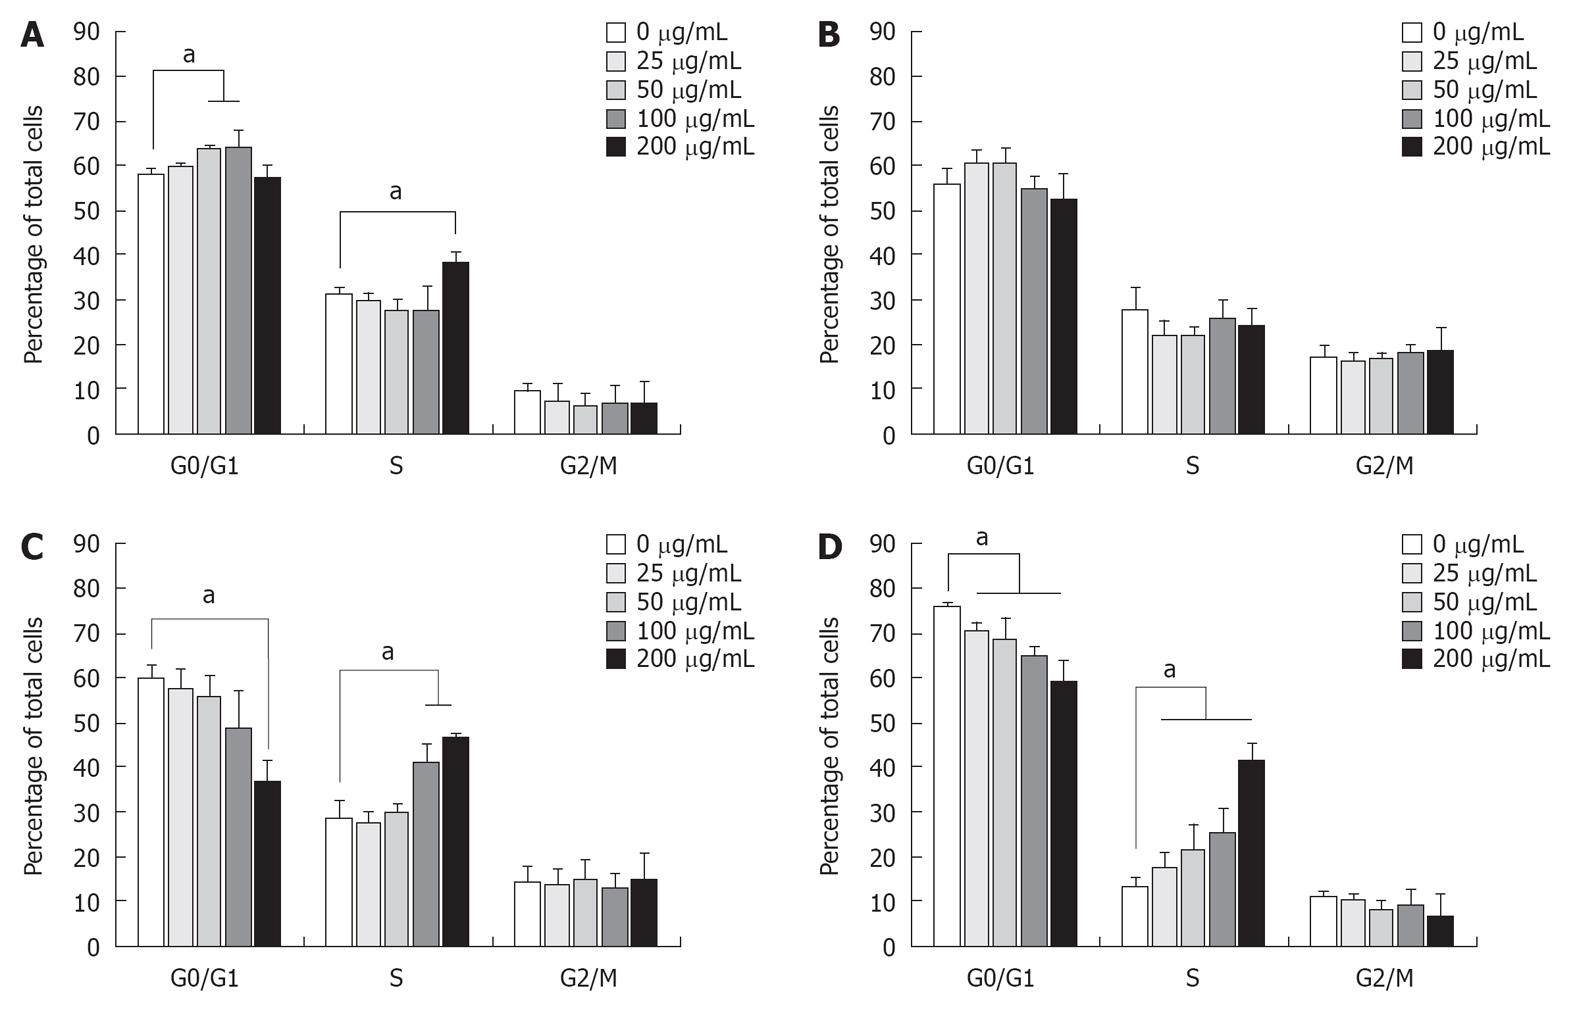
Figure 2 Cell cycle analysis of longan seed extract -treated cancer cells.
About 1 × 10⁶ cells in 10 mL medium in 100 mm plate were treated with increasing concentrations of longan seed extract as indicated, then incubated at 37 °C for 48 h. The (A) A-549, (B) Hep G2, (C) C-33A and (D) MDA-MB-231 cells harvested by trypsinization were fixed in 70% alcohol at -20 °C for 2 h and then reconstituted in phosphate-buffered saline. The cells were stained with propidium iodide solution in the dark at room temperature for 30 min. The stained cells were then analyzed using the FL-2A parameter of a flow cytometer to obtain the DNA content of the cells, and the distribution in each cell-cycle phase was determined using Modfit software. Data are expressed as a percentage of the total cells. Data represent the average of three independent experiments, and are expressed as the mean ± SD. aP < 0.05.
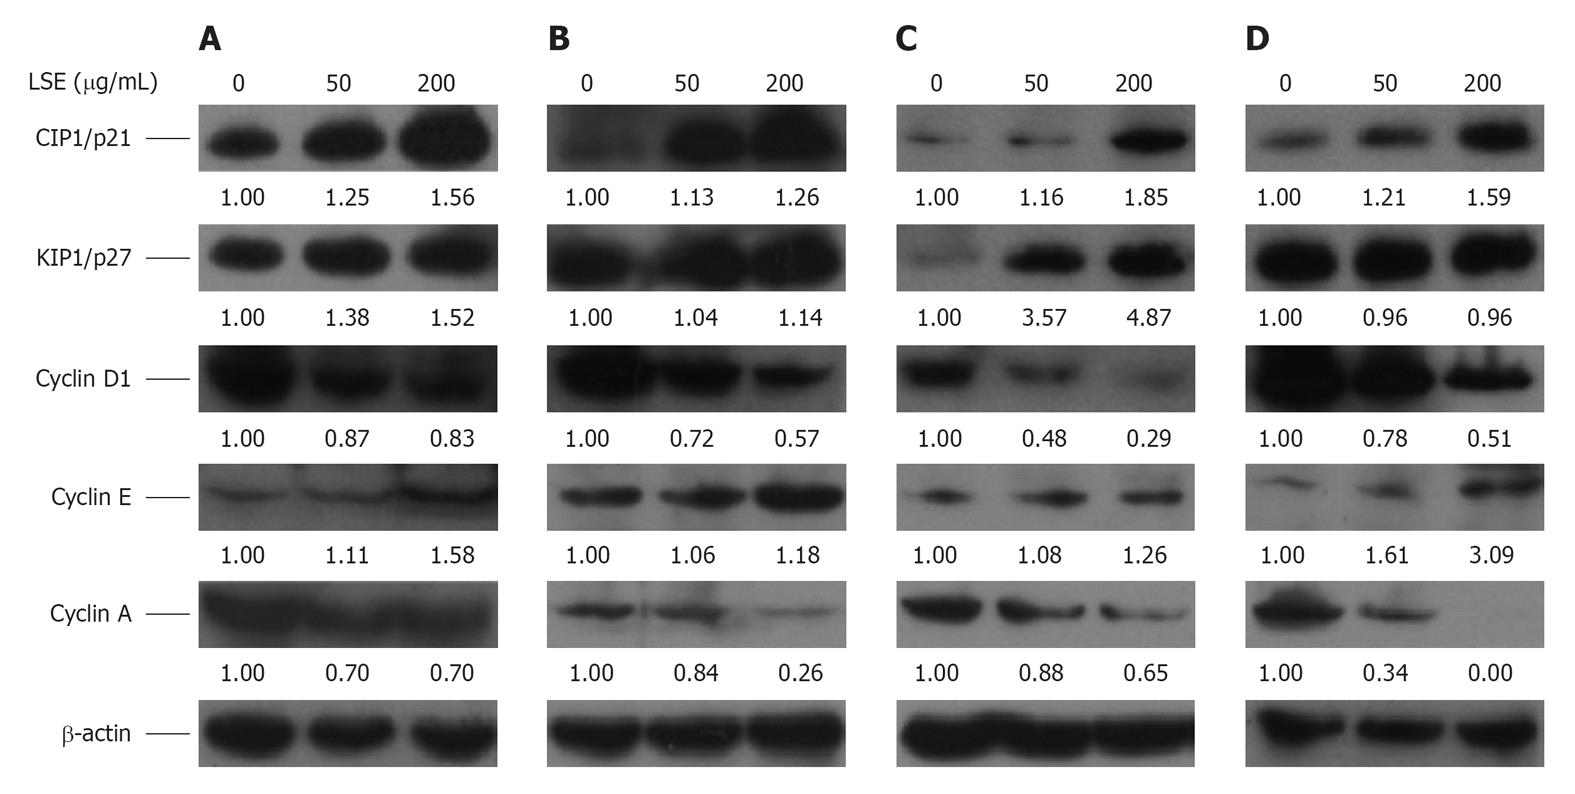
Figure 3 Immunoblots of cell cycle-controlling proteins in longan seed extract-treated cancer cells.
About 50 and 200 μg/mL longan seed extract (LSE)-treated (A) A-549, (B) Hep G2, (C) C-33A and (D) MDA-MB-231 cells were incubated at 37 °C for 48 h. The harvested cells were lysed in Triton X 100-containing hypotonic buffer as per previous reports (Hsu et al[37], 2010; Chung et al[48], 2010) at 4 °C for 30 min. Cell lysates were centrifuged and the protein concentrations in the supernatants were determined using a bicinchoninic acid protein detection kit. Cell protein lysates were separated by sodium dodecyl sulfate polyacrylamide gel electrophoresis, transferred to polyvinylidene difluoride membranes and immunoblotted to show cyclin D1, cyclin E, cyclin A, CIP1/p21 and KIP1/p27, with the β-actin level used as the loading control. The images are representative results from three independent experiments. The density of each protein band was measured using ImageJ software and protein expression was normalized to β-actin, and the relative amount of each protein band was referenced to the untreated control.
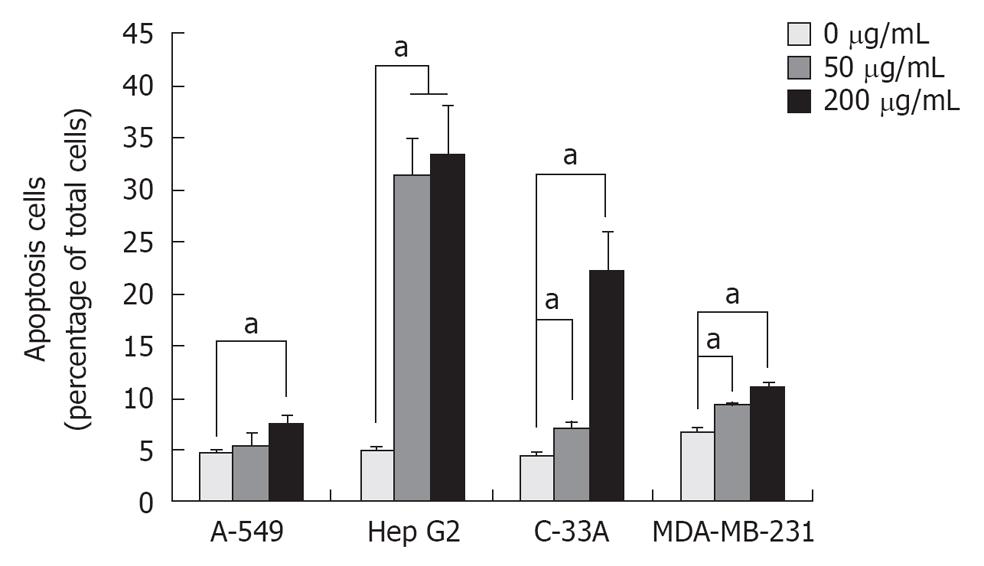
Figure 4 Detection of longan seed extract-induced apoptotic cells.
Phosphatidylserine is usually distributed in the inner fleet of the plasma membrane. When cells are undergoing apoptosis, this phospholipid translocates to the outer fleet, and can be recognized by a bacteria glycoprotein named annexin V. We used annexin V conjugated with fluorescein isothiocyanate (FITC) as an apoptosis indicator and analyzed the apoptotic cells by flow cytometry. Briefly, 50 and 200 μg/mL longan seed extract-treated cells were incubated at 37 °C for 48 h. The treated cells were then suspended and stained with annexin V conjugated with FITC. Ten thousand cells were analyzed by flow cytometry using FL-1 as the parameter. Data are taken from the averages of three independent experiments and expressed as the mean ± SD. aP < 0.05.
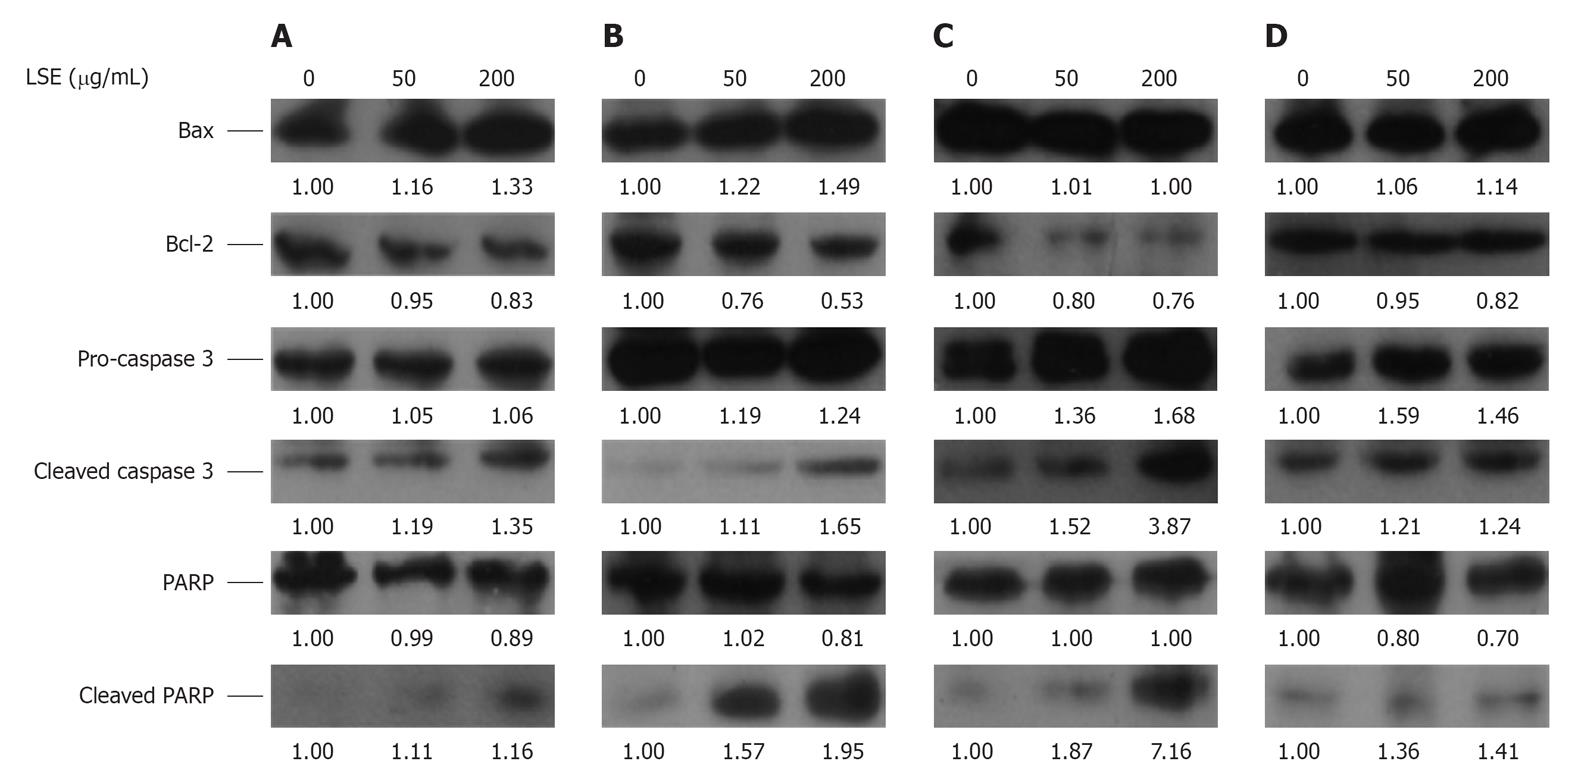
Figure 5 Immunoblots of apoptosis-associated proteins in longan seed extract-treated cancer cells.
The same cell lysates from longan seed extract (LSE)-treated (A) A-549, (B) Hep G2, (C) C-33A and (D) MDA-MB-231 cells as described in Figure 3 were separated by sodium dodecyl sulfate polyacrylamide gel electrophoresis, transferred to polyvinylidene difluoride membranes and immunoblotted to show the levels of Bax, Bcl-2, pro-Caspase 3, cleaved-caspase 3, poly (ADP-ribose) polymerase-1 (PARP-1) and cleaved-PARP. The images are representative of three independent experiments.
- Citation: Lin CC, Chung YC, Hsu CP. Potential roles of longan flower and seed extracts for anti-cancer. World J Exp Med 2012; 2(4): 78-85
- URL: https://www.wjgnet.com/2220-315X/full/v2/i4/78.htm
- DOI: https://dx.doi.org/10.5493/wjem.v2.i4.78


