Copyright
©The Author(s) 2025.
World J Exp Med. Sep 20, 2025; 15(3): 108467
Published online Sep 20, 2025. doi: 10.5493/wjem.v15.i3.108467
Published online Sep 20, 2025. doi: 10.5493/wjem.v15.i3.108467
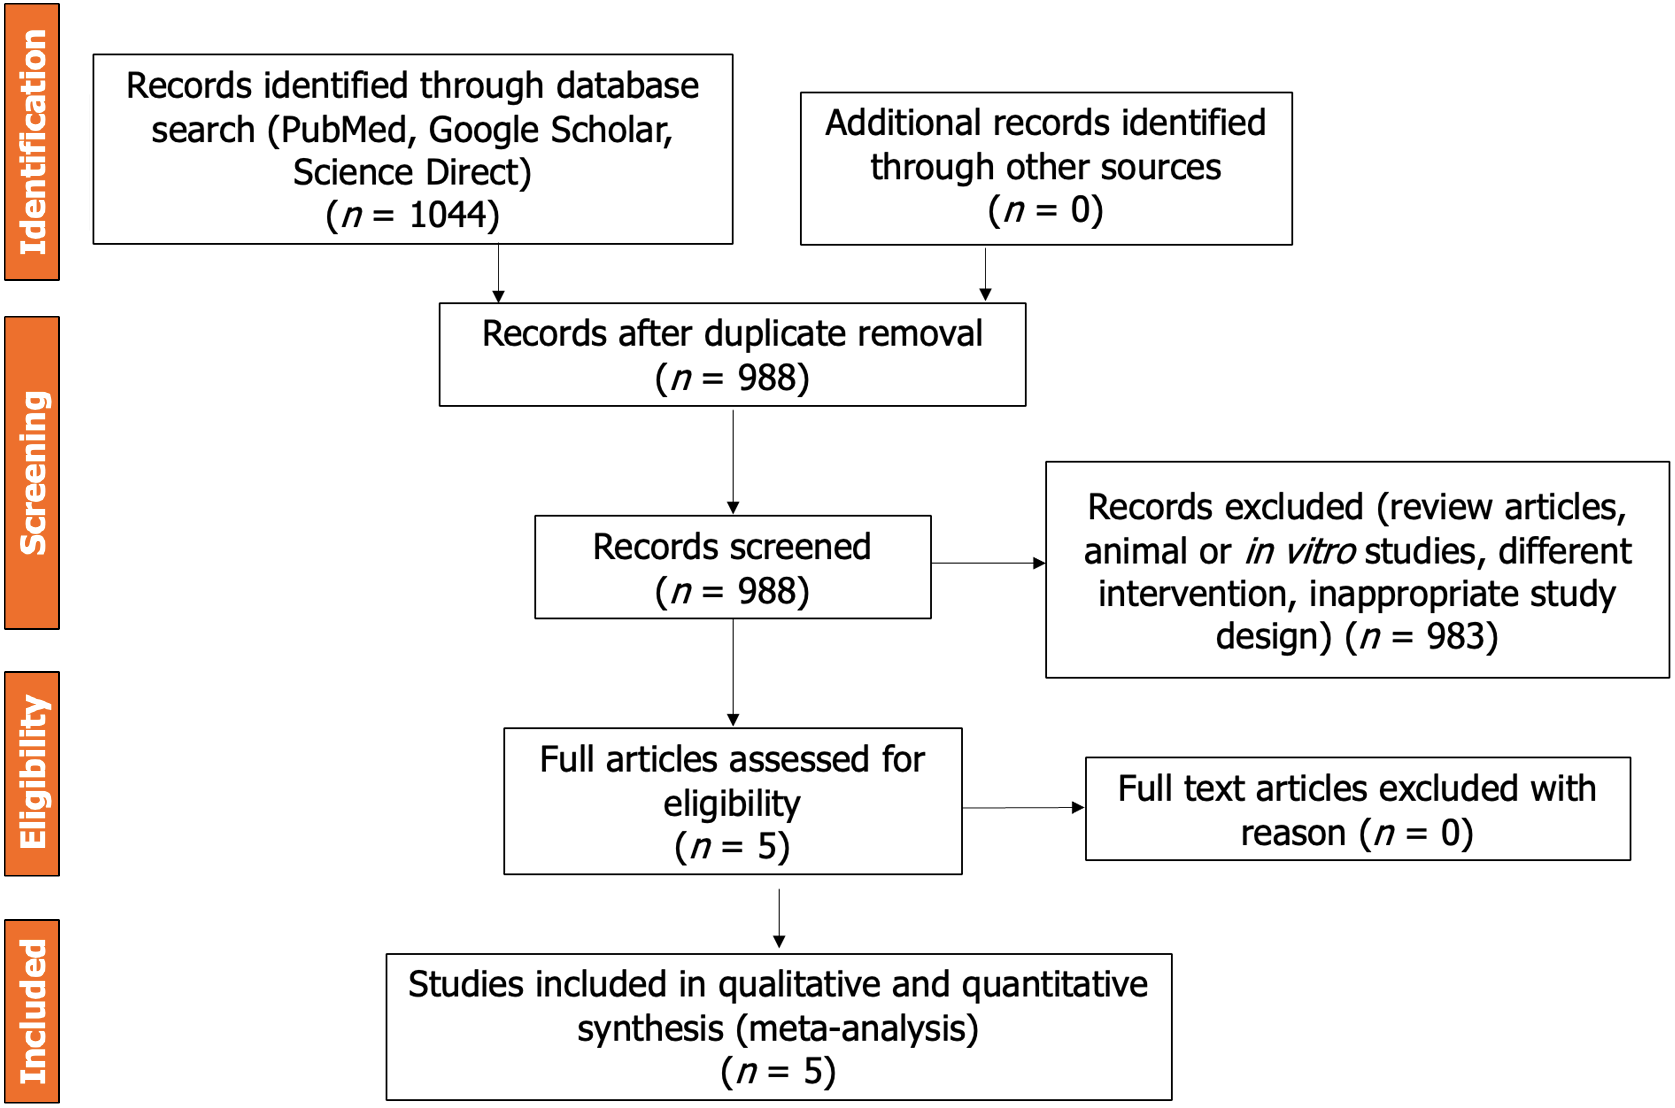
Figure 1 PRISMA study selection flowchart.
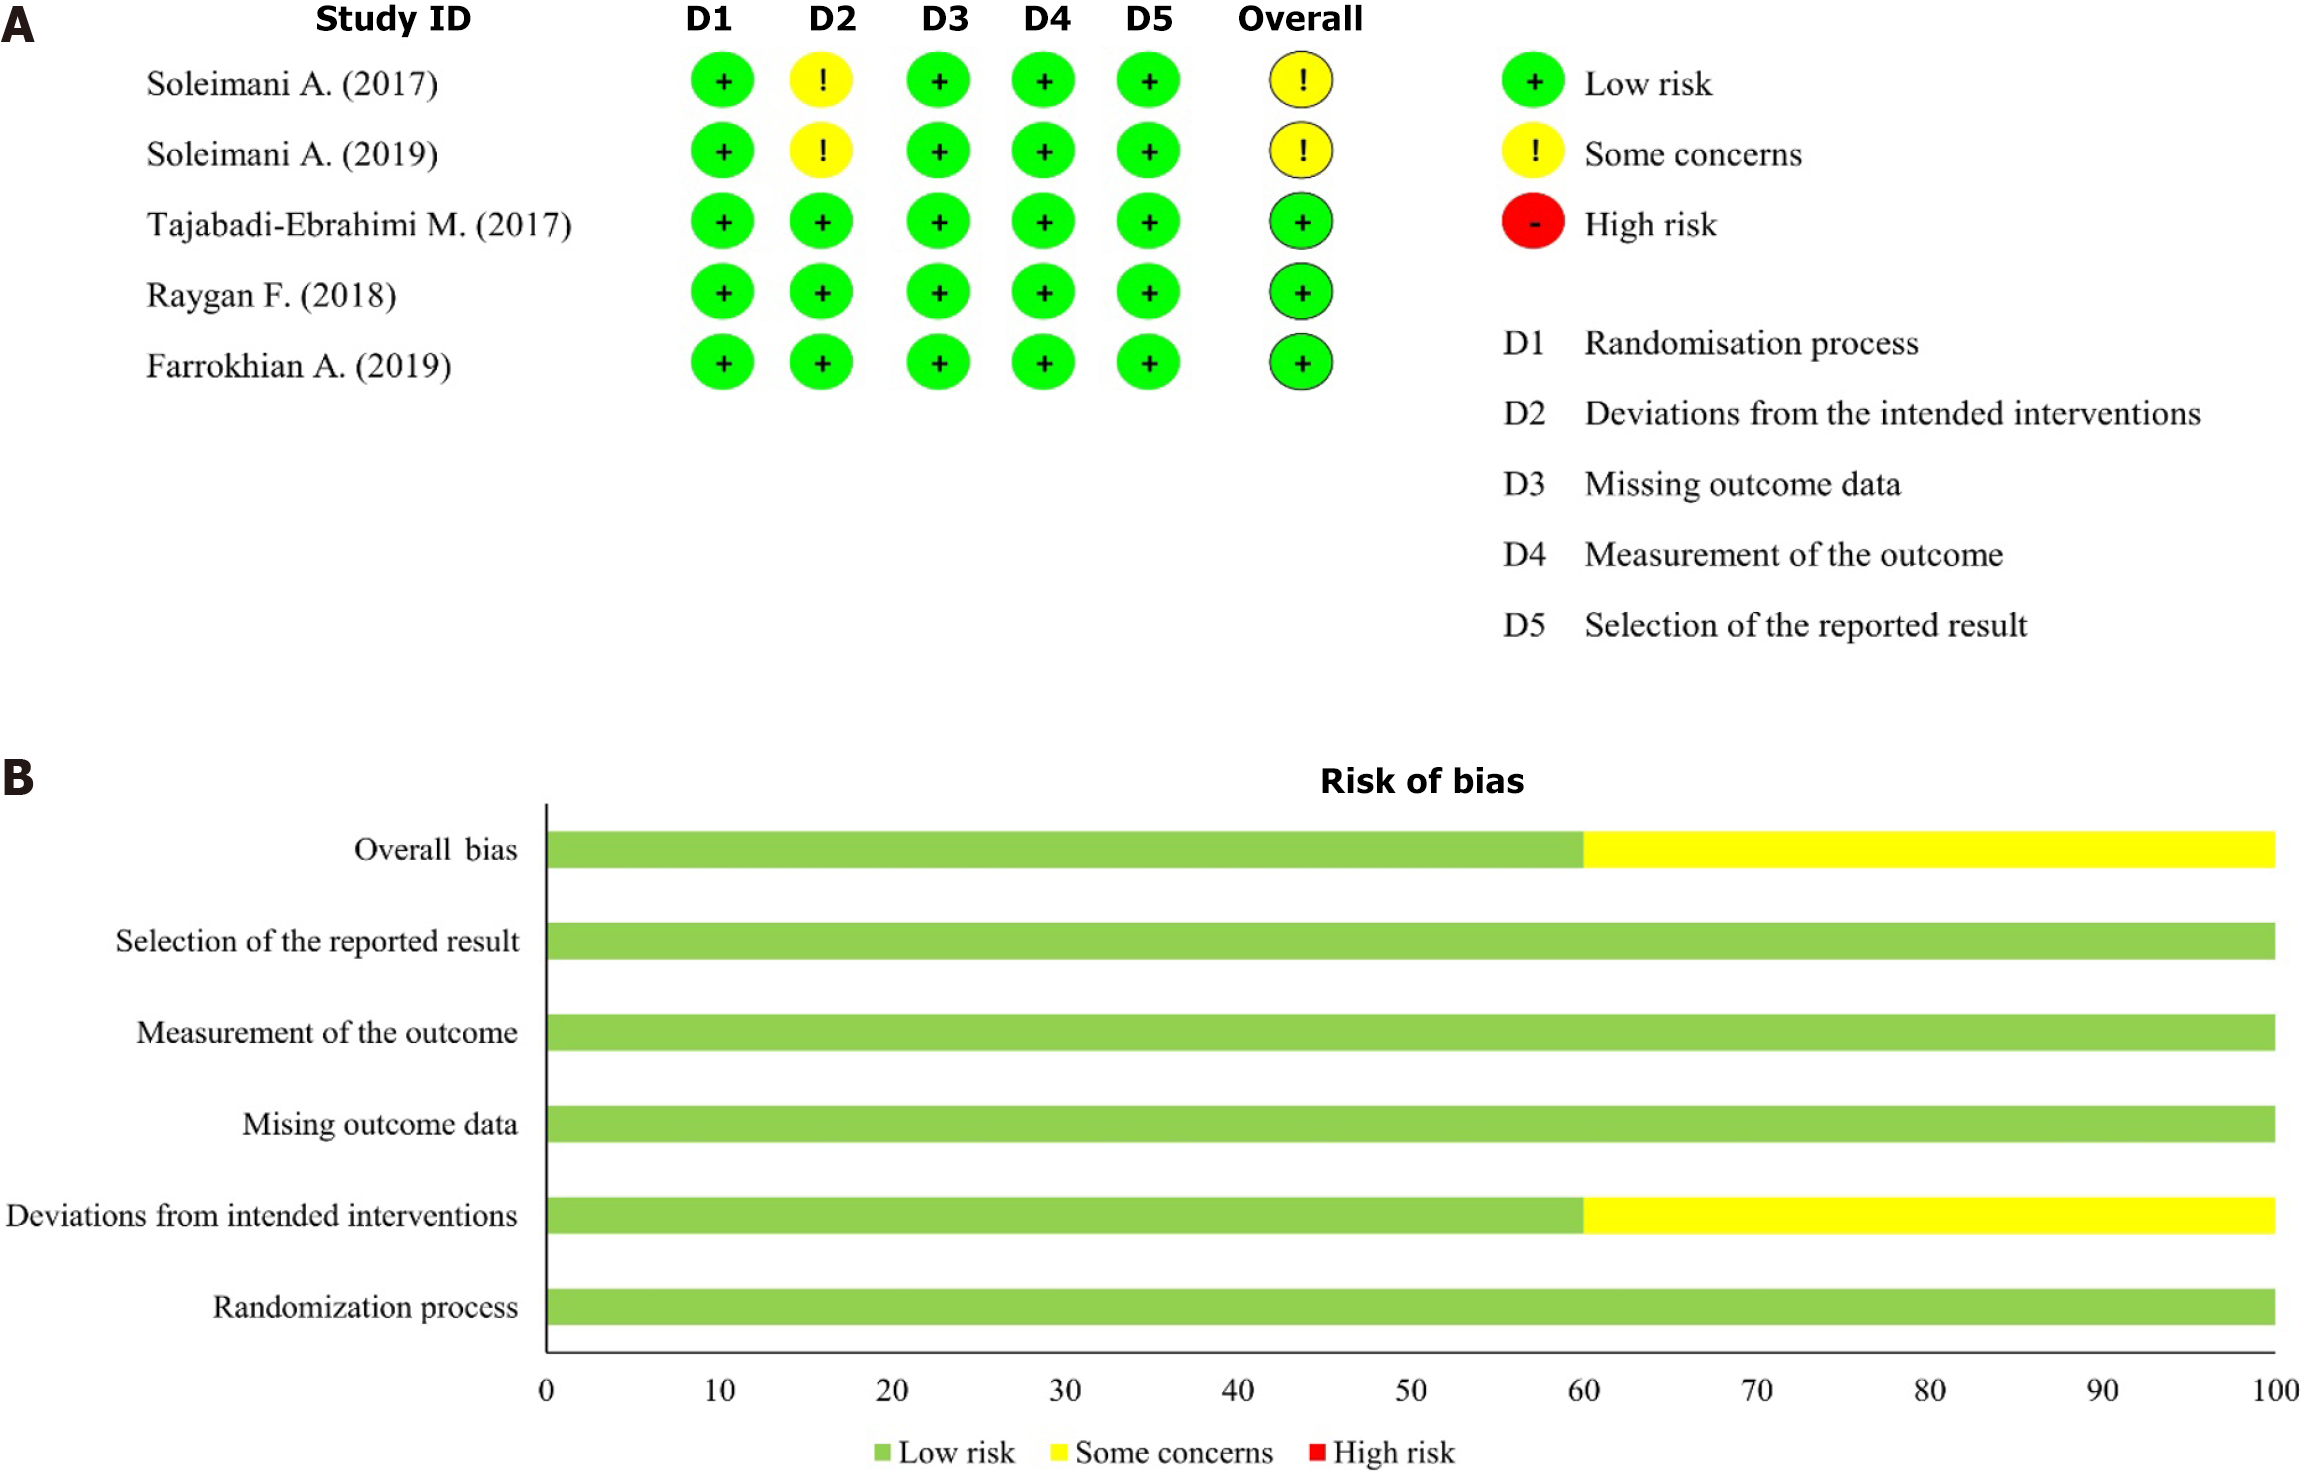
Figure 2 Risk of bias assessment.
A: Risk of bias of within individual studies; B: Risk of bias between studies.
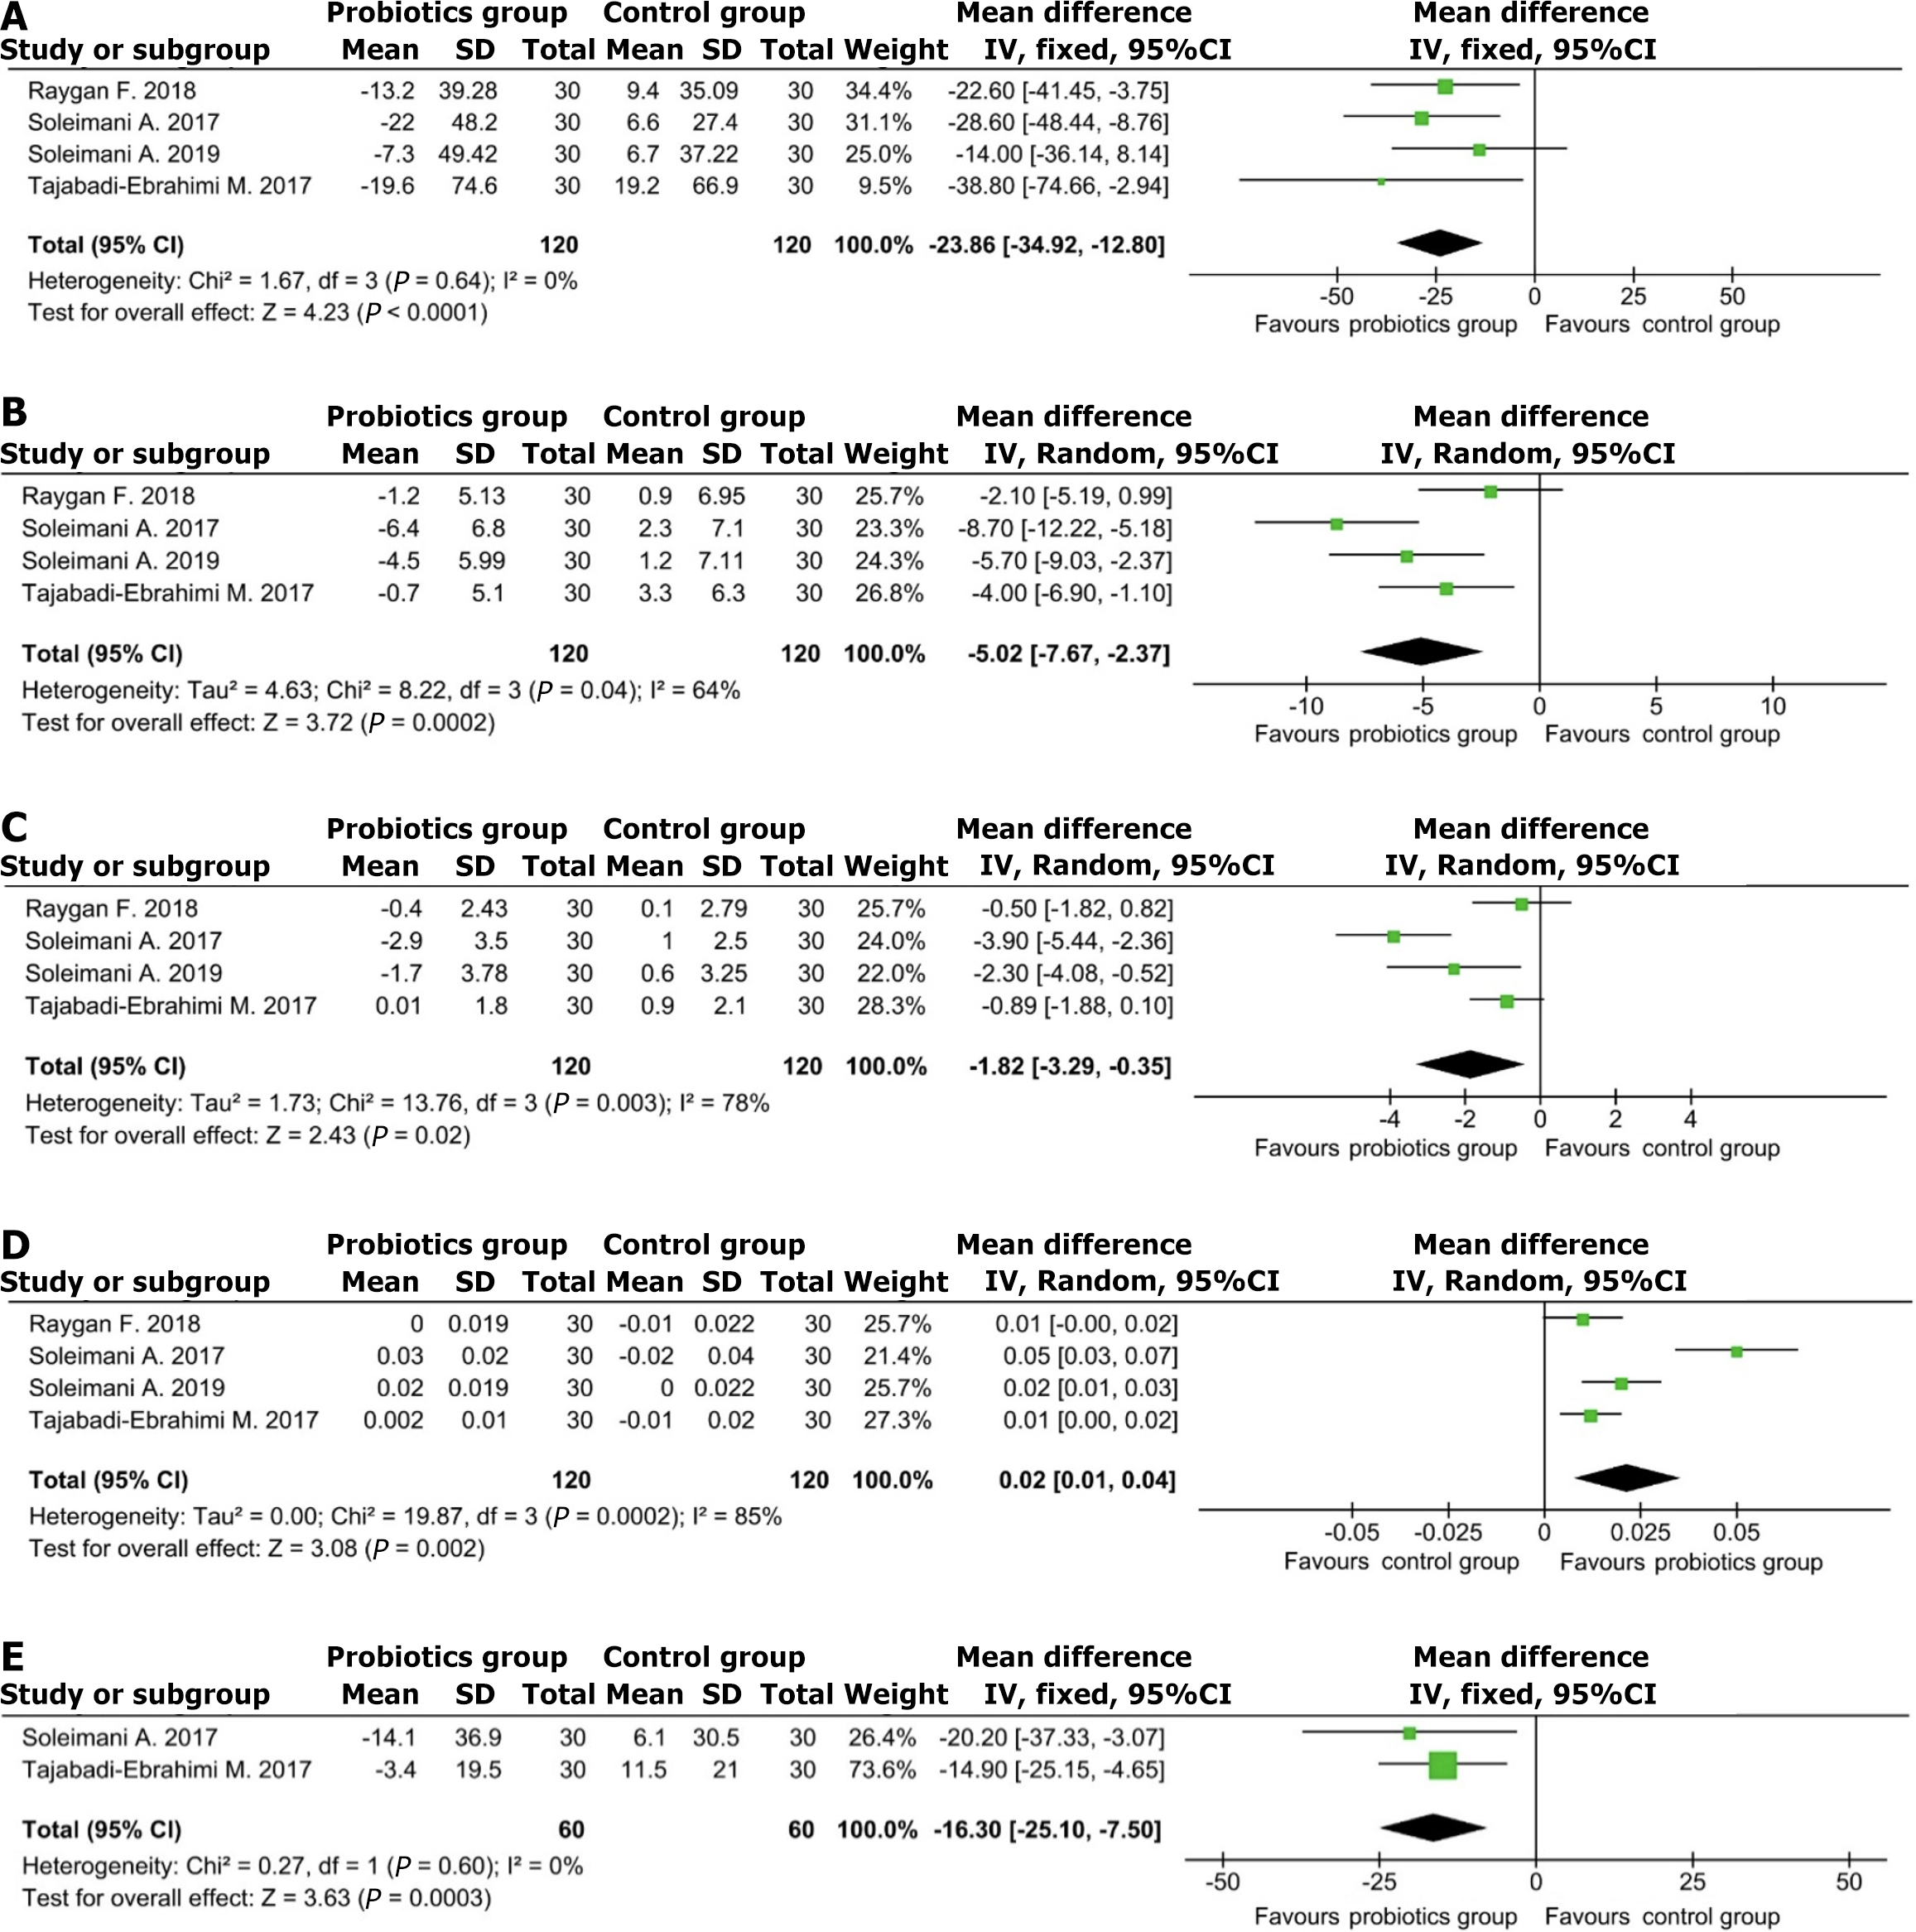
Figure 3 Efficacy of triple probiotic combination on glycaemic and insulin parameters.
A: Serum glucose level; B: Serum insulin level; C: HOMA-IR score; D: QUICKI score; E: HOMA-B score. HOMA-IR: Homeostatic model assessment for insulin resistance; HOMA-B: Homeostasis model assessment of β-cell function; QUICKI: Quantitative insulin-sensitivity check index.
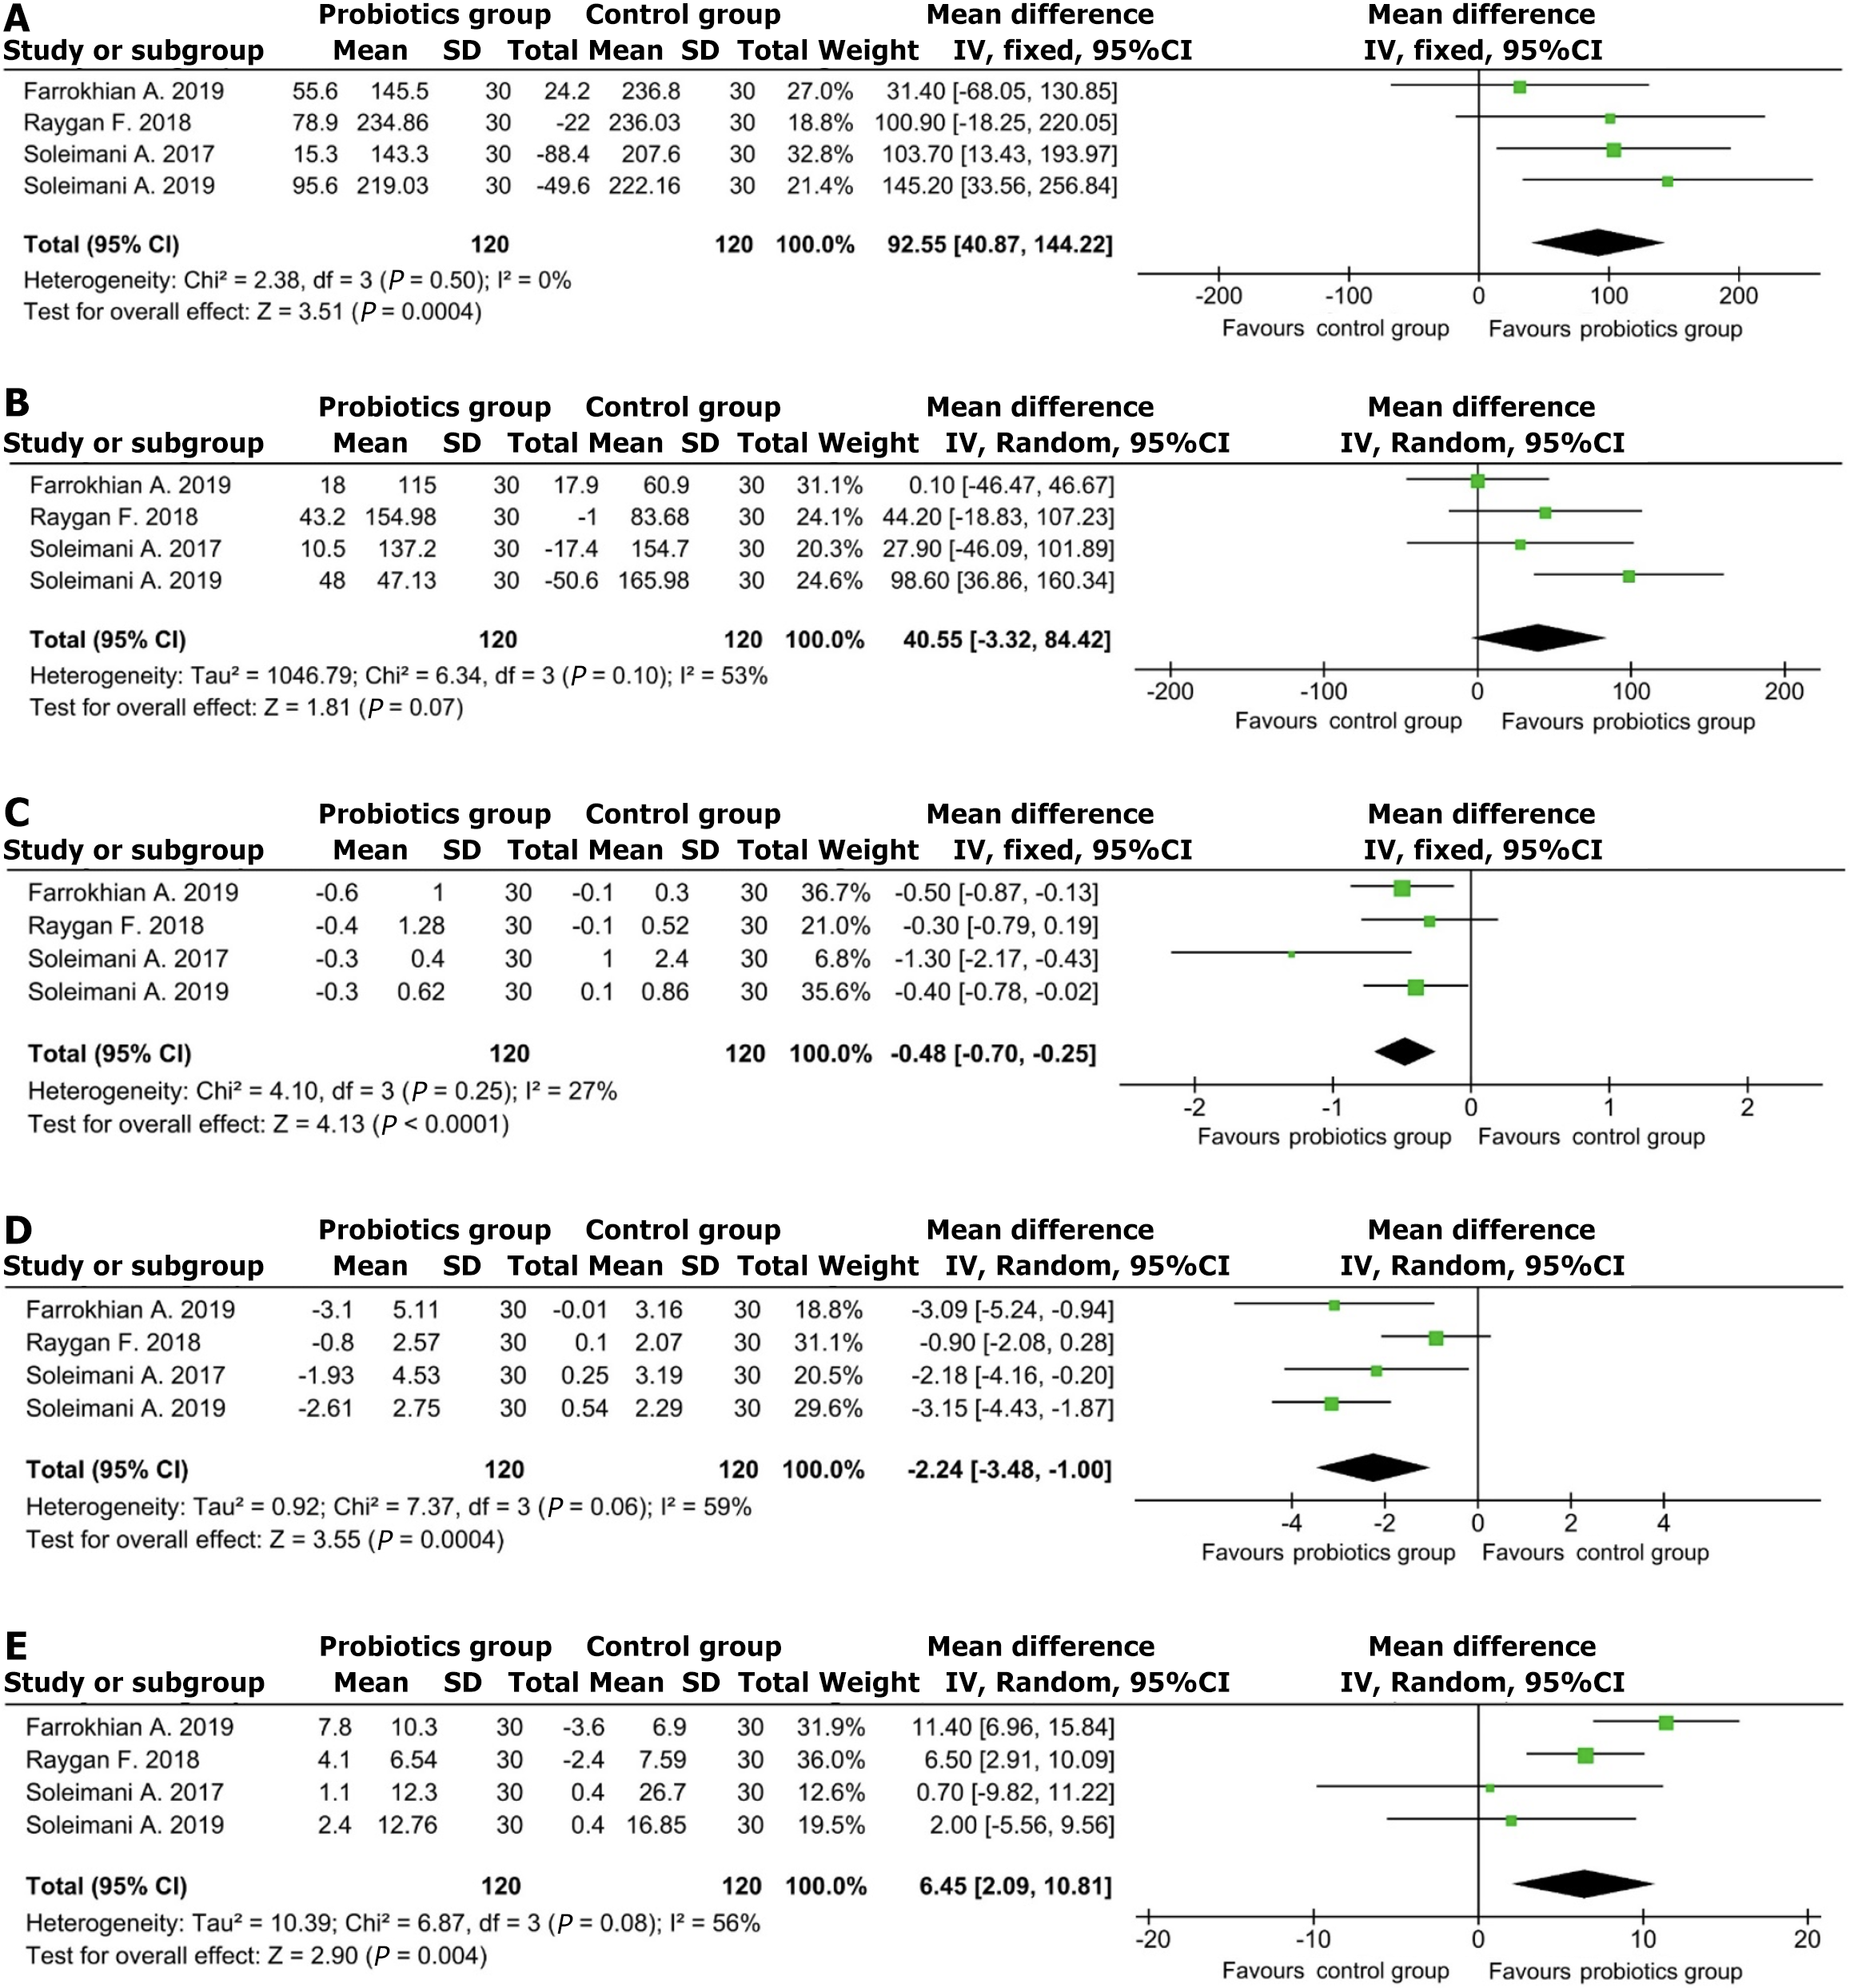
Figure 4 Efficacy of triple probiotic combination on oxidative stress and antioxidant parameters.
A: Serum total antioxidant capacity level; B: Serum glutathione level; C: Serum malondialdehyde level; D: Serum high sensitivity C-reactive protein level; E: Nitric oxide level.
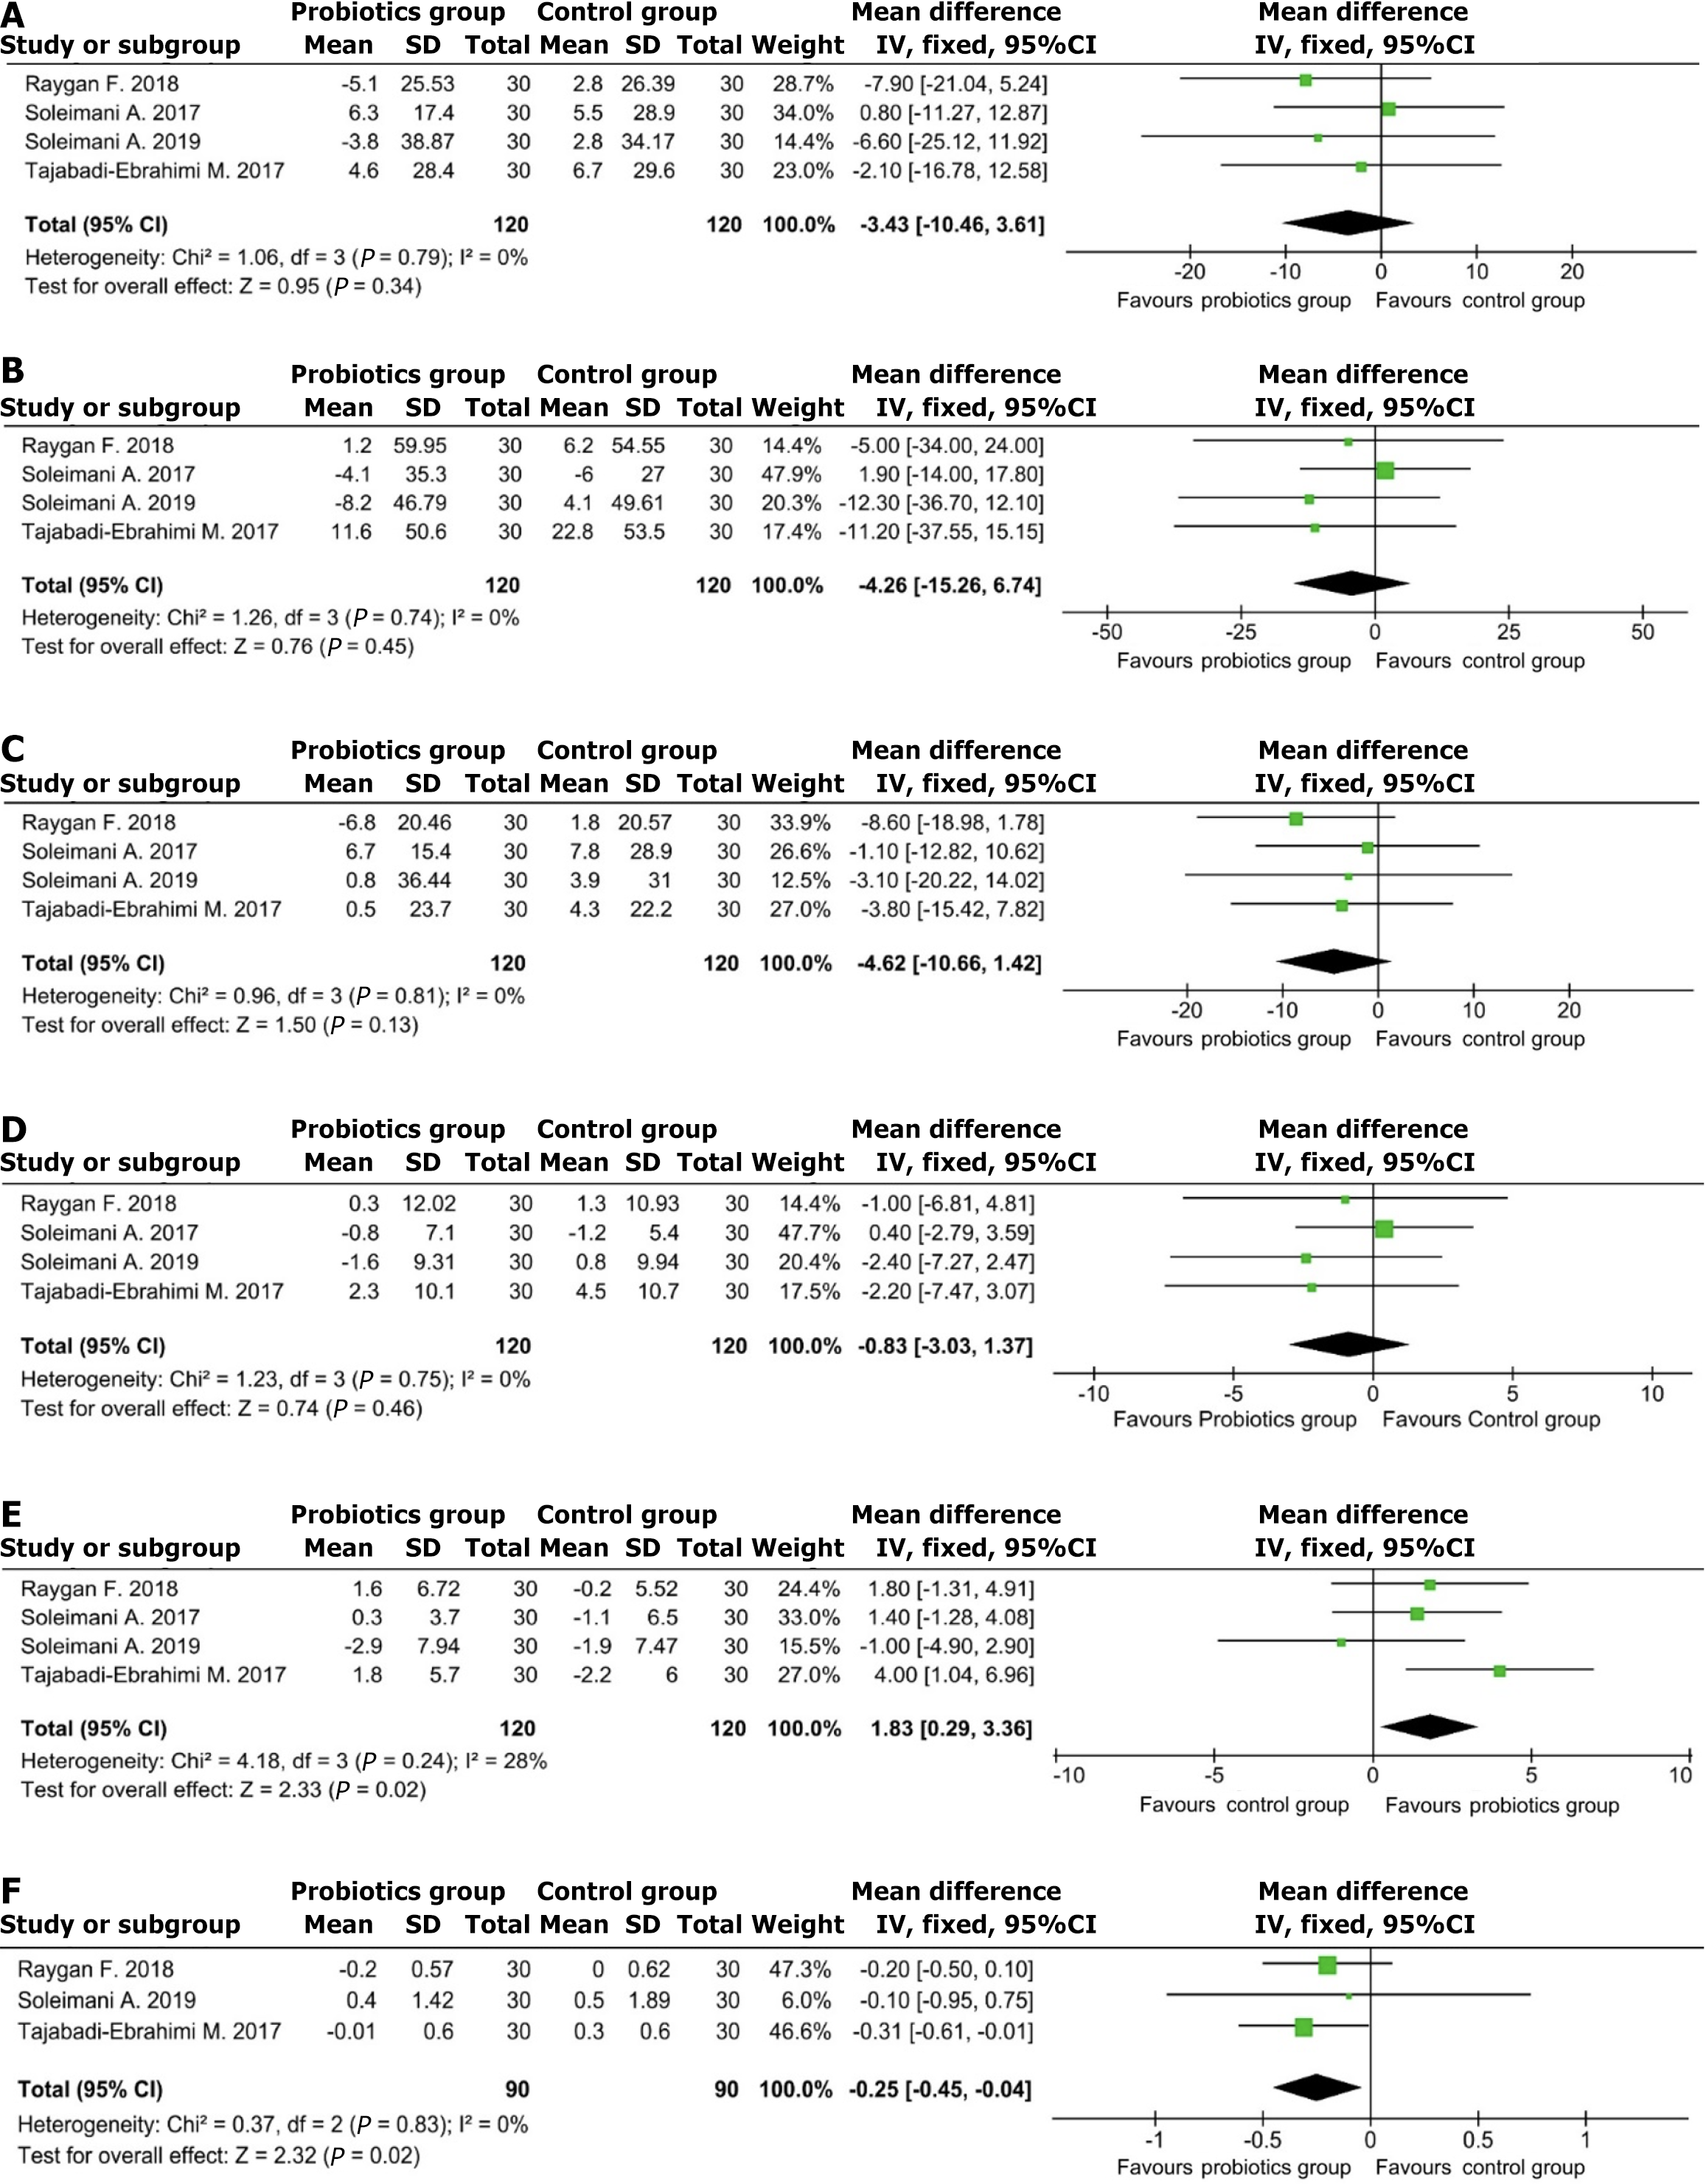
Figure 5 Efficacy of triple probiotic combination on lipid parameters.
A: Serum total cholesterol level; B: Serum triglycerides level; C: Serum low-density lipoprotein level; D: Serum very low-density lipoprotein level; E: High-density lipoprotein level; F: Total cholesterol/high-density lipoprotein level ratio.
- Citation: Dubey VP, Kansagra JJ, Kamani BK, Sureja VP. Triple probiotic combination effect on metabolic, oxidative stress, and inflammatory parameters in diabetic population: Systematic review and meta-analysis. World J Exp Med 2025; 15(3): 108467
- URL: https://www.wjgnet.com/2220-315X/full/v15/i3/108467.htm
- DOI: https://dx.doi.org/10.5493/wjem.v15.i3.108467


