Copyright
©The Author(s) 2025.
World J Exp Med. Sep 20, 2025; 15(3): 108034
Published online Sep 20, 2025. doi: 10.5493/wjem.v15.i3.108034
Published online Sep 20, 2025. doi: 10.5493/wjem.v15.i3.108034
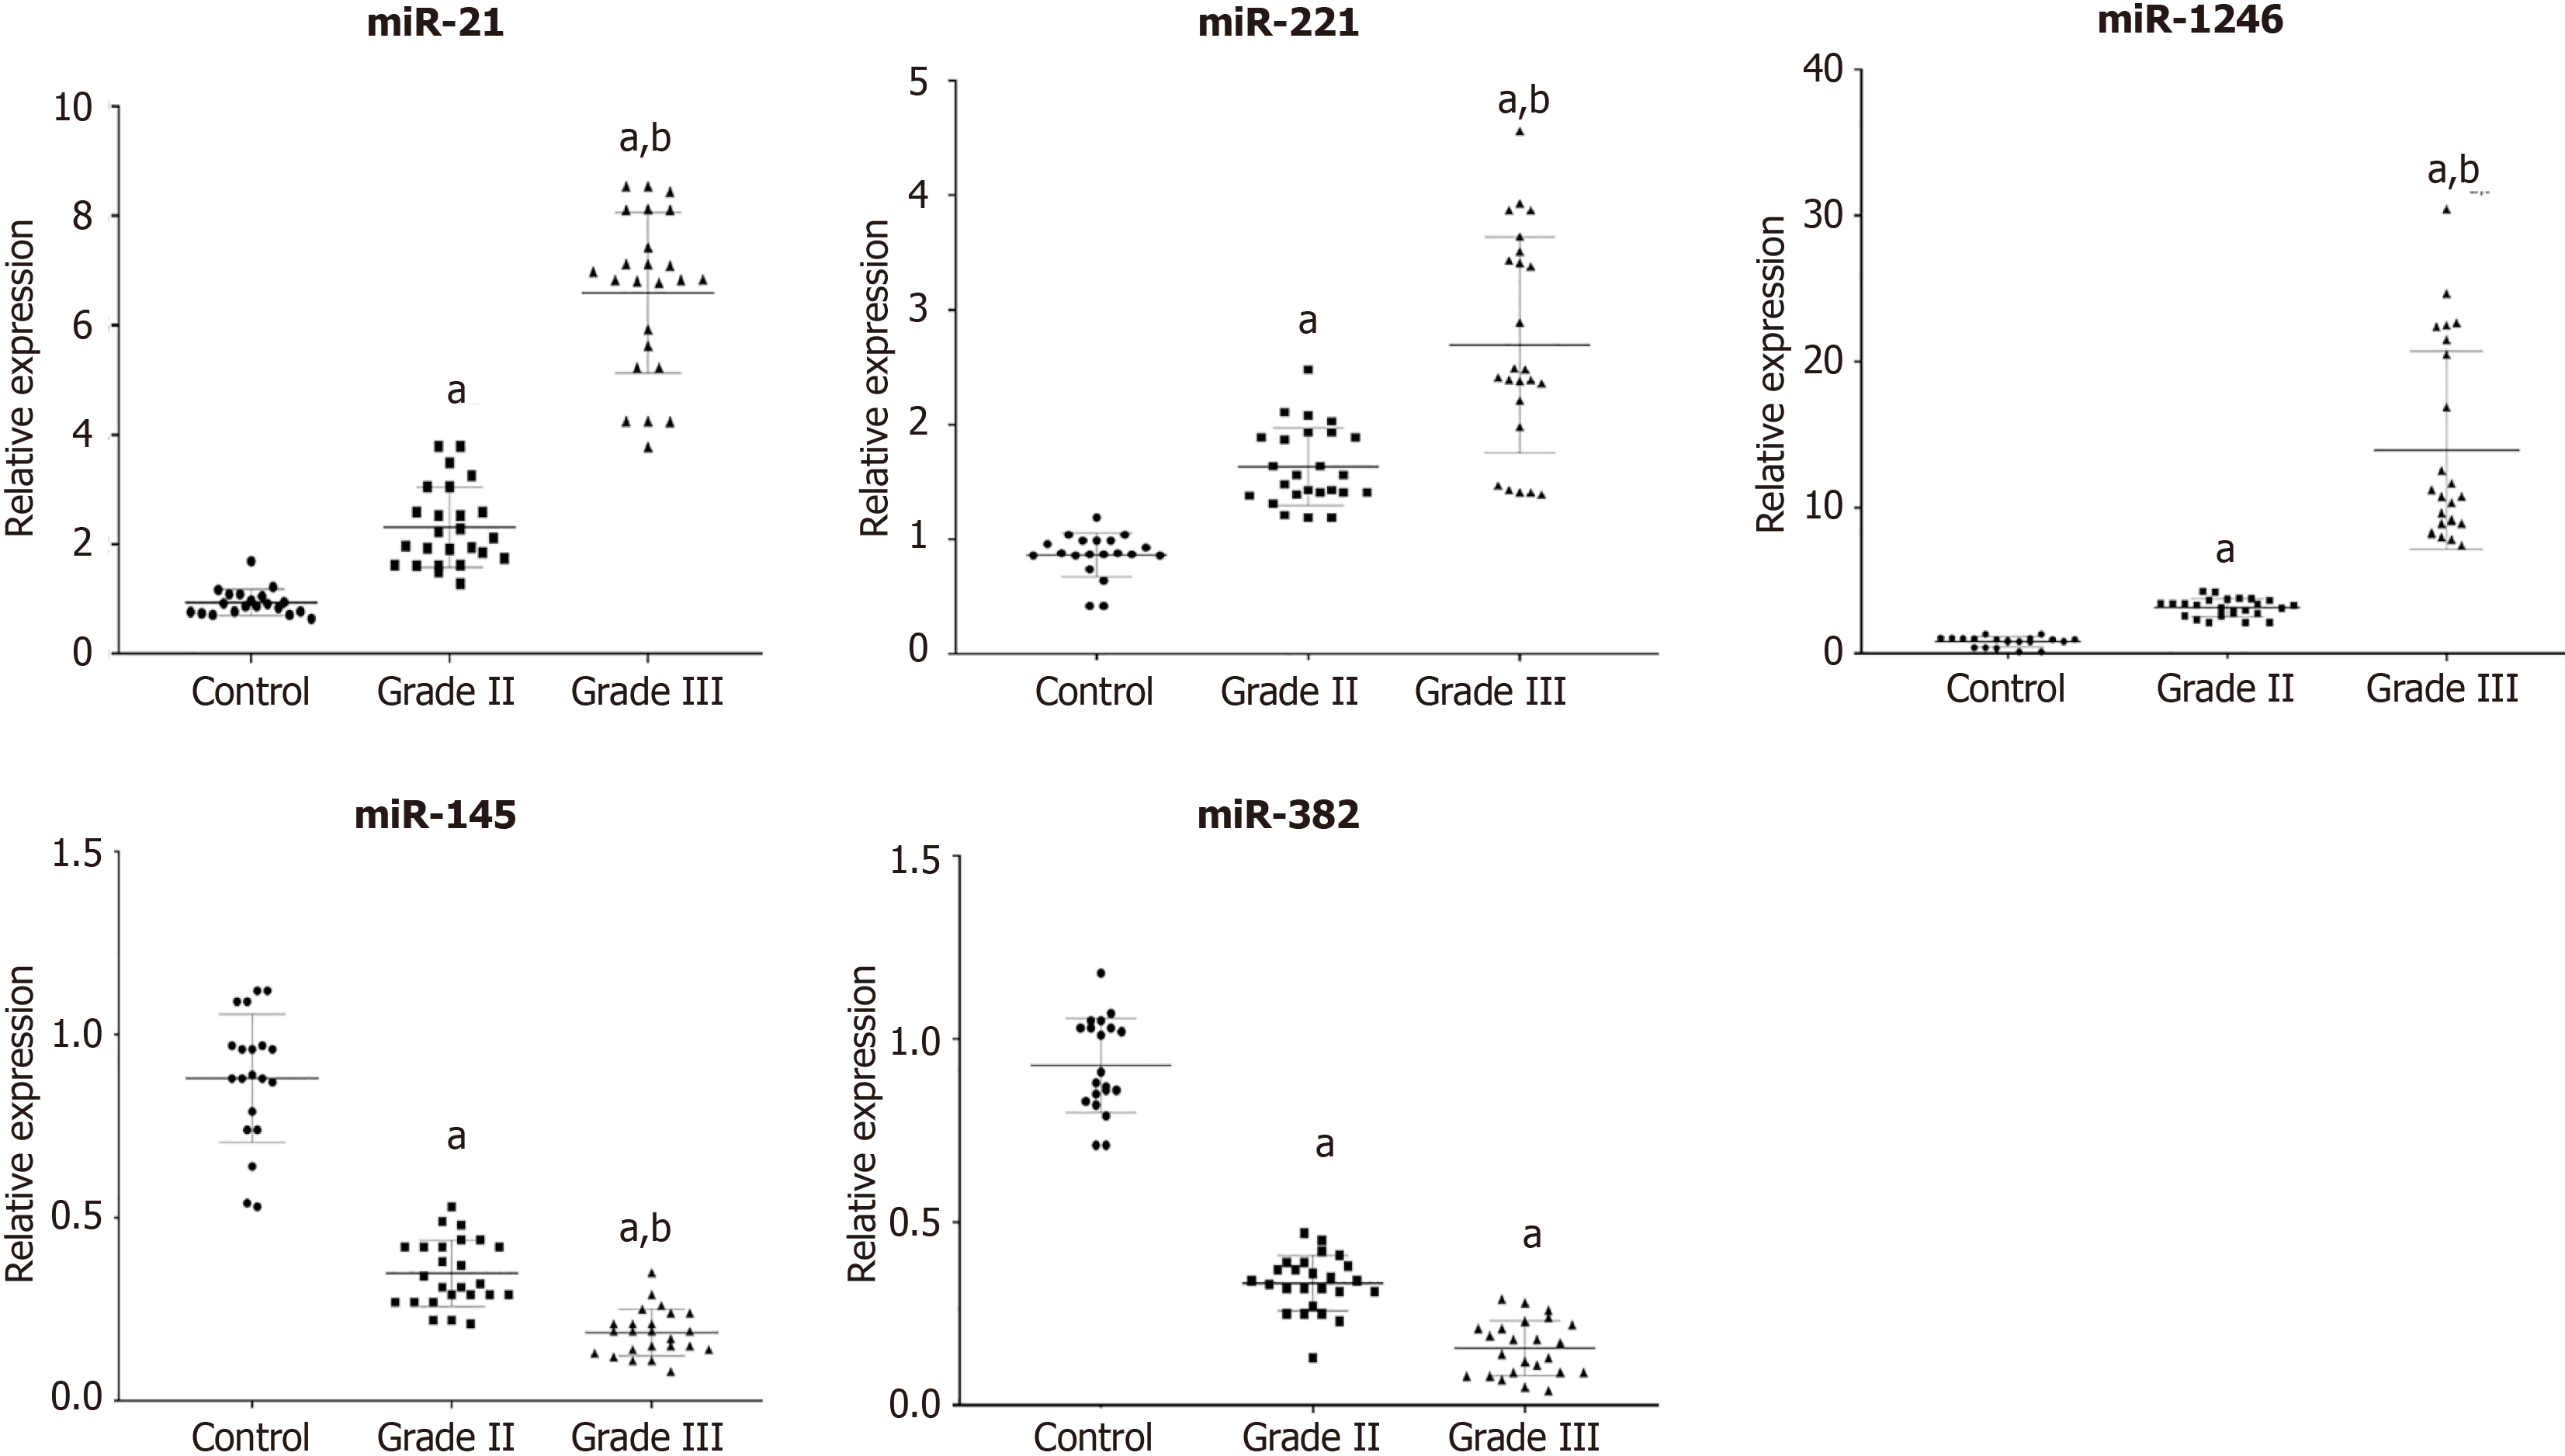
Figure 1 Relative expression values for the selected panel of microRNAs (miR-21, miR-221, miR-1246, miR-145, and miR-382) in breast cancer patients (grade II and grade III) and healthy controls.
Significance at aP < 0.05 compared to healthy control; significance at bP < 0.05 between grade II and grade III. MiRNAs: MicroRNAs.
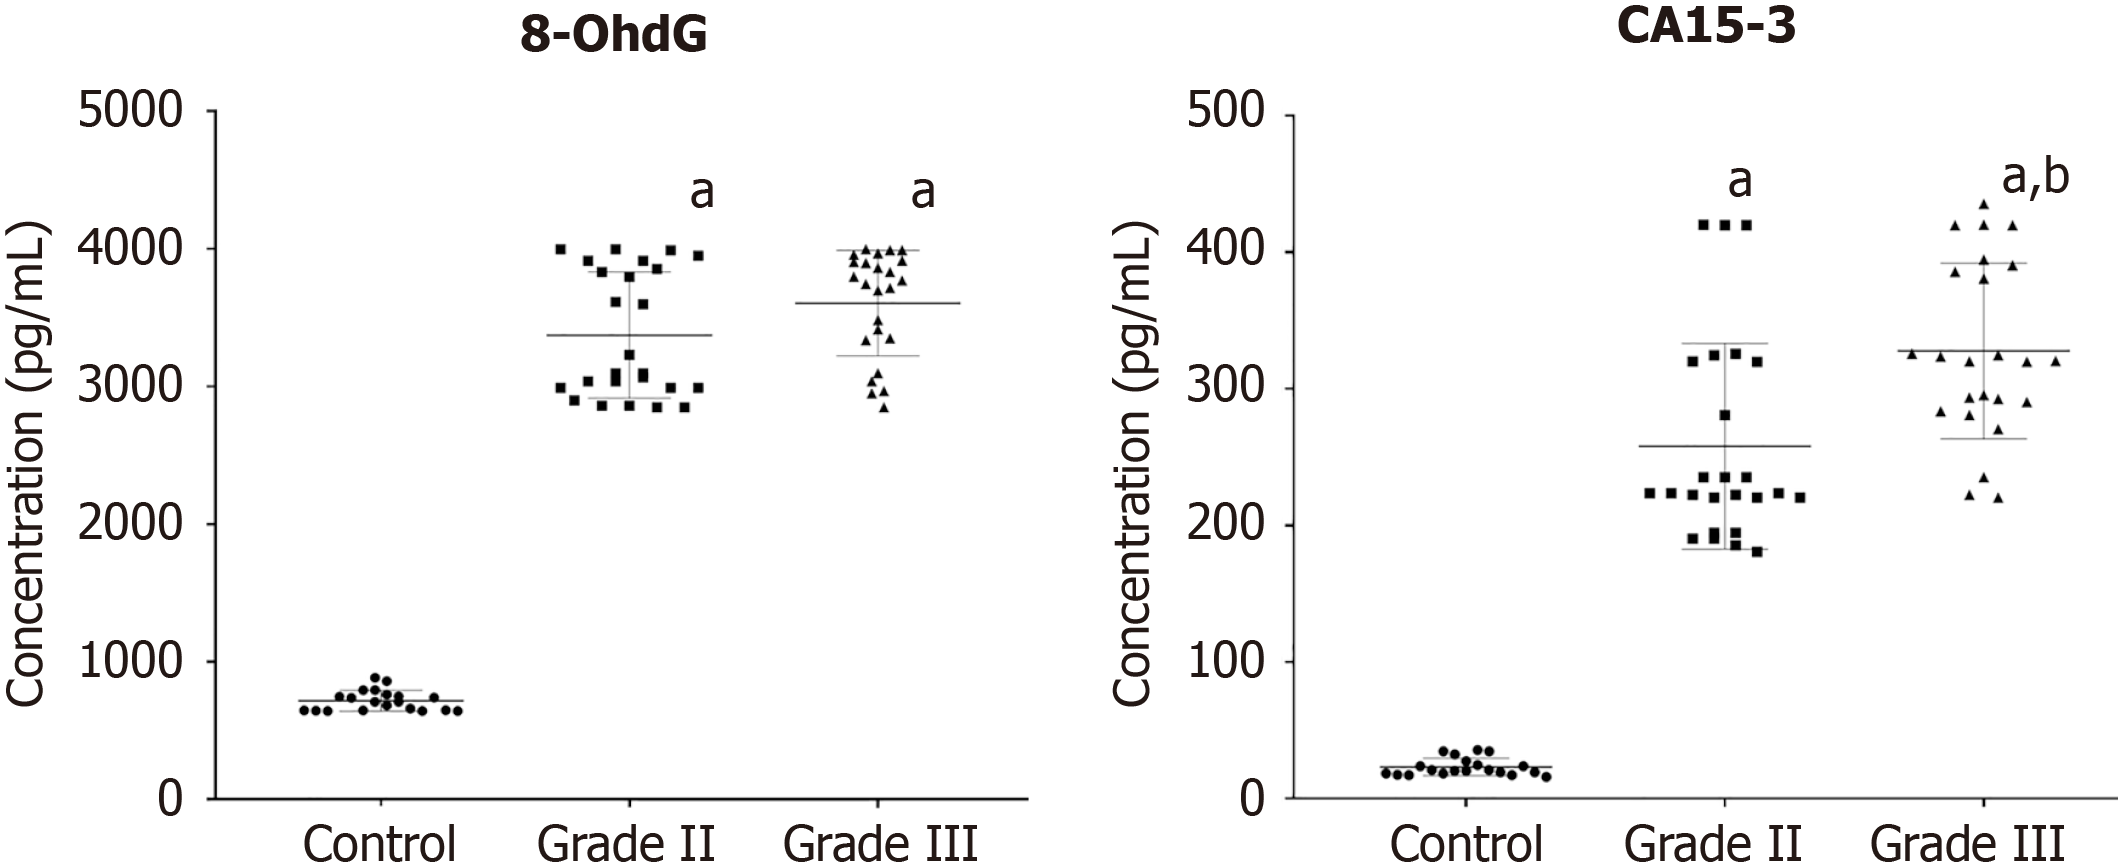
Figure 2 Serum levels of 8-hydroxy-2′-deoxyguanosine (pg/mL) and cancer antigen 15-3 (U/mL).
Significance at aP < 0.05 compared to healthy control; significance at bP < 0.05 between grade II and grade III. CA15-3: Cancer antigen 15-3; 8-OhdG: 8-hydroxy-2′-deoxyguanosine.
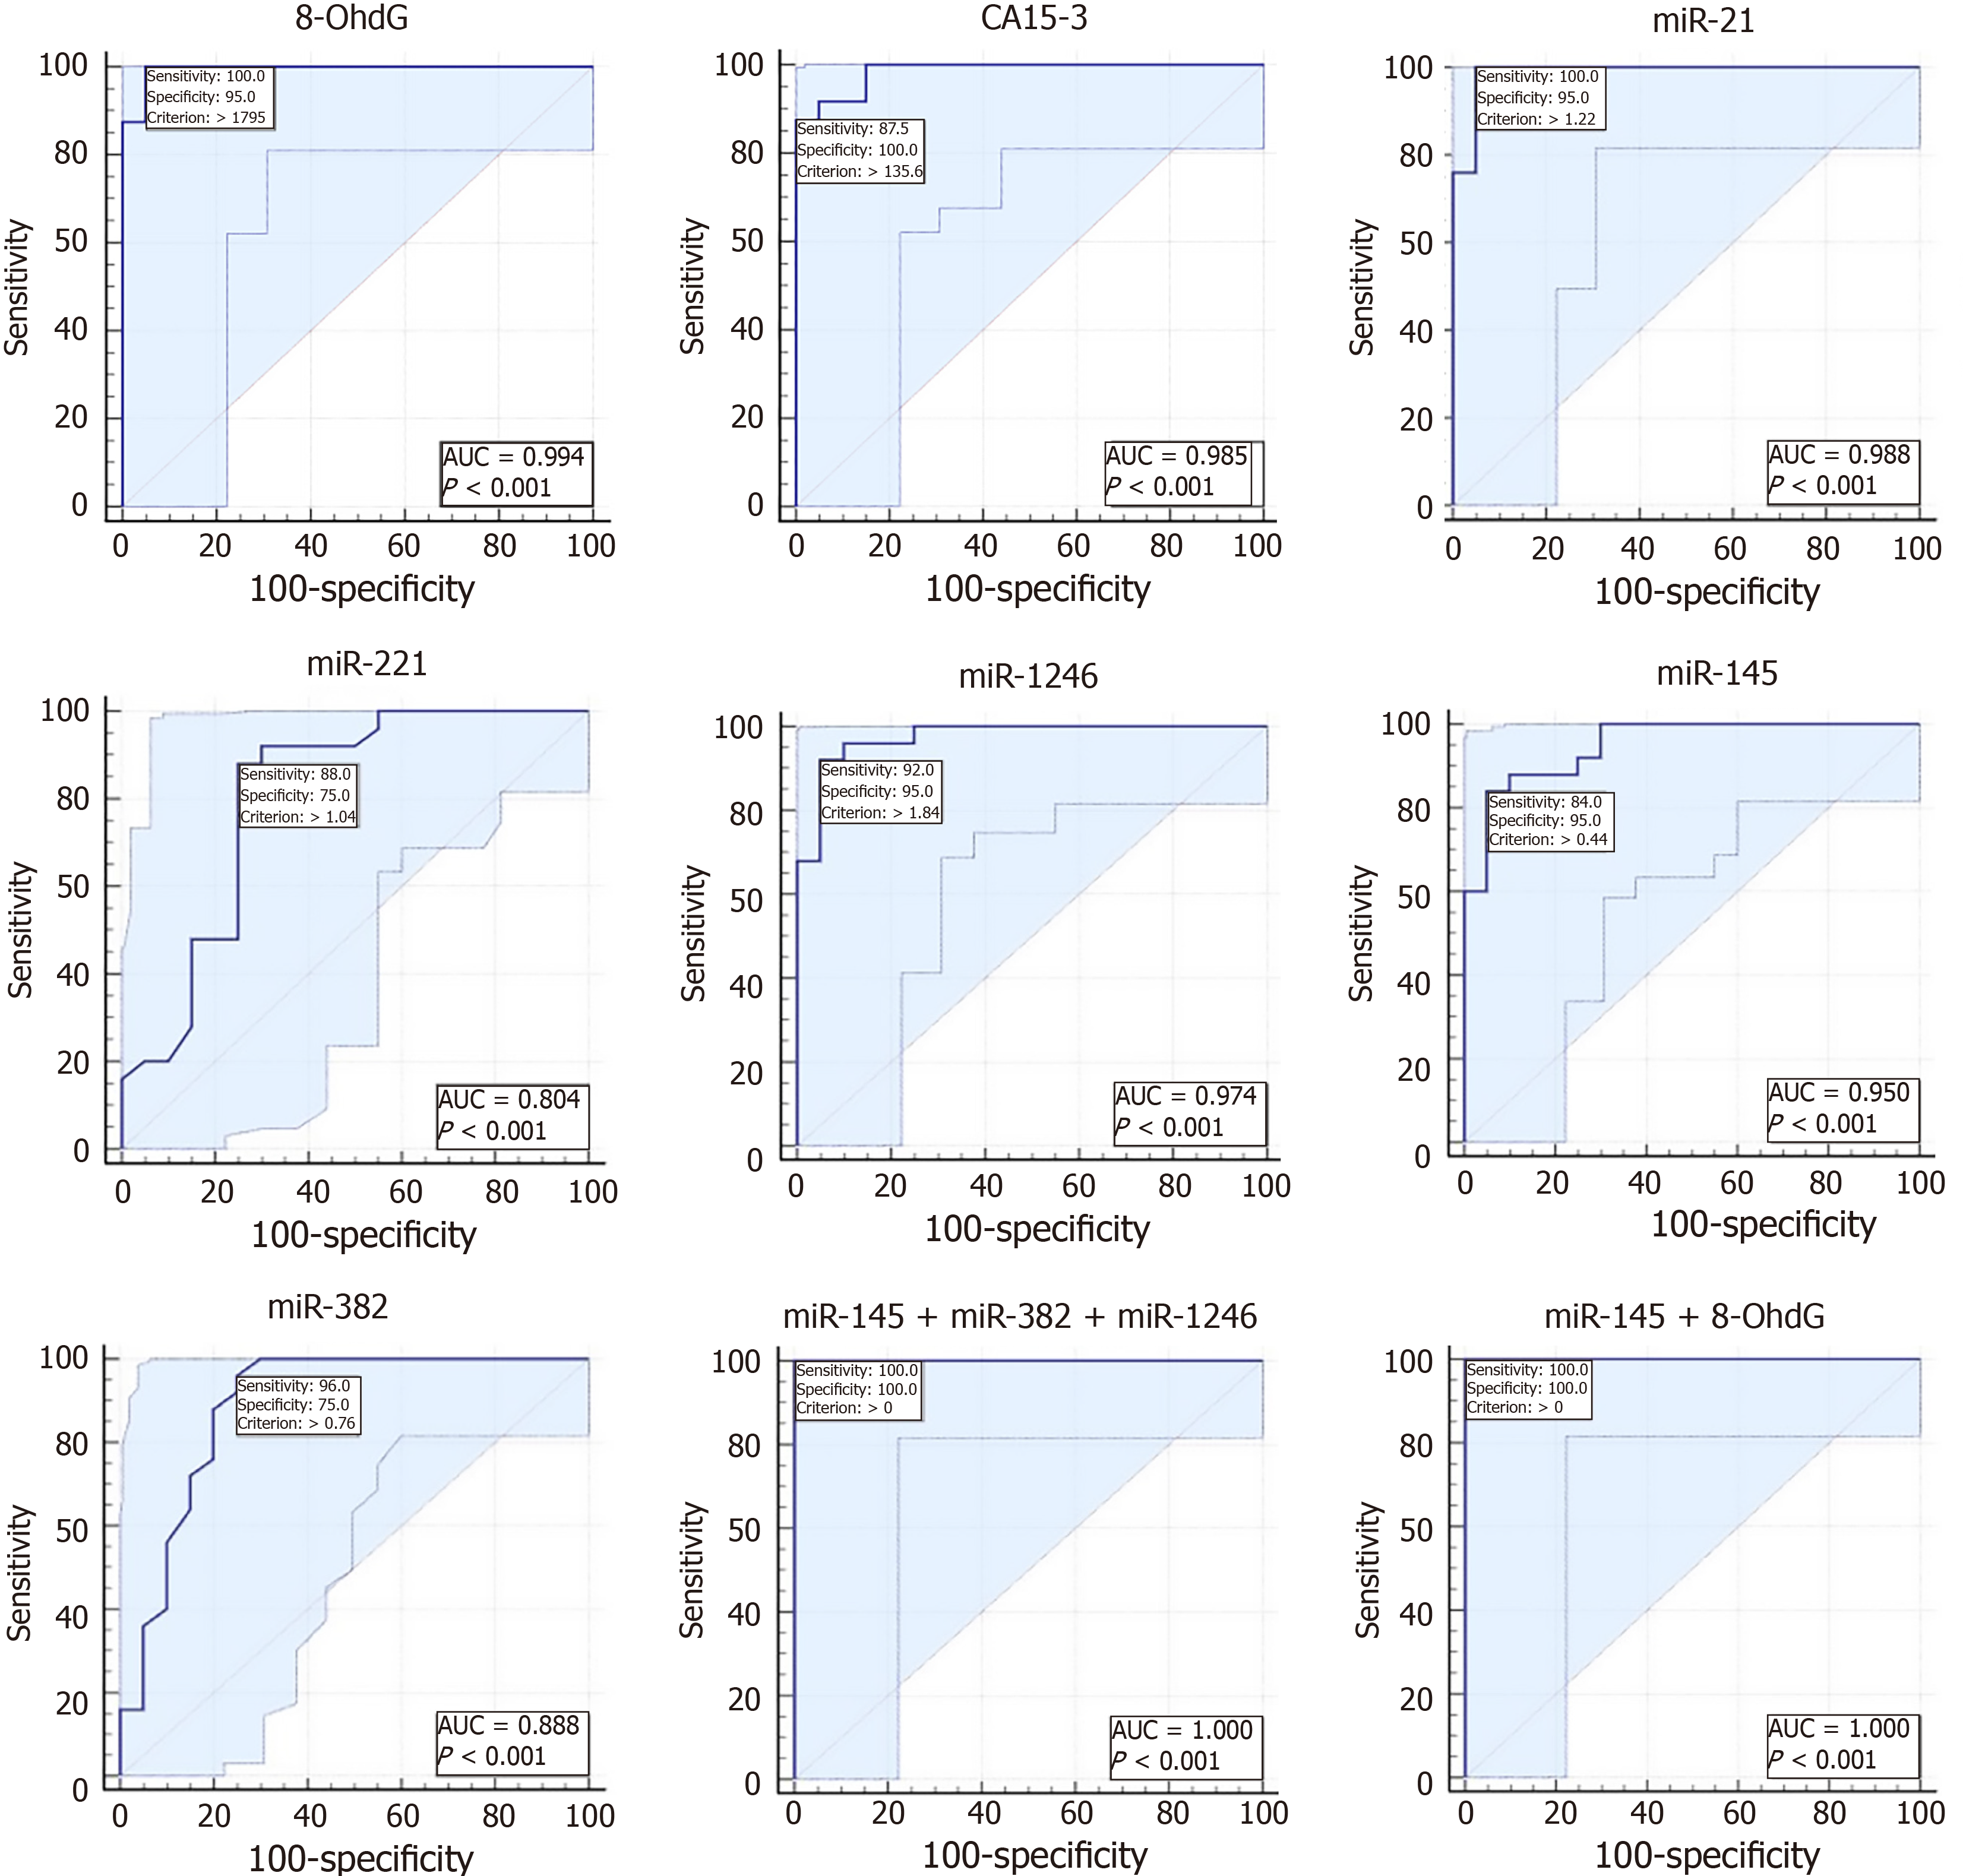
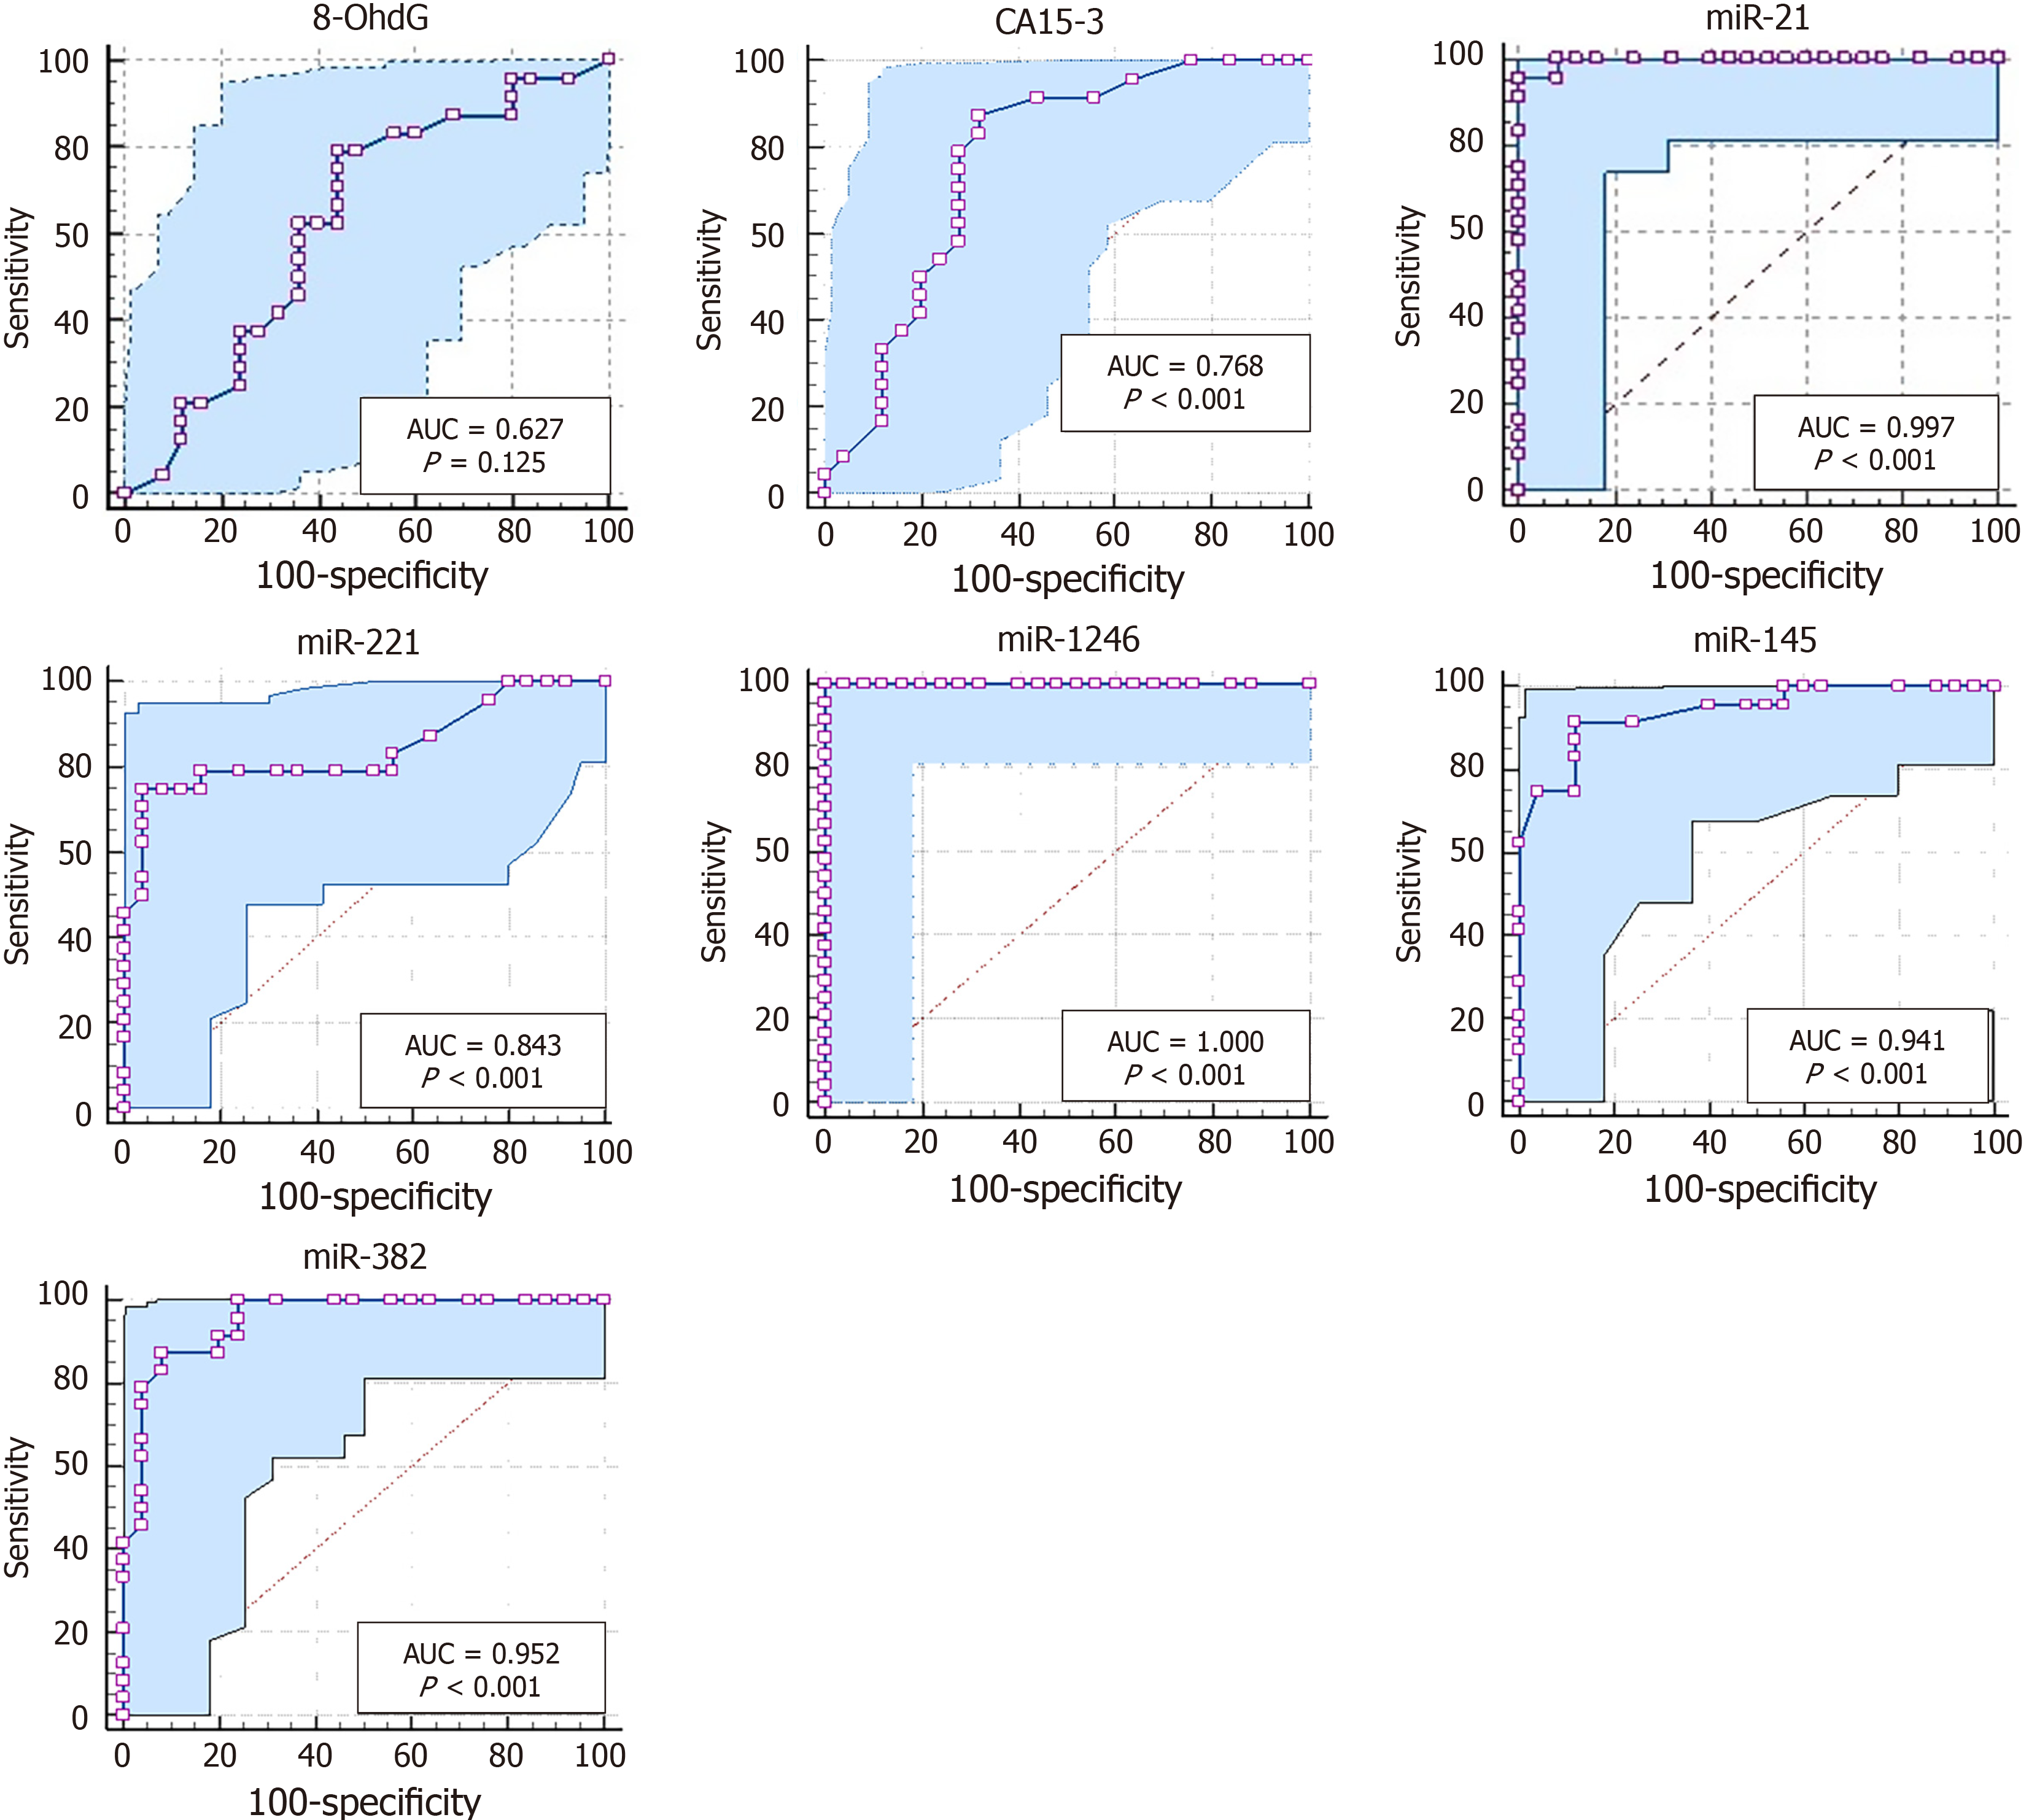
Figure 3 Receiver operating characteristic curve analysis demonstrating the diagnostic performance of selected microRNAs and protein tumor biomarkers in differentiating breast cancer patients (grade II) from healthy controls.
AUC: Area under the curve; CA15-3: Cancer antigen 15-3; MiRNAs: MicroRNAs; 8-OhdG: 8-hydroxy-2′-deoxyguanosine.
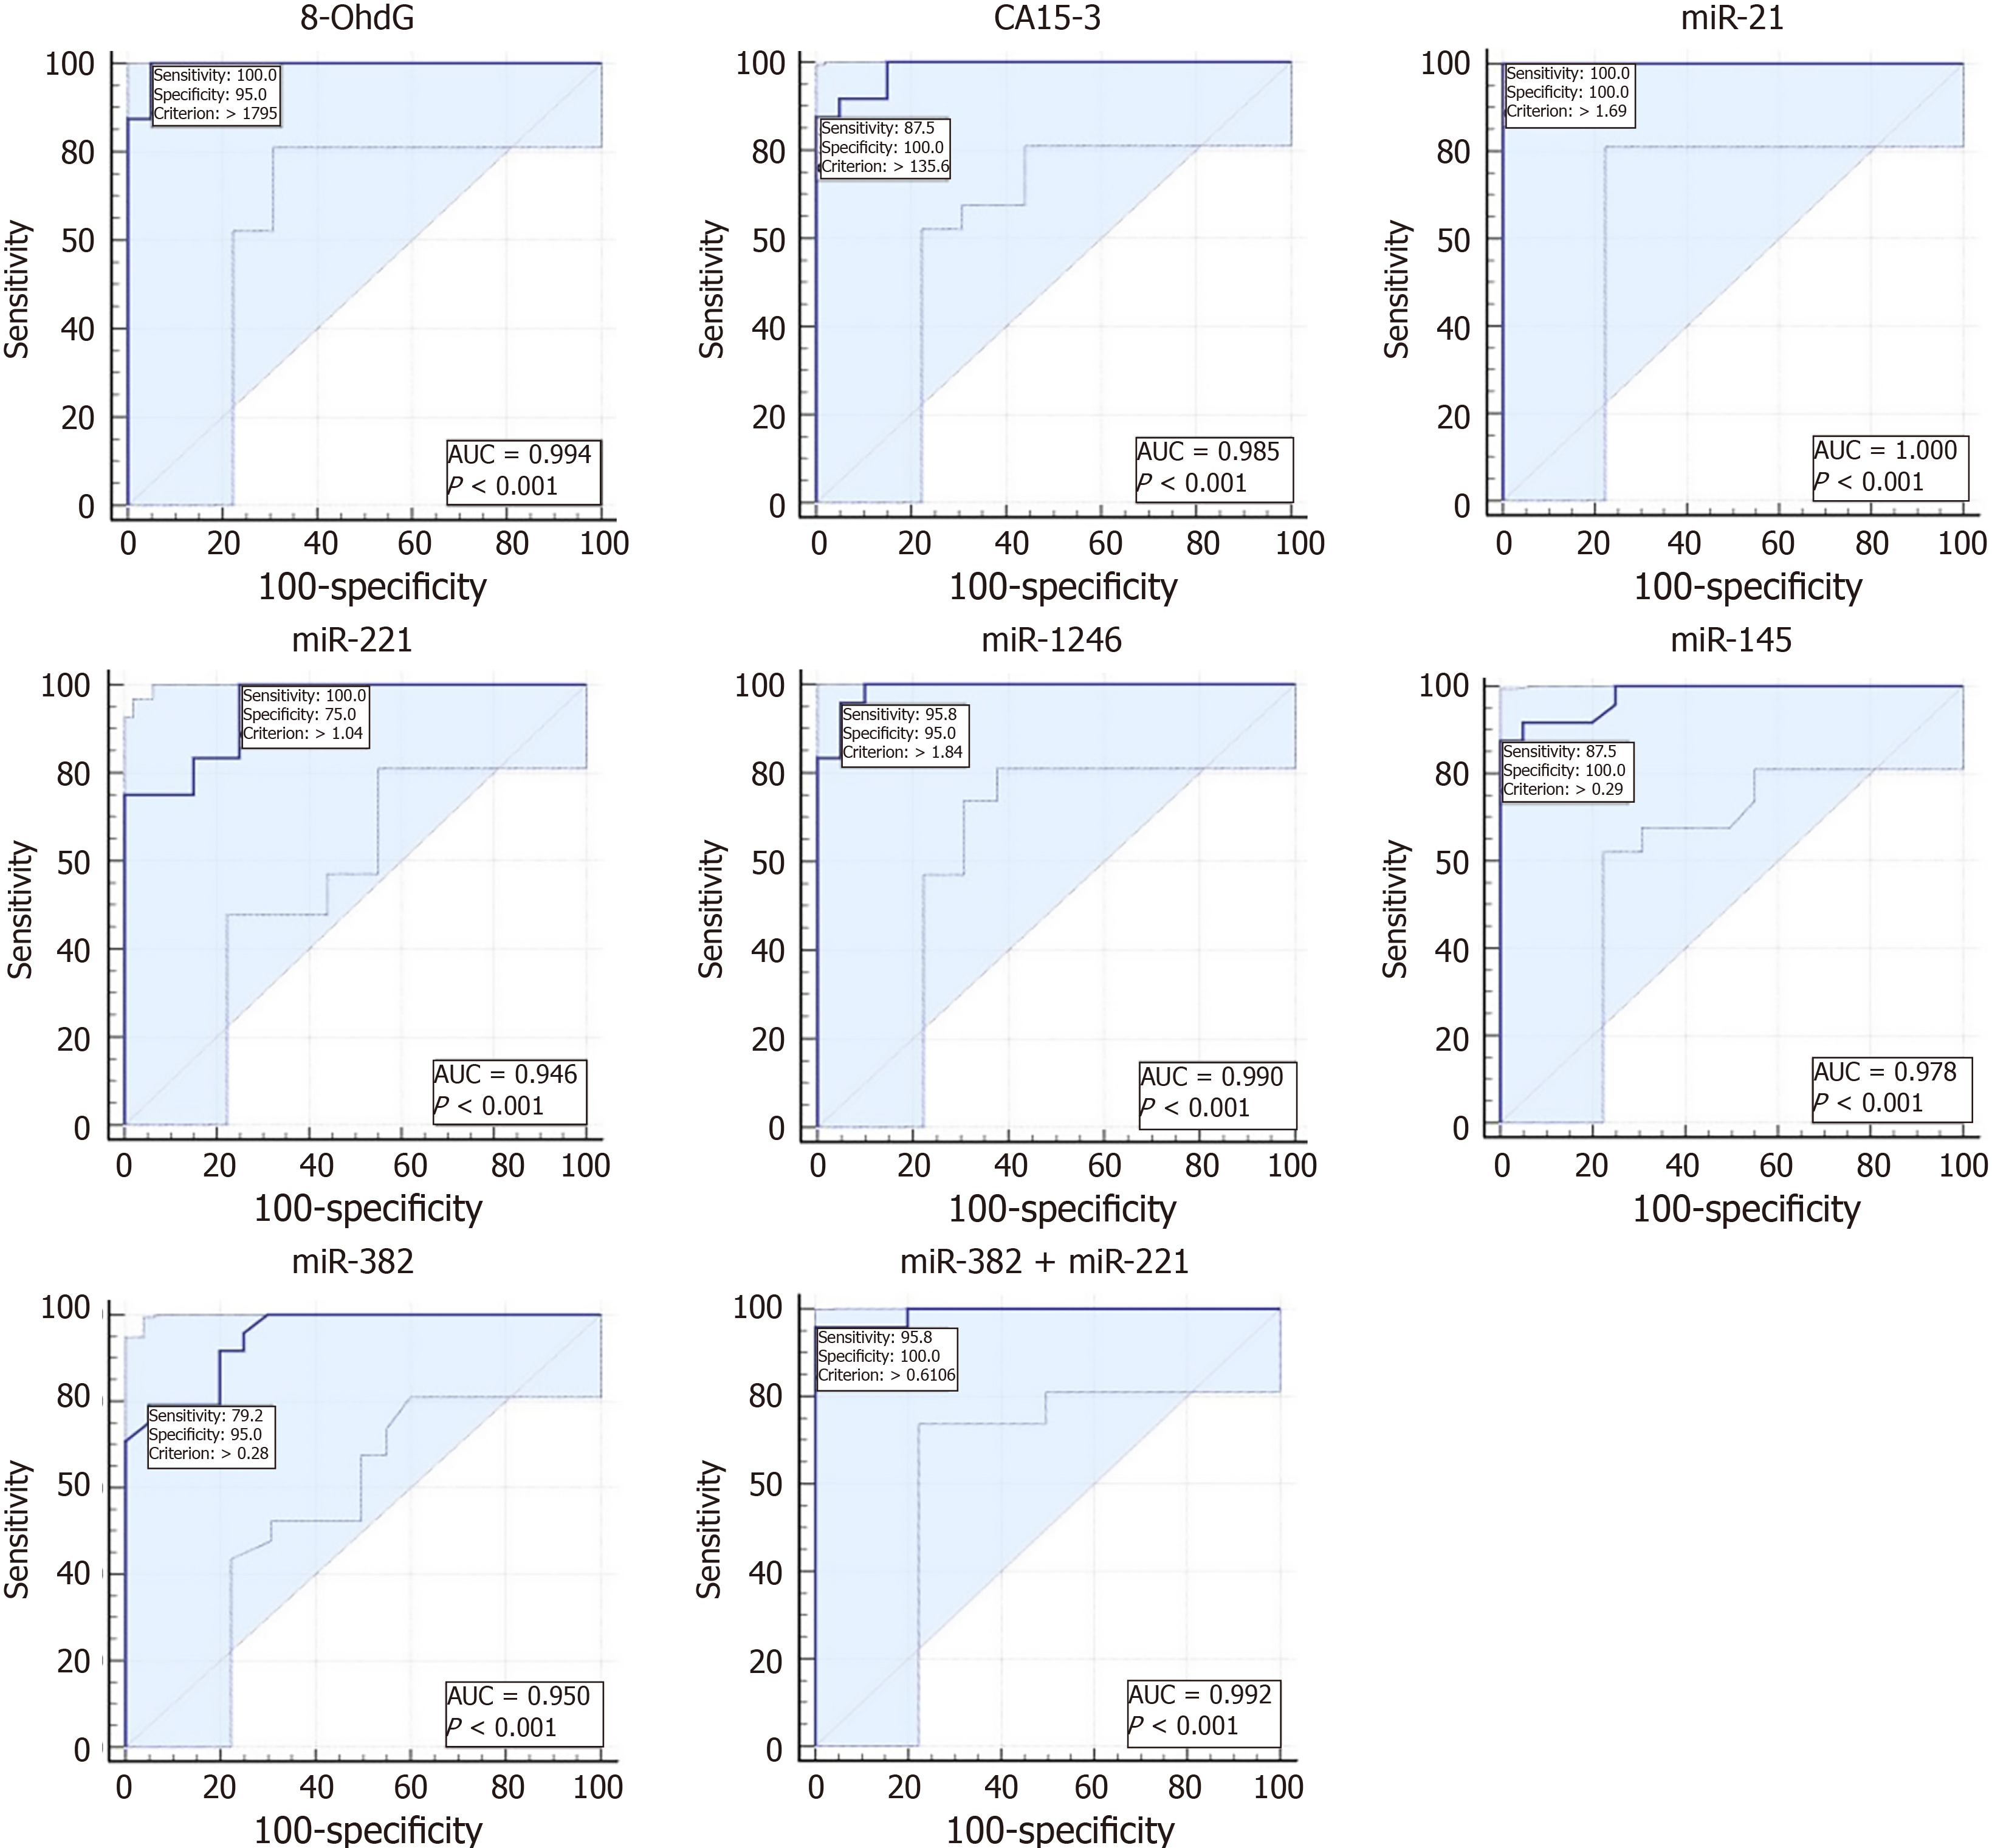
Figure 4 Receiver operating characteristic curve analysis demonstrating the diagnostic performance of selected microRNAs and protein tumor biomarkers in differentiating breast cancer patients (grade III) from healthy controls.
AUC: Area under the curve; CA15-3: Cancer antigen 15-3; MiRNAs: MicroRNAs; 8-OhdG: 8-hydroxy-2′-deoxyguanosine.
Figure 5 Receiver operating characteristic curve analysis demonstrating the diagnostic performance of selected microRNAs and protein tumor biomarkers in differentiating breast cancer patients (grade II vs grade III).
AUC: Area under the curve; CA15-3: Cancer antigen 15-3; MiRNAs: MicroRNAs; 8-OhdG: 8-hydroxy-2′-deoxyguanosine.
- Citation: El-Toukhy SE, Nabih HK, Kamel MM, Elmasry H, El-Daly SM. Circulating microRNAs and serum proteins in breast cancer patients: Diagnostic relevance and grade-specific expression patterns. World J Exp Med 2025; 15(3): 108034
- URL: https://www.wjgnet.com/2220-315X/full/v15/i3/108034.htm
- DOI: https://dx.doi.org/10.5493/wjem.v15.i3.108034


